components of beta-diversity in faunas from Tocantins river valley
Tonial, MLS.
a, Silva, HLR.
a,b, Tonial, IJ.
a, Costa, MC.
a,
Silva Júnior, NJ.
a,band Diniz-Filho, JAF.
c*
aSystema Naturae Consultoria Ambiental Ltda, Rua 58, 217, Quadra Bloco 4, Lote16, Jardim Goiás, CEP 74810-250, Goiânia, GO, Brazil
bDepartamento de Biologia, Pontifícia Universidade Católica de Goiás – PUC Goiás, Goiânia, GO, Brazil cDepartamento de Ecologia, Instituto de Ciências Biológicas – ICB, Universidade Federal de Goiás – UFG,
Goiânia, GO, Brazil *e-mail: [email protected]
Received July 6, 2011 – Accepted October 19, 2011 – Distributed August 31, 2012
(With 1 figure)
Abstract
There has been a resurging interest in patterns of β-diversity, especially by the mechanisms driving broad-scale, continental and global patterns, and how partitioning β-diversity into richness (or nestedness) and turnover components
can be linked with such mechanisms. Here we compared two recent methodologies to find richness and turnover
components of β-diversity, using a large regional scale dataset of mammal, bird, reptiles and amphibian species found in seven regions of Central, North and Northeastern Brazil. As well as a simple comparison of the metrics available,
we analyzed spatial patterns (i.e., distance-decay similarity) and the effects of biome type in these components using raw and partial Mantel tests. Our analyses revealed that turnover estimated using Baselga’s (2010) approach is slightly higher than the estimate using Carvalho’s et al. (2012) approach, but all analyses show consistent spatial patterns in
species turnover using both methods. Spatial patterns in β-diversity revealed by Mantel tests are also consistent with expectations based on differential dispersal abilities. Our results also reinforce that spatial patterns in β-diversity, mainly in the turnover components expressing faunal differentiation, are determined by a mix or broad scale environmental effects and short distance spatially-structured dispersal.
Keywords: faunal similarity, β-diversity, turnover, richness, nestedness.
Padrões geográficos e desdobramento entre componentes de substituição e riqueza da
diversidade-beta em faunas do Centro e do Nordeste do Brasil
Resumo
Tem havido um interesse crescente nos padrões de diversidade-β, particularmente acerca dos mecanismos subjacentes a esses padrões em escalas continentais e globais, e sobre o modo como esses mecanismos podem ser associados ao desdobramento desses padrões em componentes de riqueza e substituição (turnover) de espécies. Neste artigo, nós
comparamos duas metodologias desenvolvidas recentemente para realizar esse desdobramento, utilizando conjuntos
regionais de espécies de mamíferos, aves, répteis e anfíbios em sete regiões no Nordeste, Norte e no Centro do Brasil. Além de comparar os dois conjuntos de índices utilizados para o desdobramento dos componentes da diversidade-β, foram analisados os padrões espaciais e os efeitos do bioma no qual são encontradas as regiões nesses componentes por meio de testes de Mantel e testes de Mantel parciais. Embora não tenham sido encontradas diferenças na magnitude das estimativas de diversidade-β entre os grupos, foi possível detectar diferenças significativas entre os padrões espaciais,
principalmente no componente de substituição, sugerindo que os padrões na variação de composição são determinados por um balanço entre efeitos ambientais em grandes escalas e por processos de dispersão espacialmente estruturados.
1. Introdução
Since the classical paper of Whittaker (1972), the partition
of diversity into multiple components, such as α, β and
γ, has been done using several techniques. Conceptually,
α- diversity is the number of species in a given sample or locality, whereas the β-diversity indicates the difference among localities (the γ being, thus, the sum of α and β
component, providing an estimate of regional diversity)
(see Tuomisto, 2010a, b; Anderson et al., 2011 for a recent
review and redefinition of these concepts). In the last 10
years, some papers started to investigate these patterns using continental and global datasets (e.g., Gaston et al.,
2007; Qian, 2009; Melo et al., 2009) and these triggered
a whole new set of questions regarding the mechanisms driving species turnover at broad geographical scales.
It has been recognized for a while that the several metrics available for estimating β-diversity capture different components of differences among sites or regions (e.g.,
Harrison et al., 1992; Lennon et al., 2001; Koleff et al., 2003), but Baselga (2010) recently proposed that these components
could be formally partitioned using these different metrics. The idea is that the difference among species in two faunas
could be due to a replacement of species (turnover) or due
to a shift in species richness (or nestedness component, in which a poorer-fauna is composed by a subset of species of
a richer fauna – see Almeida-Neto et al. 2012). Moreover, Baselga (2010) focused on the interpretation of the balance
among nestedness and turnover components and on how this balance could be linked to macroecological patterns and processes associated to the more general latitudinal gradients in biodiversity. He proposed a geographical pattern in the nestedness component, which would be
stronger at higher latitude. This pattern was confirmed by Dobrovolski et al. (2012), based on beta-diversity variation
in New World mammals, birds and amphibians (see also
Melo et al., 2009). Baselga’s (2010) partition has been
widely used to describe patterns in beta diversity and to support hypotheses about ecological and evolutionary processes driving biodiversity patterns at distinct scales
(e.g., Hortal et al., 2011; Andrew et al., 2012).
Despite the large interest in Baselga’s (2010) approach
to partition beta-diversity into distinct components, the details of the metrics used by him have been criticized on different grounds (e.g., Almeida-Neto et al., 2012;
Carvalho et al., 2012), and some improvements have been
proposed based on the same reasoning (Carvalho et al.,
2012; but see Baselga 2012). Here we analyzed a data set of
faunal similarity of terrestrial vertebrates in Central, North and Northeast Brazil to answer the following questions:
1. What is the difference between Baselga’s (2010) and the newer approach proposed by Carvalho et al. (2012)
for partition of β-diversity in a real, rather than simulated
or artificial, dataset? 2. Do organisms with
restricted-dispersal, such as amphibians, possess stronger β-diversity
than dispersal-prone organisms, like mammals and birds?
and 3. Do the different components of β-diversity (i.e.,
turnover and richness) possess distinct spatial patterns and
do these spatial patterns vary among groups of vertebrates
with distinct dispersal?
2. Methods
2.1. Data
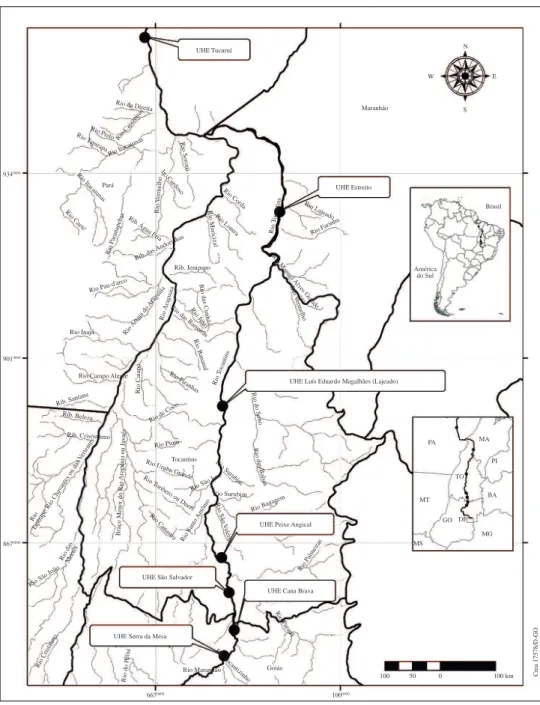
We obtained data of presence-absence of mammals
(186 species), birds (578 species), squamate reptiles (214 species) and amphibians (80 species) for seven regions in
Central, North and Northeastern Brazil. Data (i.e., species
lists) were compiled from several sources and by intensive sampling (see below) in these regions (Eletronorte, 1985a, b;
Systema Naturae Consultoria Ambiental Ltda, 1996, 1999, 2008, 2010a, b, 2011; Passamani, 2004; Pavan and Dixo, 2004; Pinheiro, 2004; Puorto and Barbarini, 2004;
Silva Junior and Sites, 1995). Data for these regions were
originally derived from studies conducted to access faunal characteristics in broad scale dam buildings found in areas from the Cerrado biome (including Serra da Mesa, GO; Cana Brava, GO; São Salvador, GO/TO and; Peixe
Angical, TO), in the Amazon biome (Tucuruí, PA) and in
transitions between Cerrado and Amazonia (Luís Eduardo
Magalhães, TO and Estreito, MA/TO).
Data for compiling faunal lists came from faunal inventories and rescues, as well as monitoring programs conducted for several years in the regions nearby the dam impact area. Full data matrix used for the analyses is available from the authors upon request. Despite a lack of homogeneity due to necessary variation in sampling efforts across habitats within localities and among different teams conducting faunal analyses in these regions, these studies represent fauna variation at regional scales. The potential problems in the data certainly would affect more detailed
analysis of faunal patterns at a finer geographical scale,
but are suitable for comparing different regions because they tend to represent exhaustive species lists for each region. We expect thus that our ecological conclusions are unlikely to be qualitatively affected by data issues.
2.2. Partitioning β-diversity into richness and turnover components
We analyzed the dataset described above using the
approaches proposed by Baselga (2010) and Carvalho et al. (2012). The details of computation and derivation of the
formulae used can be found in these original papers, and only a brief description of the formulae used for calculations is given below.
All metrics used for β-diversity among two localities or regions, say 1 and 2, start by the well-known computation of counts of a (number of species common to both regions
or localities), b (number of species exclusive of region
or locality 1), c (number of species exclusive of region
or locality 2) and d (species not found in both regions or
localities). According to Baselga’s (2010) approach, the
overall β-diversity is computed by Sorensen’s dissimilarity
index, given by (Equation 1)
which can be additively partitioned into turnover (βSIM) and nestedness (βNEST) components as (Equation 2)
βSOR = βSIM + βNEST (2)
where (Equation 3)
βSIM = min (b, c)/a + min (b, c) (3)
and (Equation 4)
βNEST = [(b – c)/(a + b + c)] * [a/a + min(b,c)] (4)
Notice that these quantities and indices are expressed here as dissimilarities to better match the notion of diversity
(i.e., larger numbers expressing more diversity), and not
as similarities among faunas, as more frequently done in ecological studies. Therefore, βSIM express turnover between the two regions or localities as the proportion of the species-poorer region, whereas βNEST is better viewed as a proportion of richness difference (the βSOR, which is
the first term in the equation of βNEST), multiplied by the
proportion of the species-poorer region or locality that is nested in the species-richer region (the second term in
the equation). Almeida-Neto (2012), among other things,
criticized the use of the term “nestedness” in this context
mainly because other more specific measurements have
been proposed and widely tested in a different context
(e.g., Almeida-Neto et al., 2008).
Carvalho et al. (2012) criticized the metrics used by Baselga’s (2010) and pointed out that βSIM overestimates the turnover component, and proposed different metrics for making the partition. The overall reasoning is the same, but the overall beta-diversity is computed based on Jaccard’s complement, rather than Sorensen, and is
given by (Equation 5)
βCC = [(b + c)/(a + b + c)] (5)
where partition is given by (Equation 6)
βCC = β–3 + βrich (6)
Where β–3 and βrich are the metrics for differences in species
turnover and richness (“nestdness”, in Baselga’s, (2010) terminology), respectively, and are given by (Equation 7)
β–3 = 2* [(min(b, c)/(a + b + c)] (7)
and (Equation 8)
β–3 = [(b – c)/(a + b + c)] (8)
We computed the metrics described above for our dataset for total β-diversity (i.e., all 1058 species), and its richness and turnover components, as well as for the four groups of terrestrial vertebrates separately. We computed pairwise matrices for all dissimilarities among the seven regions and obtained the mean values of all pairwise comparisons. The relative importance of turnover, according
to Baselga (2010) and Carvalho et al. (2011) metrics, was thus obtained by (Equation 9)
TB (%) = (βSIM/βSOR) *100 (9) and (Equation 10)
TC (%) = (β–3/βCC) *100 (10)
2.3. Spatial patterns in β-diversity components
The spatial patterns in β-diversity and its components, calculated using the formulae described above, were
analyzed by a Mantel test (Manly, 1998) between the
pairwise matrices of β-diversity and the geographic distance among sites, transformed to natural logarithms to linearize the relationship. The matrix correlation of the Mantel test was tested using 999 random permutations.
The seven regions were located in different biomes, as pointed out above (4 in Cerrado, 1 in the Amazonia and
2 in Cerrado-Amazonia transitions), and this can affect
the spatial patterns of β-diversity and its components. We added this biome effect as a discrete model matrix (see
Manly, 1985; Legendre and Legendre, 1998) by performing
a Mantel test between pairwise matrices of β-diversity and its components with a model matrix, with 1 indicating that the pair of regions compared is in the same biome and zero elsewhere. We also analyzed patterns in beta diversity by partial Mantel tests, so it is possible to test the effect of biome independently of geographical distance and of the geographical distance independently of the biome.
β-diversity indices were computed using a Q-BASIC program written for this paper, whereas Mantel tests were
performed using SAM 4.0 (Rangel et al., 2006, 2010).
3. Results
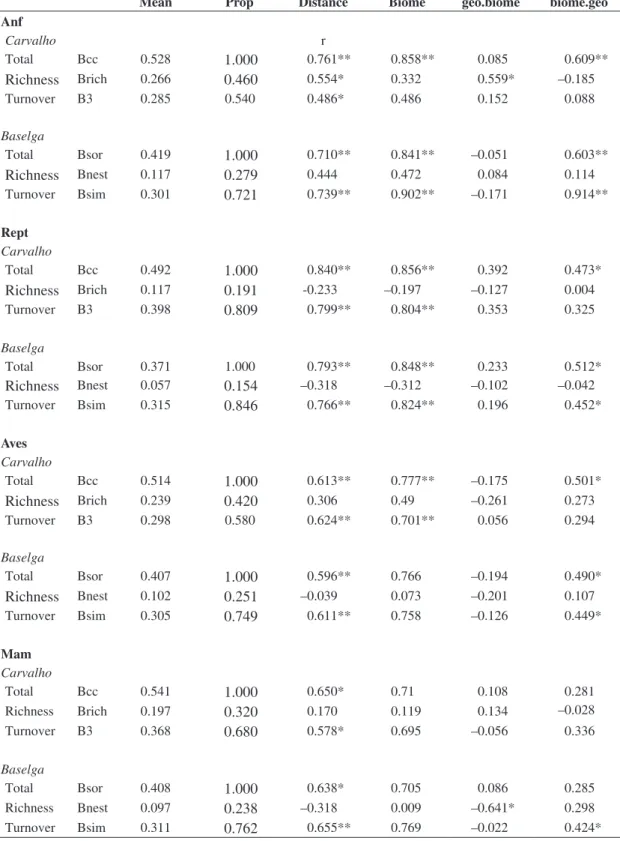
There is not a large difference in the overall β-diversity among the four groups of vertebrates, for both Baselga’s
(2010) and Carvalho et al. (2012) approaches (Table 1). βSOR
tends to be smaller than βcc , but their relative magnitude of difference among the groups are quite similar. For
Baselga’s (2010) methodology, higher β-diversity is found in mammals, whereas when using Carvalho’s et al.
(2012) methodology the higher β-diversity is observed for amphibians. Using both methodologies, reptiles are the group with smaller β-diversity. The proportion of turnover also did not show a strongly consistent pattern in both methodologies, except for much larger values for reptiles. For all groups, however, the turnover component
is higher for Baselga’s (2010) methodology, coherent with Carvalho’s et al. (2012) conclusion that βSIM tends to give
highest values for this component.
Spatial patterns in β-diversity components, analyzed by the Mantel test, show consistent patterns among groups
of organisms and components (Table 1). Focusing initially
on the overall β-diversity, it is possible to see that matrix correlations with geographical distances are higher for amphibians and reptiles (r > 0.7 for all cases, and going up
to r = 0.84 for reptiles) than for mammals and birds (r < 0.65 in all cases), for both methodologies used. Moreover, these
spatial patterns in overall β-diversity were consistently determined by its turnover component, and richness or
nestedness component only showed significant spatial
between richness/turnover components for all groups in the distinct methodologies.
However, the spatial component is also correlated with differences in the biomes in which each region is found (Mantel’s r = 0.861), so it is necessary to evaluate
the effect of biomes on β-diversity, as well as the partial effects of geographical distances and biome. It is possible to see that the effect of the biome is usually higher than the
geographical distances and they remain significant when
geographical distances are kept constant in partial Mantel
tests (Table 1). On the other hand, effects of geographical distance keeping biomes are usually not significant, although
the rank of patterns among groups described above are also maintained. Notice, however, that because the effect of the biome is evaluated using a discrete model matrix there is less power to detect effects due to a small number of regions within each biome class.
4. Discussion
Our analyses of faunal variation among the seven regions studied in Central Brazil reveal consistent patterns of β-diversity, and can be well interpreted both in the methodological and ecological sense, providing clear answers to all three questions formulated.
We observed some differences between Baselga’s
(2010) and Carvalho et al. (2012) methodologies for
partition of β-diversity into its richness and turnover components, although the overall patterns for all groups studied are consistent among organisms. As pointed out
by Carvalho et al. (2012), the turnover component of
the partition seems to be slightly larger when using βSIM, even after taking into account the differences between the two metrics for overall β-diversity (i.e., the Sorensen
dissimilarity used by Baselga’s (2010) is smaller than Jaccard used by Carvalho et al. (2012), even so the turnover proportion is higher in all cases). Thus, Carvalho’s et al. (2012) formulae for the partition avoids confounding the
idea of nestedness and differences in β-diversity due to
differences in richness (see Almeida-Neto, 2012), but
patterns in partial regressions are clearer using Baselga’s
(2010) original formulae.
The differences of β-diversity among groups are not
clearly defined in our analyses, and cannot be directly linked
to potential dispersal or life-history patterns. One could argue that the partition of species into such large groups such as mammals, birds, reptiles and amphibians are not accurate to represent even broad patterns of dispersal (i.e., especially because mammals and birds, for example, mix species with very large and very small body sizes and with
variable life histories, which directly affects dispersal). Although this is certainly true, Dobrovolski et al. (2012)
found clear differences among mammals, birds and reptiles in their proportion of turnover on a continental scale (i.e., with amphibians presenting the smaller amount of turnover,
as expected by its lower potential dispersal ability). The
more homogeneous results among groups found here, thus may be better viewed as a consequence of the relatively
small scale of the study and of the variations in sampling efforts among groups (i.e., Dobrovolsky’s et al., 2012 was based on the extent of occurrence data which is not
potentially disturbed by sampling effects).
On the other hand, much more interesting and consistent results were found when dealing with spatial patterns and effects of biome in β-diversity. Baselga (2010) pointed out and proposed that, on macroecological scales, one would
expect to find a higher proportion of nestedness components
at a higher latitude, mainly because they are more clearly affected by historical events of climate change, such as glaciations. This was supported by Dobrovolski et al.
(2012) analyses, which also showed that the magnitude of
this effect interacts with dispersal ability, as pointed out
before (see also Qian, 2009). This idea is also consistent
with the mechanisms usually associated with species richness latitudinal gradients, in which decreasing ability to persist in colder environments is usually linked with past adaptations and ancestral conditions (the niche conservatism; Wiens and Donoghue, 2004; Hawkins et al.,
2006; Rangel et al., 2007), geographically-structured patterns
in speciation/extinction balance (see Mittelbach et al.,
2007) or environmental tolerance (Rangel and Diniz-Filho 2005). Thus, in short, environmental components acting
throughout evolutionary time tend to reduce richness at a higher latitude, so differences among localities in different latitudes tend to be better explained by the “nestedness” component.
However, at finer spatial scales, a distinct pattern is
observed, especially in the tropics, because no strong environmental gradients are observed driving richness patterns at regional scales. Consequently, a relatively high turnover component is expected and, more importantly, spatial patterns will appear in the turnover of species more clearly than in the richness or nestedness component. For instance, a distance-decay of β-diversity is expected
under Hubbell’s (2001) neutral theory (see Cottenie, 2005;
Soininen et al., 2007; but see Diniz-Filho et al., 2012 for
a more complex evaluation) and also this spatial structure
should appear more clearly for groups with more restricted dispersal ability, exactly as found here. At the same time, different biogeographic regions, appearing due to both ecological and historical events, are also expected to generate more differences in turnover and species composition
than in richness (e.g., Vasconcelos et al., 2011). Indeed,
our analyses show both effects, although biome effects are much stronger than pure geographical distances and
remain significant even in partial Mantel tests. On smaller scales, although effects are not significant, they remain
comparatively structured among groups, suggesting that within biomes the β-diversity among the regions studied possess a strong stochastic component and are mainly determined by spatially-structured dispersal.Analyses in
more refined scales, using more local datasets, could be
Table 1. Results of mean pairwise relationship among the 7 sites, according to the methods by Carvalho et al. (2012) and Baselga (2010) for the four groups of terrestrial vertebrates, including mean dissimilarity and proportion in respect to overall
β-diversity and results of raw and partial Mantel tests, correlating each pairwise dissimilarity and geographic distances
(distance) and biome effect (biome), as well as partial correlations between dissimilarity and geographic distance keeping biome effect constant (geo.biome) and between dissimilarity and biome keeping geographic distances constant (biome.geo).
Mean Prop Distance Biome geo.biome biome.geo
Anf
Carvalho r
Total Bcc 0.528
1.000
0.761** 0.858** 0.085 0.609**Richness
Brich 0.2660.460
0.554* 0.332 0.559* –0.185Turnover B3 0.285 0.540 0.486* 0.486 0.152 0.088
Baselga
Total Bsor 0.419
1.000
0.710** 0.841** –0.051 0.603**Richness
Bnest 0.1170.279
0.444 0.472 0.084 0.114Turnover Bsim 0.301
0.721
0.739** 0.902** –0.171 0.914**Rept
Carvalho
Total Bcc 0.492
1.000
0.840** 0.856** 0.392 0.473*Richness
Brich 0.1170.191
-0.233 –0.197 –0.127 0.004Turnover B3 0.398
0.809
0.799** 0.804** 0.353 0.325Baselga
Total Bsor 0.371 1.000 0.793** 0.848** 0.233 0.512*
Richness
Bnest 0.0570.154
–0.318 –0.312 –0.102 –0.042Turnover Bsim 0.315
0.846
0.766** 0.824** 0.196 0.452*Aves
Carvalho
Total Bcc 0.514
1.000
0.613** 0.777** –0.175 0.501*Richness
Brich 0.2390.420
0.306 0.49 –0.261 0.273Turnover B3 0.298 0.580 0.624** 0.701** 0.056 0.294
Baselga
Total Bsor 0.407
1.000
0.596** 0.766 –0.194 0.490*Richness
Bnest 0.1020.251
–0.039 0.073 –0.201 0.107Turnover Bsim 0.305
0.749
0.611** 0.758 –0.126 0.449*Mam
Carvalho
Total Bcc 0.541
1.000
0.650* 0.71 0.108 0.281 Richness Brich 0.1970.320
0.170 0.119 0.134 –0.028 Turnover B3 0.3680.680
0.578* 0.695 –0.056 0.336Baselga
Total Bsor 0.408
1.000
0.638* 0.705 0.086 0.285 Richness Bnest 0.0970.238
–0.318 0.009 –0.641* 0.298 Turnover Bsim 0.3110.762
0.655** 0.769 –0.022 0.424*to standardize sampling efforts and make sites more comparable would be required.
In conclusion, our analysis reinforces that partition of β-diversity into components may be quite a useful analytical strategy to better understand the faunal differences among localities or regions, and for achieving this we
believe both Baselga (2010) and the methodological improvements made by Carvalho et al. (2012) are quite
useful. The analysis of faunal divergence among sites in Central Brazil show that, although no clear patterns of difference among β-diversity estimates are observed among groups of terrestrial vertebrates, the spatial patterns in the
turnover component are determined by a balance between broad scale biogeographical events associated with biome
structure and spatially-structured dispersal on a finer scale,
as expected under neutral dynamics.
Acknowledgements – We would like to thank three anonymous reviewers for suggestions that helped improve the text. We
would also like to thank Valéria Paula Palhares, Samuel
Bernardes, Ralder Rossi, Daniell Villar, Roberto Leandro da Silva, Marcos Paulo Fonseca, Liandro da Rosa, Kellen Borges, Fernanda Capuzo, Fernanda Anziliero, Fábia Martins, Liliam Pinheiro, Carlos Eduardo Cintra e Darlan Tavares, for data collection. Work by J. A. F. Diniz-Filho has been continuously supported by CNPq productivity fellowships.
References
ALMEIDA-NETO, M., FRENSEL, DMB. and ULRICH, W., 2012. Rethinking the relationship between nestedness and
beta-diversity: a comment on Baselga (2010). Global Ecology and Biogeography, vol.21, no. 7, p. 772-7. http://dx.doi.org/10.1111/ j.1466-8238.2011.00709.x
ALMEIDA-NETO, M., GUIMARÃES, P., GUIMARÃES-JUNIOR, PR., LOYOLA, RD. and ULRICH, W., 2008. A consistent metric for nestedness analysis in ecological systems: reconciling concept
and quantification. Oikos, vol.117, p. 1227-1239. http://dx.doi. org/10.1111/j.0030-1299.2008.16644.x
ANDERSON, MJ., CRIST, TO., CHASE, JM., VELLEND, M., INOUYE, BD., FREESTONE, AL., SANDERS, NJ., CORNELL, HV., COMITA, LS., DAVIES, KF., HARRISON, SP., KRAFT, NJB., STEGEN, JC. and SWENSON, NG., 2011. Navigating the multiple meanings of b diversity: a roadmap for the practicing ecologist. Ecology Letters, vol.14, p. 19-28. PMid:21070562. http://dx.doi.org/10.1111/j.1461-0248.2010.01552.x
ANDREW, ME., WULDER, MA., COOPS, NC. and BAILLARGEON, G., 2012. Beta-diversity gradients of
butterflies along productivity gradients. Global Ecology and Biogeography, vol.21, p. 352-364. http://dx.doi.org/10.1111/j.1466-8238.2011.00676.x
BASELGA, A., 2010. Partitioning the turnover and nestedness components of beta-diversity. Global Ecology and Biogeography, vol. 19, p. 134-143. http://dx.doi.org/10.1111/j.1466-8238.2009.00490.x
-, 2012. Separating the contribution of species replacement and species richness differences to beta diversity. Global Ecology and Biogeography, vol.21. In press.
CARVALHO, JC., CARDOSO, P. and GOMES, P., 2012. Determining the relative roles of species replacement and species richness differences in generating beta-diversity patterns. Global Ecology and Biogeography, vol.21, no. 7, p. 760-771. PMid:21352441. http://dx.doi.org/10.1111/j.1466-8238.2011.00694.x
COTTENIE, K., 2005. Integrating environmental and spatial processes in ecological community dynamics. Ecology Letters, vol. 8, p. 1175-1182. http://dx.doi.org/10.1111/j.1461-0248.2005.00820.x DINIZ-FILHO, JAF., SIQUEIRA, T., PADIAL, AA., RANGEL, TF., LANDEIRO, VL. and BINI, LM., 2012. Spatial autocorrelation analysis allows disentangling the balance between neutral and niche processes in metacommunities. Oikos, vol.121, no. 2, p. 201-210. http://dx.doi.org/10.1111/j.1600-0706.2011.19563.x DOBROVOLSKI, R., MELO, AS., CASSEMIRO, FAS. and DINIZ-FILHO, JAF., 2012. Climatic history and dispersal ability explain the relative importance of turnover and nestedness components of beta-diversity. Global Ecology and Biogeography, vol.21, no. 2, p. 191-7. PMid:17472910 PMCid:2169276. http:// dx.doi.org/10.1111/j.1466-8238.2011.00671.x
Eletronorte, 1985a. Plano de Enchimento do Reservatório: Fauna - Projetos Faunísticos em Tucuruí. Brasília. vol. 1. -, 1985b. Plano de Enchimento do Reservatório: Fauna - Análise da Operação Curupira. Brasília. vol. 2.
GASTON, KJ., DAVIES, RG., ORME, CDL., OLSON, VA., THOMAS, GH., DING, TS., RASMUSSEN, PC., LENNON, JJ., BENNETT, PM., OWENS, IPF. and BLACKBURN, TM., 2007. Spatialturnover in the global avifauna. Proceedings of the Royal
Society B: Biological Sciences, vol. 274, p. 1567-1574. http:// dx.doi.org/10.1098/rspb.2007.0236
HARRISON, S., ROSS, SJ. and LAWTON, JH., 1992. Beta diversity on geographic gradients in Britain. Journal of Animal Ecology, vol. 61, p. 151-158. http://dx.doi.org/10.2307/5518 HAWKINS, BA., DINIZ-FILHO, JAF., JARAMILLO, CA. and SOELLER, SA., 2006. Post-Eocene climate change, niche conservatism, and the latitudinal diversity gradient of New World birds. Journal of Biogeography, vol. 33, p. 770-780. PMid:21645193. http://dx.doi.org/10.1111/j.1365-2699.2006.01452.x
HORTAL, J., DINIZ-FILHO, JAF., BINI, LM., RODRÍGUEZ, MA., BASELGA, A., NOGUÉS-BRAVO, D., RANGEL, TF., HAWKINS, BA. and LOBO, JS., 2011. Ice age climate, evolutionary constraints and diversity patterns in European dung beetles. Ecology Letters, vol.14, p. 741-748. http://dx.doi.org/10.1111/j.1461-0248.2011.01634.x
KOLEFF, P., LENNON, JJ. and GASTON, KJ., 2003. Are there
latitudinal gradients in species turnover? Global Ecology and Biogeography, vol. 12, p. 483-498. http://dx.doi.org/10.1046/j.1466-822X.2003.00056.x
LEGENDRE, P. and LEGENDRE, L., 1998. Numerical Ecology. Amsterdan: Elsevier.
LENNON, JJ., KOLEFF, P., GREENWOOD, JJD. and GASTON, KJ., 2001. The geographical structure of British bird distributions: diversity, spatial turnover and scale. Journal of Animal Ecology, vol.70, p. 966-979. http://dx.doi.org/10.1046/j.0021-8790.2001.00563.x
MANLY, BFJ., 1985. Statistics of Natural Selection. London: Chapman & Hall.
MELO, AS., RANGEL, TFLV. and DINIZ-FILHO, JAF., 2009. Environmental drivers of beta-diversity patterns in New-Worldbirds and mammals. Ecography, vol. 32, p. 226-236. PMid:17355570. http://dx.doi.org/10.1111/j.1600-0587.2008.05502.x
MITTELBACH, GG., SCHEMSKE, DW., CORNELL, HV., ALLEN, AP., BROWN, JM., BUSH, M., HARRISON, SP., HURLBERT, AH., KNOWLTON, N., LESSIOS, HA., McCAIN, CM., McCUNE, AR., McDADE, LA., McPEEK, MA., NEAR, TJ., PRICE, TD., RICKLEFS, RE., ROY, K., SAX, DF., SCHLUTER, D., SOBEL, JM. and TURELLI, M., 2007. Evolution and the latitudinal diversity gradient: speciation, extinction and biogeography. Ecology Letters, vol. 10, p. 315-331. http://dx.doi. org/10.1111/j.1461-0248.2007.01020.x
PASSAMANI, M., 2004. Levantamento de pequenos mamíferos não-voadores da Região Central do Tocantins. Humanitas, vol. 4, p. 55-62.
PAVAN, D. and DIXO, M., 2004. A Herpetofauna da área de
influência do reservatório da Usina Hidrelétrica Luís Eduardo
Magalhães. Humanitas, vol.4, p. 13-30.
PINHEIRO, RT., 2004. Captura e recaptura de aves na Região Central do Tocantins. Humanitas, vol.4, p. 39-54.
PUORTO, G. and BARBARINI, CC., 2004. Coleção herpetológica do Museu de Zoologia do Centro Universitário Luterano de Palmas - MZCEULP. Humanitas, vol. 4, p. 31-38.
RANGEL, TFLVB. and DINIZ-FILHO, JAF., 2005. An evolutionary tolerance model explaining spatial patterns in species richness under environmental gradients and geometric constraints. Ecography, vol. 28, p. 253-263. http://dx.doi.org/10.1111/j.0906-7590.2005.04038.x
RANGEL, TFLVB., DINIZ-FILHO, JAF. and BINI, LM., 2006. Towards an integrated computational tool for spatial analysis in macroecology and biogeography. Global Ecology and Biogeography, vol. 15, p. 321-327. http://dx.doi.org/10.1111/ j.1466-822X.2006.00237.x
RANGEL, TFLVB., DINIZ-FILHO, JAF. and COLWELL, RK., 2007. Species richness and evolutionary niche dynamics: a spatial pattern-oriented simulation experiment. American Naturalist, vol. 274, p. 165-174.
-, 2010. SAM: a comprehensive application for spatial analysis in macroecology. Ecography, vol. 33, p. 46-50. http://dx.doi. org/10.1111/j.1600-0587.2009.06299.x
SILVA JUNIOR, NJ. and SITES, JW., 1995. Patterns of diversity of neotropical squamate reptile species with emphasis on the Brazilian Amazon and the conservation potential of indigenous reserves. Conservation Biology, vol. 9, p. 873-901. http://dx.doi. org/10.1046/j.1523-1739.1995.09040873.x
SOININEN, J., McDONALD, R. and HILLEBRAND, H., 2007. The distance decay of similarity in ecological communities. Ecography, vol.30, p. 3-12.
Systema Naturae Consultoria Ambiental Ltda., 1996. Inventariamento da Fauna Silvestre. Usina Hidrelétrica Serra da Mesa. Goiânia. Relatório Final.
-, 1999. Operação Lobo Guará - Resgate da Fauna. Usina
Hidrelétrica Serra da Mesa. Relatório Final. Goiânia, GO, Brasil.
-, 2008. Monitoramento de Animais Silvestres - Etapas Pré e Pós-enchimento do Reservatório. Usina Hidrelétrica Peixe Angical. Goiânia. Relatório Final.
-, 2010a. Programa da Fauna Silvestre - Monitoramento Faunístico Pós-enchimento - Fase IV - Ano VII. Usina Hidrelétrica Cana
Brava. Goiânia. Relatório Final.
-, 2010b. Programa de Monitoramento e Conservação da Fauna.
Usina Hidrelétrica São Salvador. Goiânia. Relatório Final.
-, 2011. Programa de Monitoramento da Fauna: Complementação do Levantamento Faunístico nas Áreas dos Ribeirões Mosquito,
João Aires, Curicaca, Córrego Jatobá e Rio Feio. Usina Hidrelétrica Estreito. Goiânia. Relatório Técnico Interpretativo 2.
TUOMISTO, H., 2010a. A diversity of beta diversities: straightening
up a concept gone awry. Part 1. Defining beta diversity as a function
of alpha and gamma diversity. Ecography, vol. 33, p. 2-22. http:// dx.doi.org/10.1111/j.1600-0587.2009.05880.x
-, 2010b. A diversity of beta diversities: straightening up a concept gone awry. Part 2. Quantifying beta diversity and related phenomena. Ecography, vol. 33, p. 23-45. http://dx.doi.org/10.1111/j.1600-0587.2009.06148.x
VASCONCELOS, TS., RODRIGUEZ, MA. and HAWKINS, BA., 2011. Biogeographic distribution patterns of South American amphibians: a regionalization based on cluster analysis. Natureza & Conservação, vol. 9, p. 67-72.
WHITTAKER, RH., 1972. Evolution and measurement of species diversity. Taxon, vol. 21, p. 213-251. http://dx.doi. org/10.2307/1218190