Patterns of orchid bee species diversity and
turnover among forested plateaus of central
Amazonia
Yasmine Antonini1,2*, Carolina de Barros Machado3, Pedro Manoel Galetti, Jr2,3, Marcio Oliveira4, Rodolfo Dirzo2, Geraldo Wilson Fernandes2,5
1Departamento de Biodiversidade Evoluc¸ão e Meio Ambiente—Universidade Federal de Ouro Preto–
Campus Morro do Cruzeiro, s/n, Ouro Preto, MG, Brazil,2Biology Department, Stanford University–Sierra Mall. Stanford, CA, United States of America,3Departamento de Gene´tica e Evoluc¸ão, Universidade
Federal de São Carlos, Via Washington Luis Km 235, São Carlos, SP, Brazil,4Instituto Nacional de Pesquisas da Amazoˆnia, Manaus, AM, Brazil,5Departamento de Biologia Geral, Universidade Federal de Minas Gerais–Av Antonio Carlos 6627 –Belo Horizonte, MG, Brazil
Abstract
The knowledge of spatial pattern and geographic beta-diversity is of great importance for bio-diversity conservation and interpreting ecological information. Tropical forests, especially the Amazon Rainforest, are well known for their high species richness and low similarity in spe-cies composition between sites, both at local and regional scales. We aimed to determine the effect and relative importance of area, isolation and climate on species richness and turnover in orchid bee assemblages among plateaus in central Brazilian Amazonia. Variance partition-ing techniques were applied to assess the relative effects of spatial and environmental vari-ables on bee species richness, phylogeny and composition. We hypothesized that greater abundance and richness of orchid bees would be found on larger plateaus, with a set of core species occurring on all of them. We also hypothesized that smaller plateaus would possess lower phylogenetic diversity. We found 55 bee species distributed along the nine sampling sites (plateaus) with 17 of them being singletons. There was a significant decrease in species richness with decreasing size of plateaus, and a significant decrease in the similarity in spe-cies composition with greater distance and climatic variation among sampling sites. Phyloge-netic diversity varied among the sampling sites but was directly related to species richness. Although not significantly related to plateau area, smaller or larger PDFaithwere observed in
the smallest and the largest plateaus, respectively.
Introduction
The knowledge of spatial pattern of beta-diversity is of great importance for practical biodiversity conservation and interpreting ecological information [1]. Studies of patterns of diversity in the Amazon–the largest and richest rainforest biome in the world–have traditionally focused on a restricted number of well-known taxa, such as plants and vertebrates [2–4]. To our knowledge, few studies have been conducted focusing on systematic inventory involving insects [5–8]. This
a1111111111 a1111111111 a1111111111 a1111111111 a1111111111 OPEN ACCESS
Citation:Antonini Y, Machado CdB, Galetti PM, Jr, Oliveira M, Dirzo R, Fernandes GW (2017) Patterns of orchid bee species diversity and turnover among forested plateaus of central Amazonia. PLoS ONE 12(4): e0175884.https://doi.org/10.1371/journal. pone.0175884
Editor:Fabio S. Nascimento, Universidade de Sao Paulo Faculdade de Filosofia Ciencias e Letras de Ribeirao Preto, BRAZIL
Received:January 17, 2017
Accepted:March 31, 2017
Published:April 14, 2017
Copyright:©2017 Antonini et al. This is an open access article distributed under the terms of the
Creative Commons Attribution License, which permits unrestricted use, distribution, and reproduction in any medium, provided the original author and source are credited.
Data Availability Statement:All relevant data are within the paper and its Supporting Information files.
Funding:The authors YA, GWF, PMGJ and MO received research scholarships from CNPq. The funder had no role in study design, data collection and analysis, decision to publish, or preparation of the manuscript.
is surprising given that insects comprise the largest portion of Amazonian biodiversity and the vast majority of its animal biomass [9].
Tropical forests, especially the Amazon Rainforest, are well known for their high species richness and low degree of similarity in species composition among sites, both on local and regional scales [10,1]; in other words, there are few common species among sites. Differences in species richness and composition among sites is attributed to beta diversity (or high species turnover among sites), as a result of heterogeneity in habitats and species dispersal limits [11,1,
12]. On a broad scale, contemporary spatial patterns of species richness are influenced by, among other factors, current climate [13–15], as well as historical events that influenced the geographical origins and distribution of clades [16–17].
Although central Amazonia is known to be primarily composed of lowland rain forests, the region of Saraca´-Taquera, in the State of Para´, is of particular interest due to its unique topog-raphy in the form of plateaus that reach 200 meters in elevation [18].
Unfortunately, these plateaus have been undergoing rapid and intense destruction due to bauxite mining, land development, and logging. Therefore, understanding the diversity of organ-isms living among the plateaus is critical for developing proper strategies for species conservation and management, as well as for understanding the resilience of the entire ecosystem. Otherwise, because the plateaus, hidden in the middle of the central Amazon, must have unique species com-position and structure, the outcome in terms of biodiversity and ecosystem services loss may have been very high and neglected up to now. Furthermore, the understanding of native bee fauna is of much interest as there is a general trend of pollinator decrease in many parts of the world.
Orchid bees are a promising group for understanding the patterns that drive beta diversity in the Amazon region. Orchid bees are known to be more diverse and abundant in forested areas closer to the Equator [19], where they are regarded as key pollinators [20–21].
Most orchid bee species are dependent on tropical rainforests, which guarantee a continu-ous supply of nectar and pollen as well as different odorifercontinu-ous substances used in courtship displays [21]. Also, being agile and far-flying organisms, orchid bees are able to travel many kilometers daily in search of food and fragrances [22], and thus favoring the colonization of new environments. In studies of Amazonian biodiversity, the taxonomy of Amazonian orchid bees is well established [23,24], aiding their identification to the species level. On the other hand, knowledge about trends in the diversity of orchid bees is limited due to a lack of studies in the Amazonian region e.g. [23–26;6–7;27].
Here we evaluate the influence and relative importance of spatial and environmental factors in explaining variation in species richness and composition of orchid bee assemblages of nine plateaus in the forest of central Amazonian in Brazil. We tested the hypothesis that greater abundance and richness of orchid bee species will be found on larger plateaus. We also pre-dicted that a set of specialists species would be present on all plateaus, and that smaller plateaus would present lower phylogenetic diversity of orchid bees following the lower species richness. Therefore, it is expected that the number of common species will be greater in large plateaus, while rare species would be absent from smaller plateaus.
Methods
Orchid bees were collected from nine plateaus scattered throughout the FLONA Saraca´-Taquera (under IBAMA permission 085/2006), with distances between sampling sites ranging from 8 to 30 km (Fig 1). The sampled plateaus were Aramã(AR), Aviso (AV), Bacaba (BB),
Bela Cruz (BC), Cipo´ (CP), Greig (GR), Monte Branco (MB), Saraca´ (SR) and Teo´filo (TF). Bee sampling took place in 2006, 2007, and 2008 during both the dry and wet seasons. On each plateau, three “sampling plots” were established at least 2,000 m from each other in undis-turbed forests (i.e. primary, non-successional forests), following Brasil [30].
To trap a high percentage of the orchid bee species occurring at a given site, bees were baited with specialized scent compounds comprised of one of the following substances known or believed to be attractive to orchid bees: 1,8-cineole, b-ionone, benzyl acetate, eugenol, methyl benzoate, trans-methyl cinnamate, methyl salicylate, and vanillin [31]. Baits, comprised of cotton pellets, were hung 1.5 m above the ground and 20 m from one another, and were soaked with their respective essence every two hours. All specimens collected were deposited in the entomological collection of the Museu Paraense Emilio Goeldi in Bele´m, and in the invertebrate collection of INPA in Manaus, both in Brazil.
Fig 1. Map of the study area showing the location of our nine sampling sites in the FLONA Saraca´-Taquera Brazilian Amazon.
Information about the spatial location of bees (distance between sites, in km), elevation, average annual temperature, average annual precipitation, and potential of evapotranspiration was collected for each of the nine study plateaus. These climatic variables were previously shown to be of importance in affecting the large-scale distribution of orchid bees [6]. We used data from WorldClim [32] to determine the average annual rainfall and data from LAPIG (home page here) to determine the average evapotranspiration rate at each site.
We used non-metric multidimensional scaling (NMDS), an indirect gradient analysis, to describe and interpret the major gradients in the orchid bee community data. We estimated the level of compositional similarity between pairs of sampling sites using the Simpson I´ndex because it provides a good measure of beta diversity by focusing on compositional differences between sites independent of species-richness gradients [33] and, consequently, of variation in sampling effort among sites. Ordinations and inferential statistical tests were performed using the Statistica program. Only species present in at least two forest sites were included in this analysis, as rare species may distort the analysis and impede a reliable description of the main patterns of variation [5].
The relationship between geographic distance and similarity in species composition, also known as the distance-decay in similarity relationship [10], was analyzed using simple linear regression. Distance-decay plots were built in order to analyze variation in compositional simi-larity among pairs of sampling sites in relation to the geographic and climatic distances between sites [10]. The geographic matrix was built using the Euclidean distance between sites based on their distance in kilometers using the ArcGIS program.
The Euclidean distance was also used to build the climatic matrix, which contained infor-mation considering the average annual temperature, average annual precipitation, and precipi-tation seasonality of each site (given by the potential of evapotranspiration).
Before calculating the Euclidean distance between sites each variable was standardized so that all variables included in the analyses had a mean of 0 and a standard deviation of 1.
The significance of these relationships was evaluated using the Mantel test [34]. Before cal-culating the phylogenetic diversity, we conducted Bayesian phylogenetic inference based on mitochondrial (cytochrome c oxidase I, COI) and nuclear (elongation factor 1-a (EF1-α), argi-nine kinase (Argk) and RNA polymerase 142 II (Poll-II)) genes extracted from GenBank (S1 Table) [7,35]. The dataset contained 39 taxa (4354 base pairs), which represent 73% of our col-lected species (or morphospecies).
Each of the four genes had separate model of nucleotide evolution estimated using the pro-gram jModeltest 2.1.4 [36] based on Bayesian information criterion (S2 Table).
The phylogenetic relationship reconstruction among orchid bees was conducted in MrBayes v3.2 [37]. Three heated chains and a single cold chain were used in the MCMC analysis and run was initiated with random tree. MCMC ran for 10 million generations sampled at every 1000 steps. The initial 1% of sampled topologies were discarded as burn-in. Proper mixing was veri-fied with Tracer v1.5 [38], and an effective sample size (ESS) of 200 or higher was required for all parameters.
To measure phylogenetic diversity, we used two metrics: Faith’s phylogenetic diversity (PDFaith) [39] and mean pairwise phylogenetic distance weighted by species abundance
(MPD) [40] in each study site. Both metrics were estimated using Picante (Phylocom integra-tion, community analyses, null-models, traits and evolution) [41] package for R (http://www. Rproject.org). The PDFaithhas been defined as the sum of the branch lengths of the
We also used linear regression to test for the existence of a positive relationship between phylogenetic diversity (PDFaithand MPD) vs. plateau size, and phylogenetic diversity (PDFaith
and MPD) vs. orchid bee species richness.
Results
The total sampling effort resulted in 486 h of sampling and the capture of 1,673 male orchid bees belonging to four genera and at least 55 species (S2 Table). Twenty-six species (or mor-phospecies) were rare, being found on only one or two of our study plateaus (Fig 2).
Total orchid bee richness in the plateaus (including singletons) varied from 15 to 24 species, while bee abundance varied from 108 to 424, considering all species in all plateaus (Fig 3A and 3BandS2 Table). Only two species,Eulaema merianaandEu.bombiformis, were present on all nine plateaus and so were considered widespread (Fig 2). Four other species were absent on only one plateau (Euglossa augaspis,E.chalybeata,E.imperialisandEu.mocsary). Altogether, these six species form the set of core species for the sampled plateaus (15%). On the other hand, 24 species were classified as rare (or singleton species) since they had scattered distribu-tions (e.g.,Euglossasp. n.,Eufriesea vidua), and were collected only on one (13 species) or two (11 species) plateaus. Two species,Euglossa ioprosopaandE.decorata, had somewhat disjunc-tive distributions, occurring on plateaus 30 km distant from each other.
The two dimensional NMDS (stress 0.14, proportion of variance 0.70) showed the existence of a geographical/environmental gradient in orchid bee species composition among the pla-teaus (Table 1andFig 4). Axis 1 depicts a longitudinal gradient in temperature, with the pla-teaus on the right side of the ordination plot 193 (BB) having low average temperature, high evapotranspiration and only one dry month, whereas axis 2 described a gradient in rainfall 195 seasonality. In particular, axis 2 discriminated plateaus AV and SR from the others (Fig 4), based on their high average temperature and 2–3 dry months with the consequent low average rainfall.
Fig 2. Number of Plateaus in which each of the 55 orchid-bee species found at FLONA Saraca´-Taquera, Brazil, were recorded.
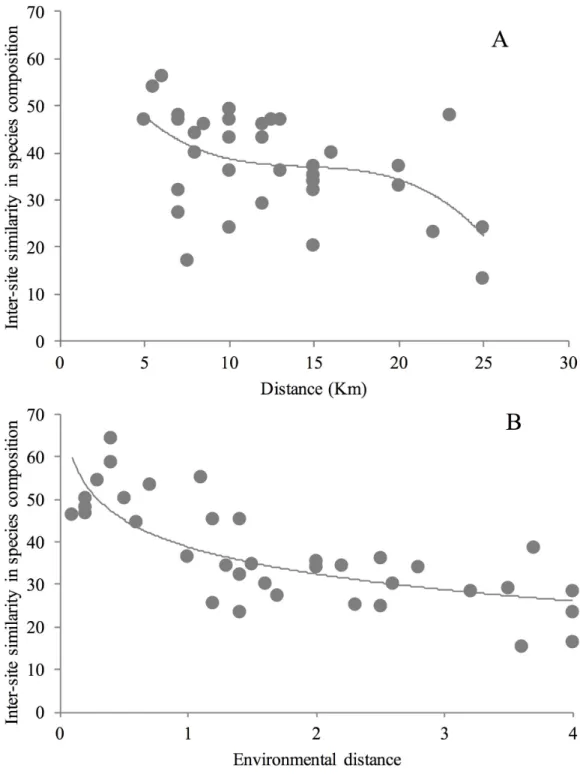
The level of pairwise similarity among the nine bee communities sampled was highly variable, ranging from 20.0 to 61.1% (Bray-Curtis Index, mean = 40.7%) when considering the total abun-dance of the 30 most frequent species. Similar results were obtained when considering the pres-ence or abspres-ence of all 55 recorded species (Jaccard index: mean = 40.3%, range = 17.0–70.3%). Similarity in orchid bee species composition among the different pairs of plateaus decayed both as function of climatic (R = -0.34, p = 0.03) (Fig 5A) and geographic distances among sites (R = -0.53, p<0.001;Fig 5B). The greatest dissimilarities in bee assemblage composition were observed
Fig 3. Orchid bee richness (A) and abundance (B) in each sampling site, FLONA Saraca´-Taquera, Brazil. Codes are names of the plateaus, as inFig 1.
among pairs of sites located 20–30 km from each other (Monte Branco and Bacaba) (seeFig 1). There was a positive and statistically significant relationship between the number of trees and orchid bee species richness (R2 = 0.48, p = 0.036).
Table 1. Pearson correlations between the environmental and geographic variables and the non-met-ric multidimensional scaling (NMDS) ordination scores (for a two-dimensional ordination of the nine sampling sites according to their similarity in orchid bee species composition).
Variables Axis 1 Axis 2
Average Temperature 0,55873** -0,53571**
Number of dry months -0,37966 0,49041*
Precipitation 0,13123 -0,57939**
*p<0.05 **p<0.01
https://doi.org/10.1371/journal.pone.0175884.t001
Fig 4. Non-metric multidimensional scaling (NMDS) ordination of the 9 sampling sites according to their similarity in Orchid bee species composition (Simpson index for presence or absence data).Site codes are in methods section and inFig 1. Size of the shapes represent the proportional size of the plateaus.
Fig 5. Decay in the similarity of orchid-bee assemblages in relation to the geographic A or B environmental distance between sampling sites. Geographic distance is the distance in km between paired sites. Environmental distance is the Euclidean distance between paired sites with respect to three climatic variables (average annual temperature, average annual precipitation, and precipitation seasonality). Similarity in orchid-bee species composition is based on the Bray–Curtis Index of similarity. Lines represent the logarithmic regression curve.
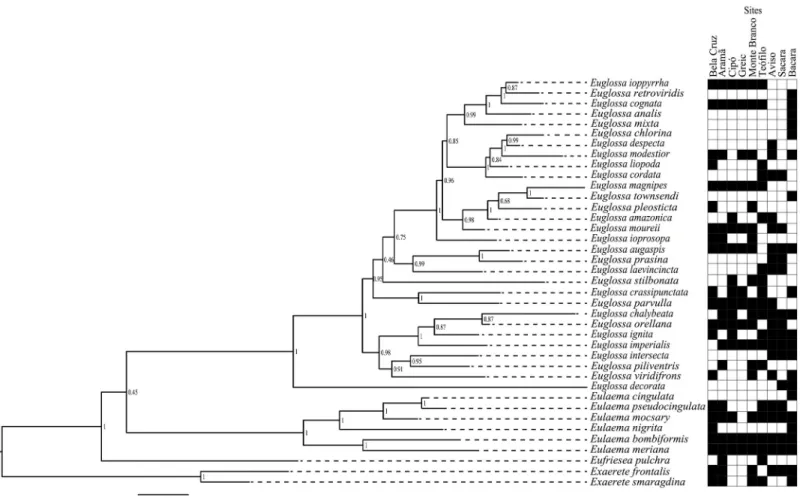
We estimated a Bayesian tree for orchid bees sampled in the present study from multigene dataset (Fig 6). Most of the relationships among species were highly supported and agreed with the phylogeny previously proposed for the group [35].
We examined how patterns of phylogenetic diversity varied across different plateaus. Phylo-genetic diversity (PDFaithand MPD) were lowest in the Greig plateau (0.288 and 0.064),
whereas Bacaba plateau hold the higher PDFaith(0.486) and Monte Branco plateau showed the
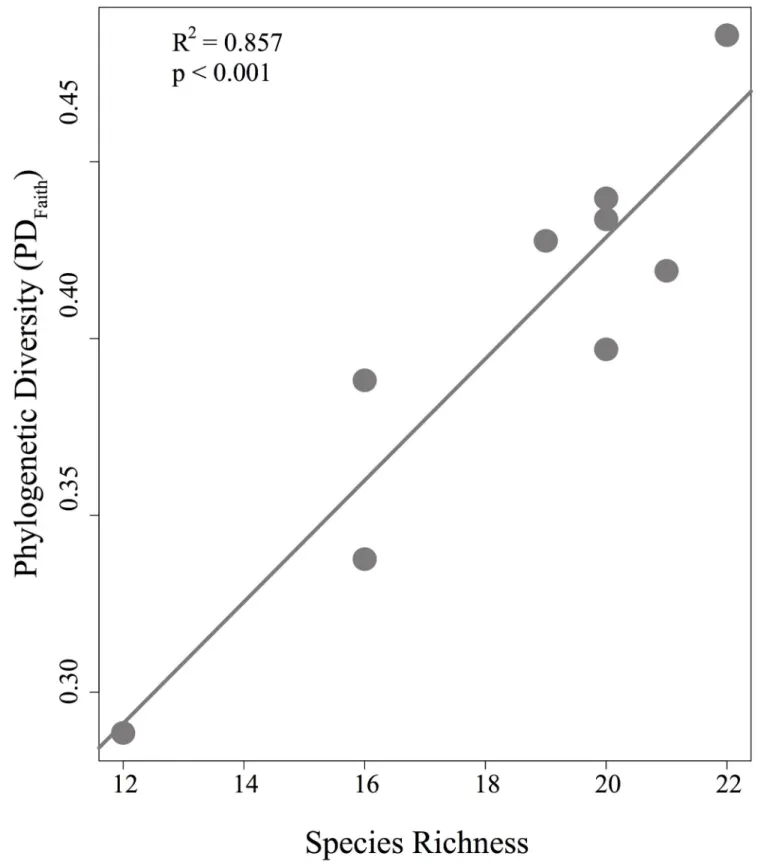
highest MPD value (0.082) (Table 2). PDFaithpatterns, but not MPD patterns, were highly
con-gruent with bee species richness (R2 = 0.857, p<0.001;Fig 7). The relationships between
phy-logenetic diversity (both metrics) and plateau size were not significant (S1 Fig).
Discussion
The species richness of orchid bees observed among the plateaus in the Amazonian Rainfor-est of Saraca´-Taquera, Brazil, 55 species, is rivaled only by that observed in Tarapoto, Peru (50 species) [27] and central Panama [42]. Furthermore, species richness of FLONA Saraca´-Taquera has no known parallel in the Amazon Basin, with orchid-bee samplings in the cen-tral and western Amazon of Brazil typically recording from 16 to 38 species [43–46;23–25]. Furthermore, the region of FLONA Saraca´-Taquera harbors many species that are rare and endemic to the Amazon Basin [47]; only the most abundant species were widely distributed on all plateaus.
Fig 6. Bayesian phylogenetic analysis based on mitochondrial (COI) and nuclear (EF1-α, Argk, and Poll-II) loci, and occurrence site (black square) for each orchid bee species.Node numbers indicates posterior probabilities.
This study reports the occurrence of a large number of singletons (25%) at FLONA Saraca´-Taquera, indicating that the communities of orchid bees are not characterized by species that are abundant and dominant for a given locality. In fact, most orchid bee species have relatively small distributions, and only 12 species are known to occur throughout southern Mexico to southeastern Brazil [21]. This is extremely important from a conservationist perspective Forest destruction could lead these species to extinction.
Our findings provide further support to the hypothesis that both climate and spatial factors can explain a substantial amount of the variation in beta-diversity (regional-scale species rich-ness) over large geographic areas see [14]. The geographic distribution of individual bee spe-cies may be determined by a number of factors such as climate, vegetation structure, and competition with similar species [48], as well as resource availability, such as nesting sites, resin, pollen, nectar and perhaps even microbial mutualists [49]. The plateau with the richest orchid bee community in this study also had the highest species richness of trees, which may provide the resources necessary to support orchid bee populations. Although orchid bees are known to play a key role in pollination of forest plants, detailed knowledge of their natural his-tory is still lacking; yet forest destruction by mining is advancing without proper scientific studies on natural history and sound governance by environmental agencies in the region.
In general, as we anticipated, similarity in bee assemblage composition was inversely pro-portional to the distance between plateaus, yet we did find some high similarity between some distantly separated pairs of plateaus. For instance, although the Aramãand Monte Branco
pla-teaus were separated by more than 30 km of valleys, they shared 88% of their species composi-tion (the most common species). This observacomposi-tion is reinforced by the low rate of distance decay in community similarity and by the relatively large number of singleton species. High similarity over long distances has also been reported for Amazonian herbivorous insect com-munities [50–51] and ant communities [5]. These authors claimed that high community simi-larity over long distances can be a result of incomplete sampling and the consequent omission of rare endemic species. However, as in other studies with highly diverse tropical insect assem-blages [51,5], presence or absence of rare insect species did not affect our results. Many Ama-zonian orchid bees appear to be habitat generalists e.g [21,25,27,45], which may help to explain why a relatively large number of the species we collected exhibited a broad distribution across the study area.
Table 2. Comparison of two phylogenetic diversity metrics (PDFaithand MPD) from multiloci phylog-eny of orchid bee.The values are given for each site.
Sites PD MPD
Bela Cruz 0.419 0.079
Aramã 0.428 0.076
Cipo´ 0.338 0.074
Greig 0.288 0.070
Monte Branco 0.434 0.082
Teo´filo 0.440 0.073
Aviso 0.397 0.071
Sacara´ 0.388 0.070
Bacaba 0.486 0.077
PDFaith: Faith’s phylogenetic diversity MPD: mean phylogenetic distance
Our results are in accordance with many other studies conducted in the Amazon Basin in showing that environmental gradients strongly affect the turnover of animal and plant species in tropical forests ants [5], orchid bees [6,52], plant species [53–54]. However, geographic dis-tance among plateaus explained almost twice as much of the observed differences in the orchid bee data set as did climatic information. On the other hand, the climatic information explained variation that was not spatially structured, indicating that within each study area, the species and the climatic data had similar spatial arrangements [55] or that climatic variation was too little to be responsible for explaining, the community distribution. In fact, part of the observed differences in community composition with increasing distance appears not to be explained by a concomitant gradient in precipitation.
The size of the forest plateaus adequately predicted the richness of orchid bees in the FLONA Saraca´-Taquera region, since larger plateaus had higher species richness. Although both PD and MPD were no significantly related to the plateau size (S1 Fig), lesser PDFaith and MPD were observed in the smaller and less diverse plateau (Greig–Table 2).
Concordantly, the larger plateau (Bacaba) showed the highest PDFaith, and it was expected because this metric is closest related to species richness (Fig 7). However, Monte Branco showed the highest MPD value, likely because MPD was weighted by abundance, and the abundant species in this community were very distantly related. However, because MPD counts each branch of the phylogenetic tree multiple times depending on the number of spe-cies in a community, there are some concerns on its use [56].
In general, these data provide support for the contention that forest plateaus in the Amazon region behave as islands and that they experience processes peculiar to them, at least when orchid bees are considered. Likewise, greater abundance and richness of orchid bee species in larger forest fragments were reported by 315 Storck-Tonon et al. [25] in the Amazon, [57] and in southern Costa Rica. Also, Neme´sio & Silveira [58] argued that orchid bee abundance tends to increase with fragment size in southeastern Brazil, although no correlation between species richness and fragment size was observed.
The crucial factors in determining diversity, composition, and temporal variability of polli-nator assemblages are climatic seasonality and spatial and temporal variation in food
resources. Although orchid bee species are specialized pollinators of orchids, their distribution and assemblages are also influenced by the structure and composition of trees in the habitat [21,59], which may explain the positive relationship between tree richness and orchid bee spe-cies richness. Most biological communities appear to be structured by both local ecological determinism and dispersal-driven assembly. According to Dick et al. [60], the absence of geo-graphical structure in Amazonian orchid bees may also derive from Quaternary population expansion. However, there is no convincing evidence for a major change in forest cover in the Amazon during the glacial periods of the Pleistocene [60–61], which might explain recent pop-ulation expansion in the Euglossine taxa. The occurrence of a high number of co-generic Euglossine species suggests that this region has experienced a history of active speciation as a result of the high heterogeneity of habitats available. Recent population expansion may result from this recent speciation, associated to high levels of gene flow, past or present, across the Neotropical lowlands, which may explain the greater diversity found in FLONA Saraca´-Taquera, as well as the higher species richness on each plateau. For example, evidence for extensive gene flow across the Amazon Basin would suggest a small role for regional endemic diversification, and therefore low levels of species turnover across broad spatial scales for some taxa.
Fig 7. Relationship between phylogenetic diversity (PD) and species richness.Dots represent each plateau.
richness of butterflies as well as of bees and wasps [21,35,62–63] are more pronounced than in hummingbirds, because insect pollinators can outlive phases of unfavorable environmental conditions in larval stages or by hibernating as adults [6]. For instance, a greater number of species of insect pollinators during the dry season was recorded when rain did not restrict their flight activities [35]. Besides, Euglossine bee’s species all include some that are highly sea-sonal, but others that breed continuously [35].
Although located inside a national forest, species survival is not guaranteed as this Forest was created with the goal to protect not just the natural resources but also the right of a com-pany to mine them [64]. Since species with wide regional distributions are less subject to extinction [65], we argue that the orchid bee fauna of the plateaus of FLONA Saraca´-Taquera is endangered because only few species were found to be widely distributed. As suggested by D.W. Roubik (pers. info.) the 50 across all sites, considering the low abundance of many, may mean that a lot of extinction is fairly recent, but not necessarily caused by humans. This con-cern is extremely worrisome given the interest in the extraction of the bauxite of the plateaus, which would decimate them, probably with irreversible impacts on biodiversity and ecosystem loss.
Supporting information
S1 Fig. Regression analyses relating phylogenetic diversity (PD (A), and MPD (B) to plateau size in hectare. Dots represent each plateau.
(TIF)
S1 Table. Collection sites, with abundance information, for orchid bee species in the study area and Genbank accession numbers.
(DOCX)
S2 Table. Models of nucleotide evolution for each gene were determined with jModeltest 2.1.4 using the Bayesian information criterion.
(DOC)
S3 Table. Richness and abundance of Euglossine bees in each of the nine plateaus.
(DOCX)
Acknowledgments
Renzo Lanza, Emmanuel Almada and Matheus Freitas for help in field work. Terravision in a person of Allan Brandt, for the files with the shapes of the plateaus. Felipe Carvalho for draw-ing the map. MRN for the logistic support. CNPq for the scholarship to YA, GWF, PMGJ and MO. DW Roubik for the valuable contributions to improve the quality of the paper. FAPEMIG for financial support to cover the publication fees.
Author Contributions
Conceptualization:YA GWF PMGJ.
Data curation:YA GWF PMGJ.
Formal analysis:YA CBM.
Funding acquisition:YA GWF RD.
Methodology:YA CBM PMGJ MO RD GWF.
Project administration:YA GWF.
Resources:YA GWF PMGJ RD.
Supervision:YA GWF MO.
Validation:YA CBM PMGJ MO RD GWF.
Visualization:YA CBM PMGJ MO RD GWF.
Writing – original draft:YA CBM PMGJ MO RD GWF.
Writing – review & editing:YA CBM PMGJ MO RD GWF.
References
1. Tuomisto H, Ruokolainen K, Yli-Halla M. Dispersal, environment, and floristic variation of Western Ama-zonian Forests. Science. 2003; 299: 241–244.https://doi.org/10.1126/science.1078037PMID: 12522248
2. Schulman L, Toivonen T, Ruokolainen K. Analysing botanical collecting effort in Amazonia and correct-ing for it in species range estimation. Biogeography. 2007; 34: 1388–1399.
3. Tuomisto H, Zuquim G, Ca´rdenas G. Species richness and diversity along edaphic and climatic gra-dientes in Amazonia. Ecography. 2014; 37:1034–1046.
4. Guedes dos Santos J, Malhado ACM, Ladle RJ, Correia RA, Costa MH. Geographic trends and infor-mation deficits in Amazonian conservation research. Bio Conserv. 2015; 24: 11: 2853–2863.
5. Vasconcelos HL, Vilhena JMS, Facure KG, Albernaz ALKM. Patterns of ant species diversity and turn-over across 2000 km of Amazonian floodplain forest J Biogeo. 2010; 37: 432–440.
6. Abrahamczyk S, Kluge J, Gareca Y, Reichle S, Kessler M. The Influence of Climatic Seasonality on the Diversity of Different Tropical Pollinator Groups Plos One. 2011; 6: 11. e27115.https://doi.org/10. 1371/journal.pone.0027115PMID:22073268
7. Abrahamczyk S, de Vos JM, Sedivy C, Gottleuber P, Kessler M. A humped latitudinal phylogenetic diversity pattern of orchid bees (Hymenoptera: Apidae: Euglossini) in Western Amazonia: assessing the influence of climate and geologic history. Ecography 2014; 37: 500–508.
8. Almada E, Fernandes G.W. Gall-inducing insects in terra firme forest and reforested areas in eastern Amazon, Para´, Brazil. Bol. Mus. Para. Emilio Goeldi Cienc. Nat. 2011; 6: 2
9. Fittkau EJ, Klinge H. On biomass and trophic structure of the Central Amazonian rain forest ecosystem. Biotropica. 1973; 5: 2–14.
10. Nekola JC, White PS. The distance decay in similarity in biogeography and ecology. J Biog. 1999; 26: 867–878.
11. Ter Steege H, Pitman N, Sabatier D, Castellanos H, Hout PVD, Daly DC et al. A spatial model of tree diversity and tree density for the Amazon. Biod Conser. 2003; 12: 2255–2277.
12. Costa FRC, Magnusson WE, Luizão RC. Mesoscale distribution patterns of Amazonian understorey
herbs in relation to topography, soil and watersheds. J Ecol. 2005.
13. Wright DH. et al. Energy supply and patterns of species richness on local and regional scales.–In: Rick-lefs RE, Schluter D editors. Species diversity in ecological communities: historical and geographical per-spectives. Univ. of Chicago Press; 1993. pp. 66–74.
14. Hawkins BA et al. Energy, water, and broad-scale geographic patterns of species richness. Ecology. 2003; 84: 3105–3117.
15. Gentry AH. Changes in plant community diversity and floristic composition on environmental and geo-graphical gradients. Ann Mo Bot Gard. 1988; 75:1–34
16. Wiens JJ, Donoghue MJ. Historical biogeography, ecology and species richness. Trends Ecol Evol. 2004; 19: 639–644.https://doi.org/10.1016/j.tree.2004.09.011PMID:16701326
17. Jablonski D et al. Out of the tropics: evolutionary dynamics of the latitudinal diversity gradient. Science. 2006; 314:102–106.https://doi.org/10.1126/science.1130880PMID:17023653
18. Salomão RP, Rosa NA, Morais KAC. Dinaˆmica da regenerac¸ão natural de a´rvores em a´reas mineradas na Amazoˆnia. Boletim do Museu Paraense Emı´lio Goeldi. Ciên Nat. 2007; 2: 85–139.
20. Roubik DW. Ups and downs in pollinator populations: When is there a decline? Conserv Ecol. 2015; 1:2 Available fromwww.Consecol.org/vol5/iss1/art2/.
21. Roubik DW, Hanson PE. Orchids bees of Tropical America: Biology and Field Guide. Costa Rica. INBio Press. Heredia, 2004. 370p.
22. Janzen DH. Euglossine bees as long distance pollinators of tropical plants. Science. 1971; 171: 203– 205.https://doi.org/10.1126/science.171.3967.203PMID:17751330
23. Neme´sio A. & Morato E.F.Euglossini (Hymenoptera: Apidae) of the Humaita´ Reserve, Acre state, Bra-zilian Amazon, with comments on bait trap efficiency. Rev Tecnol Amb. 2004; 10:71–80.
24. Neme´sio A, Morato EF. The orchid-bee fauna (Hymenoptera: Apidae) od Acre state (Northwestern Bra-zil) and a re-evaluation of euglossine bait-trapping. Lundiana. 2006; 7:59–64.
25. Storck-Tonon D, Morato EF, Flores de Melo AW, Oliveira ML. Orchid Bees of forest fragments in South-western Amazonia. Biota Neotrop. 2013; 13: 133–141.
26. Rasmussen C. Diversity and abundance of orchid bees (Hymenoptera: Apidae, Euglossini) in a tropical rainforest succession. Neotrop Entomol. 2009; 38: 812–819. PMID:19347098
27. Nemesio A, Rasmussen C. Sampling a biodiversity hotspot: the orchid-bee fauna (Hymenoptera: Api-dae) of Tarapoto, Northeastern Peru, the richest and most diverse site of the Neotropics. Braz J Biol. 2014; 74: 33–44.
28. Veloso HP, Rangel Filho AL, Lima JCA. Classificac¸ão da vegetac¸ão brasileira adaptada a um sistema
universal. Rio de Janeiro. IBGE. 1991; 124p.
29. Alvares CA, Stape JL, Sentelhas PC, Gonc¸alves JLM, Sparovek G. Koppen’s climate classification map for Brazil. Meteorol. Zeitschrift. 2014; 22:711–728.
30. Brasil. Manejo de fauna em florestas com atividades de minerac¸ão: proposta metodologia para diag-nostico, monitoramento e salvamento. Ministe´rio do Meio Ambiente, IBAMA, 2006; 44pp.
31. Bezerra CP, Martins CF. Diversidade de Euglossinae (Hymenoptera: Apidae) em dois fragmentos de Mata Atlantica localizados na regiao urbana de Joao Pessoa, Paraiba, Brasil. Rev Bras Zool. 2001; 18:823–835.
32. Hijmans RJ, Cameron SE, Parra JL, Jones PG, Jarvis A. Very high resolution interpolated climate sur-faces for global land areas. Int J Climatol. 2005; 25: 1965–1978.
33. Koleff P, Gaston KJ, Lennon JJ 2003. Measuring beta diversity for presence–absence data. J Animal Ecol. 2003; 72: 367–382.
34. Peck JE. Multivariate analysis for community ecologists: step by step using PC-ORD. MJM Software Desing. Gleneden Beach Oregon. USA 2010. Available from:www.pcord.com.
35. Ramirez SR, Roubik DW, Skov C, Pierce NE. Phylogeny, diversification patterns and historical biogeog-raphy of euglossine orchid bees (Hymenoptera: Apidae).BiologicalJ Linn Soc. 2010; 100: 552–572.
36. Posada D. jModelTest: Phylogenetic model averaging. Mol Biol Evol. 2008; 25: 1253–1256.https://doi. org/10.1093/molbev/msn083PMID:18397919
37. Ronquist F, Teslenko M, van der Mark P, Ayres DL, Darling A, Ho¨hna S. et al. MrBayes 3.2: efficient Bayesian phylogenetic inference and model choice across a large model space. Sys Biol. 2012; 61: 539–542.
38. Rambaut A, Drummond AJ. Tracer v1.4. 2007; Available fromhttp://beast.bio.ed.ac.uk/Tracer (accessed 19 December 2016).
39. Faith D. Conservation evaluation and phylogenetic diversity. 1992;
40. Webb CO. Exploring the phylogenetic structure of ecological communities: an example for rain forest trees. Am. Nat. 2000; 156(1):145–155.
41. Kembel SW, Cowan PD, Helmus MR, Cornwell WK, Morlon H, Ackerly DD. et al. Picante: R tools for integrating phylogenies and ecology. Bioinformatics 2010; 26: 1463–1464.https://doi.org/10.1093/ bioinformatics/btq166PMID:20395285
42. Ackerman JD. Specificity and mutual dependency of the orchid-euglossine bee interaction. Biol J Linn Soc. 1983; 20: 301–314.
43. Powell AH, Powell VN. Population dynamics of male euglossine bees in Amazonian forest fragments. Biotropica. 1987; 19: 176–179.
44. Becker P, Moure JS, Peralta FJA. More about euglossine bees in Amazonian forest fragments. Biotro-pica. 1991; 23:586–591
46. Oliveira ML, Campos LAO. Preferências por estratos florestais e por substancias odorı´feras em
abel-has Euglossinae (Hymenoptera, Apidae). Rev Bras Zool. 1996; 13:1075–1085
47. Neme´sio A. The community structure of male orchid bees along the Neotropical Region. Rev Bras Zool. 2007; 9: 151–158.
48. Rosenzweig ML. Species Diversity in Space and Time. Cambridge University Press, 1995 Cambridge.
49. Wcislo WT, Cane JH. Floral resource utilization by solitary bees (Hymenoptera: Apoidea) and exploita-tion of their stored foods by natural enemies. Annu Rev Entomol. 41: 257–286https://doi.org/10.1146/ annurev.en.41.010196.001353PMID:15012330
50. Novotny V, Miller SE, Hulcr J, Drew RAI, Basset Y, Janda M et al Low beta diversity of herbivorous insects in tropical forests Nature. 2007; 448:
51. Hulcr J, Novotny V, Maurer BA, Cognato AI. Low beta diversity of ambrosia beetles (Coleoptera: Curcu-lionidae: Scolytinae and Platypodinae) in lowland rainforests of Papua New Guinea.
52. Neme´sio A, Vasconcelos HL. Beta diversity of orchid bees in a tropical biodiversity hotspot. Biodiv Con-serv. 2013; 22: 1647–1661.
53. Myster RW. Plant communities of Western Amazonia. Bot Rev. 2009; 75:271–291
54. Matos DCL, Ferreira LV, Salomão RP. Influence of geographical distance in richness and composition of tree species in a tropical rain forest in Eastern Amazonia. Rodrigue´sia. 2013; 64: 357–367.
55. Borcard D, Legendre P, Drapeau P. Partialling out the spatial component of ecological variation. Ecol-ogy. 1992; 73, 1045–1055.
56. Venail P, Gross K, Oakley TH, Narwani A, Allan E, Flombaum P. et al. Species richness, but not phylo-genetic diversity, influences community biomass production and temporal stability in a re-examination of 16 grassland biodiversity studies. Func Ecol. 2015; 29: 615–626.
57. Brosi BJ. The effects of forest fragmentation on euglossine bee communities (Hymenoptera: Apidae: Euglossini). Biol Conserv. 2011; 142:414–423.
58. Neme´sio A, Silveira FA. Diversity and distribution of orchid bees (Hymenoptera: Apidae: Euglossina) with a revised checklist of their species. Neotrop Entomol. 2007; 36:
59. Antonini Y, Silveira RA, Oliveira ML, Martins C, Oliveira R. Orchid bee fauna responds to habitat com-plexity on a savanna area (Cerrado) in Brazil. Sociobiology. 2016; 63: 819–825
60. Dick CW, Roubik DW, Gruber KF, Bermingham E (2004) Long-distance gene flow and cross-Andean dispersal of lowland rainforest bees (Apidae: Euglossini) revealed by comparative mitochondrial DNA phylogeography. Molecular Ecology 13: 3775–3785.https://doi.org/10.1111/j.1365-294X.2004.02374. xPMID:15548290
61. Moritz C., Patton J. L., Schneider C. J. and Smith T. B. Diversification of Rainforest Faunas: An Inte-grated Molecular Approach. Ann Rev Ecol Sys. 2000; 31: 533–563.
62. DeFries PJ, Murray D, Lande R. Species diversity in vertical, horizontal, and temporal dimensions of a fruit-feeding butterfly community in an Ecuadorian rainforest. Biol J Lin Soc. 1997; 62: 343–364.
63. Diniz IR, Kitayama K. Seasonality of vespid species (Hymenoptera: Vespidae) in a Central Brazilian cerrado. Rev Biol Trop. 1998; 46: 109–114.
64. Instituto Brasileiro de Meio Ambiente e Recursos Naturais Renova´veis. Estudo de Impacto Ambiental dos seis platoˆs. 2016. Available from:http://licenciamento.ibama.gov.br/