In
fl
uence of Treg cells and HBV genotype on
sustained response and drug resistance in the
treatment with nucleoside drugs
Y.R. Zhang
1, B. Li
2, C.X. Wang
3, N. Zhou
1, W. Qi
1, X.L. Li
1, L.Y. Wu
1, S.F. Wei
1and Y.D. Zhang
1 1Department of Infectious Diseases, The First People’s Hospital of Lanzhou, Gansu, China 2
Department of Thoracic Surgery, Gansu Province Tumor Hospital, Gansu, China 3
Department of Geriatrics, The First People’s Hospital of Lanzhou, Gansu, China
Abstract
We aimed to investigate the influence of regulatory T cells including CD4+CD25+, CD8+CD28–and hepatitis B virus (HBV)
genotype on sustained virological response and tolerance of nucleoside drugs. One hundred and thirty-seven patients were enrolled. Lamivudine was administered to 84 patients. Entecavir was administered to the other 53 patients. Before treatment, biochemical tests, HBV DNA load, HBV serum level, HBV genotype, PB CD3+, CD4+, CD8+, CD4+CD25+/CD3+, and
CD8+CD28–/CD3+frequencies were measured. Based on HBV DNA loads after 4 weeks of therapy, patients were divided into
response group and suboptimal response group. The lamivudine group received treatment continuously, and then patients were categorized into non-resistance group and resistance group. Compared with the suboptimal response and resistance groups for lamivudine, CD4+CD25+/CD3+levels were higher in the response and non-resistance groups (t=4.372, P=0.046; t=7.262,
P=0.017). In the non-resistance group, CD8+CD28–/CD3+ frequency was lower than in the resistance group (t=5.527,
P=0.037). Virus load and hepatitis B E antigen (HBeAg)-positive rate were significantly lower than in the response and resistance group (t=2.164, P=0.038;X2=4.239, P=0.040; t=2.015, P=0.044;X2=16.2, P=0.000). Incidence of drug resistance was high in patients with virogene type C. For the virological response to entecavir, CD8+CD28–/CD3+level was significantly
lower than that of the suboptimal response group (t=6.283, P=0.036). Response and suboptimal response groups were compared in CD3+, CD4+, CD8+, CD4+CD25+/CD3+and virus genotype, and differences were not statistically signi
ficant (P40.05). Baseline regulatory T cells including CD4+CD25+/CD3+and CD8+CD28–/CD3+frequencies have a relationship
with the incidence of rapid virological response and the resistance to nucleoside drugs. Patients with HBV genotype C receiving lamivudine more often underwent drug resistance. Antiviral efficacy and the resistance to lamivudine were closely correlated with baseline factors; the same cannot be found for entecavir.
Key words: Hepatitis B chronic; CD4+CD25+; CD8+CD28–; Regulatory T cells; Viral response; Nucleoside
Introduction
It is known that antiviral efficacy and drug resistance are related to chronic hepatitis B virus (HBV). The host’s immune state, the selection of nucleoside drugs and the virus’genotype could be major factors in antiviral efficacy and drug resistance in patients (1,2). Recent studies have indicated that regulatory T cells (Tregs) inhibited effector T cells in the HBV infection process, and consequently the virus was not completely eliminated (3). CD4+CD25+and CD8+CD28–are Treg subgroups that have mostly been studied recently. Stoop et al. (4) found that PB CD4+ CD25+Treg proportion in patients with chronic HBV was obviously increased compared to healthy control patients and healed patients, and the proportion of patients with positive hepatitis B E antigen (HBeAg) was higher than
patients with negative HBeAg. Franzese et al. (5) evaluated Tregs levels among patients that carried asymptomatic viruses, patients at the chronic infection stage, patients with previous infections, and healthy controls, and found no significant difference. This was independent of HBeAg status, HBV load and different antiviral therapies. How-ever, Zhang et al. (6) reported that the proportion of PB CD4+CD25+ was significantly reduced after HBV DNA was inhibited by entecavir, and the immune function of patients was recovered. In addition, other studies found that the high expression of CD8+CD28–was a marker for decreased T cell function, which may go against the clearance of HBV (7,8). However, there are no studies that determined whether or not CD4+CD25+and CD8+CD28–
Correspondence: Y.R. Zhang:<[email protected]>
levels have an influence on antiviral efficacy and drug resistance to nucleoside drugs.
The HBV genotype is divided into nine types from A to I. In general, patients with HBV infection have mostly types A and B, while Chinese patients with HBV infection have mostly types B and C (9). Studies have reported that the virological response to lamivudine therapy was more likely to occur in patients with genotype B than in patients with genotype C, which present with more severe condi-tions and poor drug efficacy (10). To date, no studies exist with respect to the relationship between virus genotypes and early virological responses to nucleoside drug treat-ment (lamivudine and entecavir).
Therefore, this study aimed to investigate the influence of Treg cells at baseline and virus genotype on early virological response and drug resistance to nucleoside drugs.
Patients and Methods
Patients
This study included a total of 137 inpatients and out-patients with chronic HBV infection from May 2010 to April 2014. Among these patients, 95 were males and 42 were females with age ranging between 24–70 years (mean age: 46.8 years). The Guidelines for the Prevention and Treatment of Chronic HBV Infection, established by the Chinese Society of Hepatology and the Society of Infec-tious Diseases, was used as the diagnostic criteria (11). Based on these guidelines, study participants were clas-sified as 88 patients with chronic HBV, 49 patients with cirrhosis, 54 positive patients, and 83 HBeAg-negative patients (demographic data are reported in Table 1). Inclusion criteria were as follows: 1) patients with positive HBsAg for more than 6 months, and HBV DNAX104cps/mL in two examinations (reference value:o1103cps/mL);
2) patients with alanine aminotrasferase (ALT) levelsX1.5 ULN; 3) patients treatment-naive for lamivudine and entecavir.
Exclusion criteria were as follows: patients with hepatitis C, hepatitis D, HIV infection, primary liver cancer and hepatic failure.
Methods
Among the 137 patients with chronic HBV infection, 84 were administered 100 mg/day of lamivudine po (GlaxoSmithKline Medical, China), and 53 patients were administered 0.5 mg/day of entecavir (Chiatai Tianqing Pharmaceutical, China)pofor treatment, according to the time sequence of hospitalization. Biochemical tests, HBV DNA burden, HBV serum level, HBV genotype, CD3+, CD4+, CD8+, CD4+CD25+/CD3+and CD8+CD28–/CD3+ percentages were measured before treatment; biochem-ical tests and HBV DNA load were rechecked at the 4th, 12th and 24th week of treatment. During lamivudine therapy, if HBV DNA load rebounded, drug resistance was determined. Biochemical examination was performed using an automatic biochemical analyzer in The First People’s Hospital of Lanzhou City, and the reagent for HBV DNA load was provided by Hunan Sansure Biotech Reagent Co., Ltd., China, with a lower limit of 500 IU/mL. HBV genotype and the test for drug resistance to lami-vudine were performed using real-time PCR, and assisted by Xi’an KingMed Diagnostics, China. CD3+, CD4+, CD8+, CD4+CD25+/CD3+and CD8+CD28–/CD3+were detected using flow cytometry, and assisted by Xi’an KingMed Diagnostics.
Flow cytometry detection method was as follows: Elbow venous blood was collected early in the morning on an empty stomach, and was kept in sodium citrate antico-agulation tubes. Empty tubes were coded, and 20 mL of CD25-PE, CD28-PC7, CD8-FITC, CD4-PC5 and CD3-ECD monoclonal antibodies were added. Then, 100mL of whole blood with anticoagulant was added and gently mixed. Afterwards, the tubes were placed at room tem-perature for 15 min, and BD general hemolysin was added and left for 10 min until complete specimen hemolysis. Then, the solution was centrifuged at 500 gfor 5 min at 18-22°C. The supernatant was removed, calf serum wash-ing liquid was added for rinswash-ing, and centrifuged at 500gfor 5 min at 18-22°C. The supernatant was removed andfixed liquid was added to re-suspend cells for detection using a computer. A flow cytometry instrument (Beckman Coulter, model: FC500 MCL, USA) was used for detection, the reagent was provided by Beckman Coulter, and the CXP analysis software (USA) was used for data analysis.
Grouping criteria
Patients were divided into two groups: the response group and the suboptimal response group, based on whether or not HBV DNA load was detected at the end of the 4th week of lamivudine or entecavir treatment. The Table 1.Demographic data of patients.
n (%) Lamivudine group
Entecavir group
Patients (n) 137 84 53
Male 95 (69.3) 56 39
Female 42 (30.7) 28 14
Age (mean) 46.8 46.1 47.7
Hepatitis B 88 (64.2) 57 31
Cirrhosis 49 (35.8) 27 22
HBeAg positive 54 (39.4) 26 28
HBeAg negative 83 (60.6) 58 25
HBV Genotype
C 95 (69.3) 60 35
B 30 (21.9) 16 14
D 6 (4.4) 5 1
comparison was performed between groups in terms of CD3+, CD4+, CD8+, CD4+CD25+/CD3+ and CD8+ CD28–/CD3+levels at baseline and the constituent ratio of the virus genotype. Patients in the lamivudine treatment group received treatment continuously for 96 weeks. Patients of this group were categorized into two groups, the resistance group and the non-resistance group, based on whether the patient was resistant to the drug during treatment or not. The resistance group was compared to the non-resistance group in terms of CD3+, CD4+, CD8+, CD4+CD25+/CD3+ and CD8+CD28–/CD3+ levels, as well as the constituent ratio of virus genotype.
Statistical analysis
SPSS 19.0 (IBM, USA) software package was used for data processing. Data are reported as means±SD. The comparison of means between groups was per-formed using the Student’s t-test, and the comparison of the constituent ratio was carried out using the X2 test. Po0.05 was considered to be statistically
sig-nificant.
Results
Correlation between CD3+, CD4+, CD8+, CD4+CD25+, CD8+CD28–levels and virological response to lamivudine therapy at the 4th week
Table 2 shows that, in the response group, the CD4+ CD25+ level was higher than the suboptimal response group, and the difference was statistically significant (t=4.372, P=0.046). However, the CD8+CD28–level was
lower than in the suboptimal response group, and the difference was not significant (t=2.290, P=0.151). The differences between groups for CD3+, CD4+and CD8+ levels were not significant (P40.05).
Correlation between CD3+, CD4+, CD8+, CD4+CD25+, CD8+CD28–levels and the incidence of drug resistance to lamivudine therapy at the 96th week
Table 3 shows that the levels of CD4+CD25+ and CD8+CD28–were significantly different (t=7.262, P=0.017; t=5.527, P=0.037, respectively). The levels of CD3+, CD4+ and CD8+were not significantly different (P
40.05).
Correlation between HBV genotype and virological response to lamivudine at the 4th week of treatment
As reported in Table 4, the proportions of HBV geno-type C in the response and suboptimal response groups were 69.2 and 72.4%, respectively; the proportions of HBV genotype B in both groups were 19.2 and 20.0%, respectively; and the proportions of HBV genotype D in both groups were 7.7 and 5.2%, respectively. The con-stituent ratios of virus genotypes in both groups were compared, and the difference was not significant (X2=0.226, P=0.973). HBV DNA burden (to obtain the Lg value) in the response group was lower than that in the subopti-mal response group, and the difference was significant (t=2.164, P=0.038). HBeAg-positive rate in the response group was reduced compared with the suboptimal response group, and the difference was significant (X2=4.239, P=0.040). The difference of ALT level in both groups was not significant.
Table 2.Correlation between CD3+, CD4+, CD8+, CD4+CD25+, CD8+CD28–levels and virological response to lamivudine treatment at the 4th week.
CD3+ CD4+ CD8+ CD4+CD25+/CD3+ CD8+CD28–/CD3+
Response group (n=26) 78.5±13.6 38.9±14.4 36.7±5.1 1.85±0.91 16.3±6.9
Suboptimal response group (n=58) 75.1±12.6 35.6±16.7 32.7±8.4 1.27±0.43 18.2±11.6
tvalue 0.736 0.311 1.046 4.372 2.290
P value 0.429 0.771 0.152 0.046 0.151
Data are reported as means±SD (Student’st-test).
Table 3.Correlation between CD3+, CD4+, CD8+, CD4+CD25+and CD8+CD28–levels and the incidence of drug resistance to lamivudine treatment at the 96th week.
CD3+ CD4+ CD8+ CD4+CD25+/CD3+ CD8+CD28–/CD3+
Non-resistance group (n=40) 77.9±12.3 37.9±13.4 36.7±5.1 1.98±1.11 16.17±6.39
Resistance group (n=44) 75.4±11.6 36.6±15.2 34.3±6.7 1.31±0.50 20.37±10.35
tvalue 1.236 0.475 1.796 7.262 5.527
P value 0.125 0.198 0.246 0.017 0.037
Correlation between HBV genotype and the incidence of drug resistance at the 96th week of lamivudine treatment
As reported in Table 5, the proportions of HBV geno-type C in non-resistance and resistance groups were 60 and 79.5%, respectively; 30 and 2.3% for genotype B, respectively; and 7.5 and 2.3% for genotype D, respectively. The constituent ratios of virus genotypes in both groups were compared, and the difference was statistically significant (X2=59.714, P=0.000). In the non-resistance group, HBV DNA burden (to obtain the Lg value) and HBeAg-positive rate were lower than in the resistance group, and the differences were statisti-cally significant (t=2.015, P=0.044; X2=16.2, P=0.000, respectively).
Correlation between CD3+, CD4+, CD8+, CD4+CD25+, CD8+CD28–levels and virological response to entecavir treatment at the 4th week
Table 6 indicates that CD8+CD28–/CD3+level in the response group was lower than the suboptimal response group, and the difference was statistically significant (t=6.283, P=0.036). The differences in CD3+, CD4+, CD8+ and CD4+CD25+/CD3+levels between both groups were not significant (P40.05).
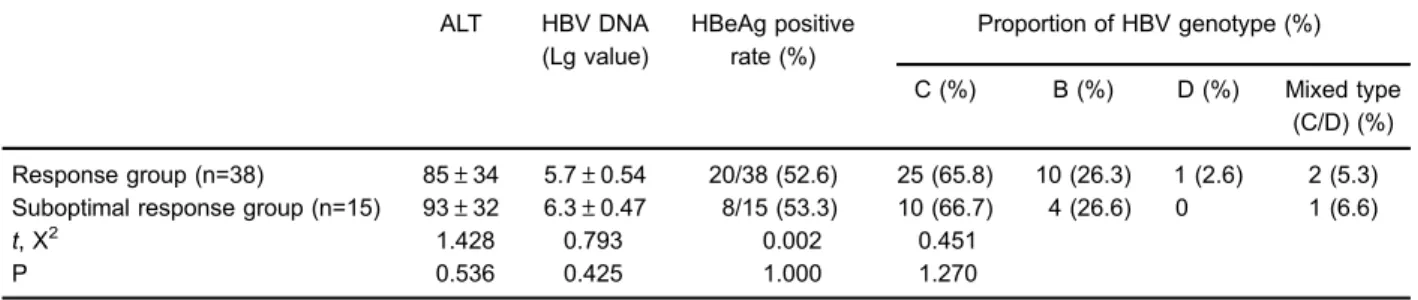
Correlation between HBV genotype and virological response to entecavir at the 4th week of treatment
As reported in Table 7, the proportions of HBV in the response and suboptimal response groups were 65.8 and 66.7% for genotype C, respectively; 26.3 and 26.7.3% for Table 4.Correlation between hepatitis B virus (HBV) genotype and virological response to lamivudine on the 4th week of treatment.
ALT (U/L) HBV DNA (Lg value)
HBeAg positive rate (%)
Proportion of HBV genotype (%)
C (%) B (%) D (%) Mixed type (C/D) (%)
Response group (n=26) 103±35 5.1±0.49 8/26 (30.8) 18 (69.2) 5 (19.2) 2 (7.7) 1 (3.8)
Suboptimal response group (n=58) 96±38 6.7±0.67 27/58 (46.6) 42 (72.4) 11 (20.0) 3 (5.2) 2 (3.4)
t, X2 1.312 2.164 4.239 0.226
P 0.436 0.038 0.040 0.973
Data are reported as means±SD, unless otherwise specified (Student’st-test and X2test). ALT: alanine aminotransferase.
Table 5.Correlation between hepatitis B virus (HBV) genotype and the incidence of drug resistance at the 96th week of lamivudine treatment.
ALT (U/L unit)
HBV DNA (Lg value)
HBeAg positive rate (%)
Proportion of HBV genotype (%)
C (%) B (%) D (%) Mixed type
(C/D) (%)
Non-resistance group (n=40) 80.3±21.4 5.3±0.60 7/40 (17.5) 24 (60) 12 (30) 3 (7.5) 1 (2.5)
Resistance group (n=44) 76.7±26.2 6.4±0.54 28/44 (63.6) 35 (79.5) 1 (2.3) 1 (2.3) 7 (15.9)
t, X2 1.236 2.015 16.2 59.714
P 0.527 0.044 0.000 0.000
Data are reported as means±SD, unless otherwise specified (Student’st-test and X2test). ALT: alanine aminotrasferase.
Table 6.Correlation between CD3+, CD4+, CD8+, CD4+CD25+,CD8+CD28–levels and virological response to entecavir treatment at the 4th week.
CD3+ CD4+ CD8+ CD4+CD25+/CD3+ CD8+CD28–/CD3+
Response group (n=38) 78.1±11.8 37.9±13.2 36.3±7.2 2.01±0.84 15.57±6.3
Suboptimal response group (n=15) 76.3±12.4 36.2±15.6 34.5±6.1 1.92±0.86 25.26±7.02
t 0.389 0.647 0.904 1.173 6.283
P 0.825 0.583 0.247 0.648 0.036
genotype B, respectively, and 2.6 and 0% for genotype D, respectively. Comparisons were performed in terms of HBV DNA loads (to obtain the Lg value), HBeAg positive rate, ALT level and the constituent ratio of virus genotypes, and the differences were not significant (P40.05).
Discussion
Recent international and local studies have indicated that early virological response could predict drug resis-tance to nucleoside analogues in the future (12). In the current study, HBeAg positive rate and HBV DNA load in the virological response group and non-resistance group were lower than in the suboptimal response group and drug resistance group at the 4th week of lamivudine therapy. This indicates that negative HBeAg and low viral replication are advantage factors for the four-week viro-logical response to lamivudine therapy and non-drug resistance at the 96th week of treatment. Virological re-sponse is more likely to occur in patients with HBV infection and negative HBeAg, which may be related to immune statuses that are different from patients with positive HBeAg, in addition to low viral replication. The results of this study revealed that patients with virus genotype C were more prone to drug resistance following lamivudine therapy, which was similar to the results of studies performed by other Chinese scholars (13). This indicates that the efficacy of lamivudine was greatly influenced by the baseline factors of patients, which is a disadvantage of lamivudine treatment. However, the virological response of patients in the entecavir treatment group was in general not affected by liver function, HBV DNA load, HBeAg status, virus genotypes and other baseline factors, indi-cating the advantages of entecavir treatment.
A study was further performed on the relationship among CD3+, CD4+, CD8+, CD4+CD25+ and CD8+ CD28– frequency and virological response, as well as drug resistance, in both nucleoside therapy groups. The results indicated that the CD4+CD25+ levels in the 4-week virological response group and in the 2-year non-resistance of the lamivudine treatment group were higher than in the suboptimal response group and drug resistance
group. This was in contrast with the opinion of many scholars that the immune suppression of CD4+CD25+ has a negative effect on the clearance of viruses (14–16). This analysis indicated that such results may be related to antiviral actions of partially activated effector T cells included in CD4+CD25+(17). Therefore, recent interna-tional and local studies have considered that specific T cells containing CTLA-4, GITR, OX-40 and FoxP3, as well as other surface markers, were more suitable for the features of Treg cells (18). Hence, some scholars con-sidered that highly expressed FoxP3CD4+CD25+T was a specific marker for Treg cells (4). No significant dif-ference was found in CD4+CD25+T level between the virological response group and suboptimal response group in the entecavir treatment group. However, CD8+ CD28–level in the response group was significantly lower than in the suboptimal response group. In addition, CD8+ CD28–level in the non-resistance group with lamivudine treatment was significantly lower than that in the resis-tance group. This indicated that increased CD8+CD28– levels reduced the clearance capacity of viruses and increased drug resistance risk. International scholars (19,20) have demonstrated that CD8+CD28– could induce a specific T cell subgroup of tolerant APC, and result in no reactivity of helper T cell (Th) by triggering inhibitory signal circuits. This indicates that the immuno-suppressive action of CD8+CD28–is stronger and more extensive than that of CD4+CD25+. Accordingly, our study found that CD8+CD28– percentage can more accurately reflect immune suppression on the clearance of HBV. Boni et al. (15) indicated that for patients who responded to nucleoside therapy effectively, CD4+CD8+ level remained lower than healthy people, and immune response in the patients with chronic HBV was weaker than in healthy people. These data indicate that partial actions of HBV-specific T lymphocytes were recovered, but without returning to normal levels.
Acknowledgments
This research was supported by the Natural Science Funding of Gansu province (No. 1308RJZA296).
Table 7.Correlation between HBV genotype and virological response to entecavir at the 4th week of treatment.
ALT HBV DNA
(Lg value)
HBeAg positive rate (%)
Proportion of HBV genotype (%)
C (%) B (%) D (%) Mixed type (C/D) (%)
Response group (n=38) 85±34 5.7±0.54 20/38 (52.6) 25 (65.8) 10 (26.3) 1 (2.6) 2 (5.3)
Suboptimal response group (n=15) 93±32 6.3±0.47 8/15 (53.3) 10 (66.7) 4 (26.6) 0 1 (6.6)
t, X2 1.428 0.793 0.002 0.451
P 0.536 0.425 1.000 1.270
References
1. Lim SG, Jia JD, Hwang SG. Baseline characteristics and early response predictors of therapeutic outcomes in telbivu-dine or lamivutelbivu-dine-treated HBeAg positive chronic hepatitis B patients.Hepatol Int2008; S76.
2. Keeffe EB, Zeuzem S, Koff RS, Dieterich DT, Esteban-Mur R, Gane EJ, et al. Report of an international workshop: roadmap for management of patients receiving oral therapy for chronic hepatitis B.Clin Gastroenterol Hepatol2007; 5: 890–897, doi: 10.1016/j.cgh.2007.05.004.
3. Webster GJ, Reignat S, Brown D, Ogg GS, Jones L, Seneviratne S, et al. Longitudinal analysis of CD8+T cell specific for structural and nonstructural hepatitis B virus proteins in patients with chronic Hepatitis B implications for immunotherapy.J Virol2004; 78: 5707–5719, doi: 10.1128/ JVI.78.11.5707-5719.2004.
4. Stoop JN, van der Molen RG, Baan CC, vdLL, Kuipers EJ, Kusters JG, et al. Regulatory T cells contribute to the impaired immune response in patients with chronic hepatitis B virus infection.Hepatology2005; 41: 771–778, doi: 10.1002/hep. 20649.
5. Franzese O, Kennedy PT, Gehring AJ, Gotto J, Williams R, Maini MK, et al. Modulation of the CD8+-T-cell response by CD4+CD25+regulatory T cells in patients with hepatitis B virus infection.J Virol2005; 79: 3322–3328, doi: 10.1128/ JVI.79.6.3322-3328.2005.
6. Zhang JY, Song CH, Shi F, Zhang Z, Fu JL, Wang FS. Decreased ratio of Treg cells to Th17 cells correlates with HBV-DNA suppressionin chronic hepatitis B patients under-going entecavir treatment. PLoS One 2010; 5: e13869, doi: 10.1371/journal.pone.0013869.
7. Missale G, Pilli M, Zerbini A, Penna A, RL, Barili V, et al. Lack of full CD8 functional restoration after antiviral treat-ment for acute and chronic hepatitis C virus infection.
Gut2012; 61: 1076–1084, doi: 10.1136/gutjnl-2011-300515. 8. Batliwalla FM, Rufer N, Lansdorp PM, Gregersen PK. Oligoclonal expan-sionsinthe CD8(+)CD28(-)T celLs largely explain the shorter telomeres detected in this subset: analysis byflow FISH. Hum Immunol2000; 61: 951–958, doi: 10.1016/S0198-8859(00)00157-9.
9. Lok AS, McMahon BJ. AASLD practice guidelines. Chronic hepatitis B: update 2009.Hepatology2009; 50: 1–36. 10. Biswas A, Banerjee A, Chandra PK, Datta S, Panigrahi R,
Dutta D, et al. Variations in the functional domain of basal core promoter of hepatitis B virus among eastern indian patients with prevalence of genotypes A, C, and D among the same ethnic popuIation.J Med Virol2011; 83: 253–260, doi: 10.1002/jmv.21979.
11. Chinese Society of Hepatology and Chinese Society of Infectious Diseases and Chinese Medical Association. The guideline of prevention and treatment for chronic hepatitis B.
J Exper Clin Infect Dis (Electronic Edition)2011; 5: 50–60. 12. Yuen MF, Fong DY, Wong DK, Yuen JC, Fung J, Lai CL.
Hepatitis B virus DNA levels at week 4 of lamivudine treatment predict the 5-year ideal response. Hepatology
2007; 46: 1695–1703, doi: 10.1002/hep.21939.
13. Zhong YW, Li J, Song HB, Duan ZP, Dong Y, Xing XY, et al. Virologic and clinical characteristics of HBV genotypes/ subgenotypes in 487 chinese pediatric patients with CHB.
BMC Infect Dis 2011; 11: 262, doi: 10.1186/1471-2334-11-262.
14. Li CZ, Xue JY, Yin W, Liu YY, Fan WH, Xu H, et al. Viral infection parameters not nucleoside analogue itself corre-lates with host immunity in nucleoside analogue therapy for chronic hepatitis B. World J Gastroenterol 2014; 20: 9486–9496.
15. Boni C, Laccabue D, Lampertico P, Giuberti T, Viganò M, Schivazappa S, et al. Restored founction of HBV-specific T cells after long-term effective therapy with nucleas(t)ide anologues.Gastroenterology2012; 143: 963–973, doi: 10.1053/ j.gastro.2012.07.014.
16. Boettler T, Spangenberg HC, Neumann-Haefelin C, Panther E, Urbani S, Ferrari C, et al. T cells with a CD4+CD25+ Regulatory phenotype suppressin vitroproliferation of virus-specific CD8+T cells during chronic hepatitis C virus infec-tion.J Virol 2005; 79: 7860–7867, doi: 10.1128/JVI.79.12. 7860-7867.2005.
17. Huang Y, Gan J, Luo E, Wang X, Chen L, Yang L. Expression levels of CD4+CD25+regulatory T cells in peri-pheral blood of patients with chronic hepatitis B and clinical significance. J Jilin University (Medicine Edition).Zhonghua Gan Zang Bing Za Zhi2014; 22: 577–579.
18. Penna A, Laccabue D, Libri I, Giuberti T, Schivazappa S. Peginterferon-a does not improve early peripheral blood HBV-specific T-cell responses in HbeAg-negative chronic hepatitis. J Hepatol 2012; 56: 1239–1246, doi: 10.1016/ j.jhep.2011.12.032.
19. Li X, Kong H, Tian L, Zhu Q, Wang Y, Dong Y, et al. Changes of costimulatory molecule CD28 on circulating CD8+T cells correlate with disease pathogenesis of chronic hepatitis B.
Biomed Res Int2014; 2014: 423181.
20. Liang M, Ma S, Hu X, Zhou B, Zhang J, Chen J, et al. Cellular immune responses in patients with hepatitis surface antigen seroclearance induced by antiviral therapy.Virol J