Coimbra Health School - ESTeSCoimbra
Master of Pharmacy
Specialization in Applied Pharmacotherapy
Dissertation
A
Novel
Integration Approach:
Perturbation Studies
in vitro
Using PDK1
Inhibitors in Glioblastoma Multiforme
ii
Coimbra Health School - ESTeSCoimbra
Master of Pharmacy
Specialization in Applied Pharmacotherapy
Dissertation
A
Novel
Integration Approach:
Perturbation Studies
in vitro
Using PDK1 Inhibitors in
Glioblastoma Multiforme
Student: Luís Carlos Fernandes de Oliveira, BScPharm
Supervisor: Ana Paula Fonseca, PhD
Co-supervisor: Armando José Cerejo Caseiro, PhD Co-supervisor: Maria Paula Marques, PhD
Master of Pharmacy – Specialization in Applied Pharmacotherapy
iii
Be —do 't try to e o e
iv
Acknowledgements
This su essful a d i o ati e aste s p oje t is the i teg ati e, as lite all stated o the
title, and collective effort of many special people who always have given to me their support, words of motivation and confidence.
Looking back on time, when I was planning my aste s research project under the Original Project Work I class, to be developed on the laboratory of DoctorRichard Kolesnick from Memorial Sloan Kettering Cancer Center (New York, United States of America) and after hear big NO from
Luso-American Development Foundation to support that project/internship, I could see and understand that e erythi g happe for a reaso . I could push myself forward, and within a one month of deadline, I designed and planned a whole new & innovative project based on my scientific desires and aspirations, therefore, the project A No el I tegratio Approa h: Pertur atio “tudies
i itro Usi g PDK1 I hi itors i Glio lasto a Multifor e was born and many nights & days of plenty hard work would come. But, I would be so far of thinking what this would give me so many wonderful professional and personal moments.
With this project, many were the abstracts submitted and all accepted to present in national and international conferences. It include, but not just, the Pharmacology 2013 (London, United Kingdom) from the British Pharmacological Society, where I heard many words of support and gratification, including conversations with the fantastic Professor Ian Wilson from Imperial College London (United Kingdom). As well, during this period my oral presentation capacities were further developed and almost in the end of the project, I won the Best Scientific Oral Communication on the Scientific Meeting of Pharmacy 2014 – Coimbra Health School II Annual Meeting (Coimbra, Portugal). Also, by developing a business idea –Intelligent Drugs– based on the scientific background of the general area of this dissertation, it was finalist of the Arrisca C 2013 Business Ideas Competition from the University of Coimbra.
Master of Pharmacy – Specialization in Applied Pharmacotherapy
v
colleges, sisters, friends, lover or even some strangers – made me stronger, with willpower and better of heart.
I must start to acknowledge my wonderful and fabulous supervisor Doctor Ana Paula Fonseca, from the Coimbra Health School, who support firmly my idea of project and told me right
a I believe on that and I trust in your abilities. Ma thanks fo ei g the e he I hea d NOs
a d he I hea d the YESs. Thanks for supporting my ambitions and to make this project breath
and be successful! I have no words to describe my pleasure of had you as my supervisor during this short but LONG time.
To my fantastic co-supervisor Doctor Armando Caseiro, from the Coimbra Health School, who from the start was enthusiastic about this research project, helping to build connections to perform the proteomic studies (which will taking place soon) and with who the scientific talks were not time-consuming, but ti i g-pleasa t, then, sure I need to give a big thanks!
To my eyes-on-la co-supervisor Doctor Maria Paula Marques, from Molecular Physical-Chemistry Research Unit, Faculty of Science and Technology from the University of Coimbra, many
thanks for receiving me in this research unit, making possible all the right conditions to perform in the best way all research experiments and for the scientific research knowledge shared. Also, I will never forget your appreciation about the fantastic morphology of the U-87 MG cells all the time that I told you that I find an interesting one to be seen! Thanks! Additionally, I would like to thanks
all of my colleges from the laboratory!
Many thanks to Doctor Simona Rapposelli from the Department of Pharmacy of the University of Pisa (Italy), who upon collaboration kindly provided compounds for test on my project.
Thanks for believing on my project and shown to be always present, even far way, to clarify any questions. It was a pleasure to collaborate with you and I hope the future bring to us new professional opportunities of making science and better treatments for patients!
Thank you very much to Doctor Conceição Pedroso de Lima, from the Center for Neuroscience and Cell Biology of the University of Coimbra (Portugal), who kindly offered the U-87 MGcell line.
vi
I would like to show my sincere appreciation to the Coimbra Health School by the financial
suppo t of aste s p oje t a d fo given me the opportunity to learn with fantastic professionals during the Master of Pharmacy | Specialization in Applied Pharmacotherapy. I must say without any doubt, the best choice of master programme that I could do!
Talking about people – my friends – that mostly change our life or let us had a different vision about this incredible world and that supported my dreams and helped during my insecurities, making all of my days better, I must acknowledge them with all my heart. So, a big warmly thanks
to Carina Leiria (what else tween?!), Patricia Martins (thanks for opening my eyes, you know!), Hernani Medina (what is tonight?? NOOOOO, study!), Sonia Fiuza (my sweet light), Tânia Silva
e ause I a happy), Guida Amado hat is, it is), João Monteiro (moto passion sharing), Ana Serrano (we must believe). Also, many thanks to my colleges from Latin Dance class and from the orchestra of the Tu a A adé i a da U i ersidade de Coi ra. As well as important, many thanks for my colleges – both musicians & executive board –f o the Ba da Musi al da Casa do Povo de Santa Marinha do Zêzee, especially Sónia Nogueira and Candida Costa, who always supported my absences on the board during this journey.
Lastly, but far from least, by the huge love, affection and words of motivation, as well as, by their support during this journey, by listening all my problems and by understanding my absences, an unmeasurable thanks to my FAMILY, who I Love and who without, it would be impossible. For my mother Maria de Assunção Fernandes, my queen, and for my wonderful father
Master of Pharmacy – Specialization in Applied Pharmacotherapy
vii
Resumo
Os objetivos a atingir em 2020 no que respeita ao processo de investigação e desenvolvimento de medicamentos estão claramente focados na redução em termos temporais na investigação pré-clínica e clínica e na diminuição da taxa de atrito entre as novas moléculas. De forma a atingir estes objetivos, um novo conceito tem sido desenvolvido e aplicado a este complexo e moroso processo, este é a Farmacologia Quantitativa e de Sistemas. Além disso, esta abordagem inovadora pode ser crucial para o tratamento de determinados tipos de tumores cerebrais letais – Glioblastoma Multiforme (GBM) – que permanecem um desafio terapêutico, e por tanto, uma doença com um destino fatal para os doentes. Por estas razões, esta dissertação de mestrado apresenta uma especial relevância, tendo por objetivos avaliar o potencial impacto e importância biológica da variação de parâmetros farmacológicos, para além da potência, no contexto da resposta celular ao fármaco, pela avaliação da perturbação induzida em células do GBM por inibidores do PDK1 e pela realização de uma caracterização multiparamêtrica dose-resposta destas novas moléculas.
A presente dissertação assume em Portugal a vanguarda na área da Farmacologia Quantitativa e de Sistemas aplicada ao processo de investigação e desenvolvimento de medicamentos. Em última estância, esta dissertação poderá contribuir para uma melhor previsão dos fármacos durante este processo, significando assim possíveis vantagens para os utentes, indústrias farmacêuticas, institutos de investigação, governo e institutos superiores.
Palavras-chave
PDK1 | Glioblastoma Multiforme | Farmacologia Quantitativa e de Sistemas | Investigação e
viii
Abstract
The target objectives for 2020 regarding the drug discovery & development process are clearly focused on the reduction of the years of both preclinical and clinical research and decrease drug attrition rate. With a view to achieve this goal, a novel concept can be applied to this complex and time-consuming process – the Quantitative and Systems Pharmacology. In addition, this innovative approach can be critical for the treatment of a lethal type of primary brain tumour – Glioblastoma Multiforme (GBM) – which remains therapeutically challenging, therefore a disease with a clear dramatic fatal destination for patients. For these reasons, the present MSc thesis project has a special relevance by aiming to evaluate the potential impact and biological importance of variation in pharmacological parameters other than potency, in the context of cellular drug response, by measure the induced perturbations in GBM cells by PDK1 inhibitors and performing a multiparametric characterization dose-response of these drugs.
This project assume in Portugal the vanguard on the area of Systems Pharmacology applied to drug discovery & development process. Ultimately, it will hopefully contribute to a better prediction of specific drugs, which means possible advantages for patients, pharmaceutical companies, research institutes, governments and academia.
Keywords
PDK1 | Glioblastoma Multiforme | Quantitative & Systems Pharmacology | Drug Discovery &
Master of Pharmacy – Specialization in Applied Pharmacotherapy
ix
Index
Acknowledgements ... iv
Resumo ... vii
Abstract ... viii
Index ... ix
Figures Index ... xi
Abbreviations ... xii
Tables Index ... xviii
Introduction ... 1
Drug Discovery & Development ... 1
Challenges ... 3
Oncologic Drug Discovery & Development Challenges ... 5
Innovation on the Drug Discovery & Development Process ... 7
Quantitative & Systems Pharmacology ... 11
What is it? ... 11
Parameterising perturbagen dose-response relationships ... 12
Systems Pharmacology: Glioblastoma Multiforme ... 13
Aims of the Study ... 26
Materials & Methods ... 27
Reagents ... 27
Equipment ... 29
Compounds & Stock Solutions ... 30
Cell Culture ... 32
Resuscitation of Frozen Cell Lines ... 32
Cell Morphology & Cell Culture Conditions ... 32
Subculture of Adherent Cell Lines ... 33
Cell Quantification ... 33
Cell Proliferation Studies & Doubling Time Analysis ... 34
x
Sulforhodamine B (SRB) Colorimetric Assay ... 35
Multiparametric Dose-Response Analysis ... 36
Cell Lysis and Protein Extraction ... 37
Quality Control of the data ... 38
Results & Discussion ... 39
Cellular Growth Profile of the U-87 MG cell line... 39
In vitro Perturbation studies ... 41
Sulforhodamine B (SRB) Assay ... 41
Multiparametric Dose-Response Analysis ... 47
Conclusions ... 51
Master of Pharmacy – Specialization in Applied Pharmacotherapy
xi
Figures Index
Figure 1 - Scientific background shifts for the drug discovery process. ... 2
Figure 2 – Drug discovery and development models. ... 8
Figure 3 – What the drug discovery process might look like with a fully developed computational systems approach – Vi tual Ma ... 9
Figure 4 – Histopathology of glioblastoma. ... 14
Figure 5 – Possible cells of origin of glioma. ... 16
Figure 6 – GSCs microenvironment. ... 17
Figure 7 – Overlay of predicted functional interactions onto a human curated GBM pathway. .... 19
Figure 8 – PDK1 feature view of Protein Data Bank (PDB) entries mapped to a UniProtKB sequence. ... 20
Figure 9 – Overview of the PDK1 structure.. ... 21
Figure 10 – Schematic representation of compound solutions preparation. ... 31
Figure 11 – U-87 MG cell line human glioblastoma astrocytoma. ... 32
Figure 12 – Schematic representation of haemocytometer preparation and cell counting. ... 34
Figure 13 – Sulforhodamine B structure. ... 35
Figure 14 – Cell Lysis and protein extraction procedure. ... 37
Figure 15 – Graphical representation of the cell proliferation profile for the U-87 MG cell lina and morphological representation of the cells during the logaritmic phase... 40
Figure 16 – Perturbation effect of G51 drug at the cellular system-level of U-87 MG cell line. ... 42
Figure 17 – Perturbation effect of FC100 drug at the cellular system-level of U-87 MG cell line. .. 44
xii
Abbreviations
%CV – Coefficient of variation AEDs – Antiepileptic drugs AKT or PKB – Protein kinase B ALERTS – Number of structural alerts ALOGP – Octanol-water partition coefficient AROM – Aromatic rings
AUC – Area under the dose-response curve C0– Untreated control well
cAMP – Cyclic adenosine monophosphate
CBTRUS – Central Brain Tumour Registry of the United Stated of America CDKN2A – Cyclin-dependent kinase inhibitor 2A
ceRNAs – Competitive endogenous RNAs cGMP – Cyclic guanosine monophosphate CMap – Connectivity Map
CNS – Central Nervous System
CNS MPO – Central Nervous System Multiparameter Optimisation CO2– Carbon dioxide
C-terminal – Carboxyl-terminal
Master of Pharmacy – Specialization in Applied Pharmacotherapy
xiii DMSO – Dimethyl Sulfoxide
DNA – Deoxyribonucleic acid DTA – Doubling time analysis DTT – Dithiothreitol
E0 or Emax - Maximum Effect
EC50 - Concentration at half-maximal effect
EGFR – Epidermal growth factor receptor Einf - Minimum Effect
EMA – European Medicines Agency FBS – Fetal bovine serum
FDA – Food and Drug Administration FI – Functional interaction
FOXO – Forkhead box transcription factors GBM – Glioblastoma Multiforme
GI50 - Concentration needed for growth inhibition by 50%
GICs – Glioma-initiating cells GSCs – Glioma stem cells
HBA – Hydrogen-bond acceptors HBD – Hydrogen-bond donors HDAC – Histone deacetylase
xiv HM – Hydrophobic motif
HS – Hill Slop
IC50– Half-maximum inhibitory concentration
IDH1 – Isocitrate dehydrogenase 1 lncRNAs – Long non-coding RNAs LOA – Likelihood of approval Log – Logarithmic
LOH – Loss of heterozygosity
MAPK – Mitogen-activated protein kinase MeOH – Methanol
MF – Molecular formula MgCl2 – Magnesium chloride
MGMT – O-6-methylguanine-DNA methyltransferase miRNA – Micro-ribonucleic acid
MoA – Mechanism of action
mTOR – Mammalian target of rapamycin
MTT – 3-(4,5-dimethylthiazol-2-yl)-2,5-diphenyltetrazolium bromide MVP – Microvascular proliferation
Master of Pharmacy – Specialization in Applied Pharmacotherapy
xv NSCs – Neural stem cells
N-terminal – Amino-terminal
OPCs – Oligodendrocyte precursor cells PAK1 – p21-activated kinase-1
PBS – Phosphate Buffered Saline PC – Permeability coefficient
PDGF – Platelet-derived growth factor
PDGFRA – Platelet-derived growth factor receptor, alpha polypeptide PDK1 – 3-phosphoinositide-dependent protein kinase-1
PDT – Population doubling time PH – Pleckstrin homology
PI3K – Phosphtaidylionositol-3-kinase
PIF – 3-phosphoinositide-dependent protein kinase-1 interacting fragment PK – Pharmacokinetics
PKA – Protein kinase A PKC – Protein kinase C
PKG – Cyclic guanosine monophosphate-dependent protein kinase PKN1 – Serine/threonine-protein kinase N1
PKN2 – Serine/threonine-protein kinase N2 PMSF – Phenylmethanesulfonyl fluoride solution PRIM – Patient Rule Induction Method
xvi PRKCD – Protein kinase C delta type
PRKCZ – Protein kinase C zeta type PS – Permeability-surface area product PSA – Surface area
PTEN – Phosphatase and tensin homolog QED – Quantitative estimate of drug-likeness QSP – Quantitative and Systems Pharmacology R&D – Research and development
R2– Coefficient of determination
Raf – Raf murine sarcoma viral oncogene homolog RAS – Rat Sarcoma
ROTB – Rotatable bonds
RPS6KA1 – p90 ribosomal protein S6 kinase alpha-1 RPS6KA2 – p90 ribosomal protein S6 kinase alpha-2 RPS6KA3 – p90 ribosomal protein S6 kinase alpha-3 RPS6KB1 – p70 ribosomal protein S6 kinase beta-1 SB – Sleeping Beauty
SD – Standard deviation
SEM – Standard error of the mean
Master of Pharmacy – Specialization in Applied Pharmacotherapy
xvii SRB – Sulforhodamine B
xviii
Tables Index
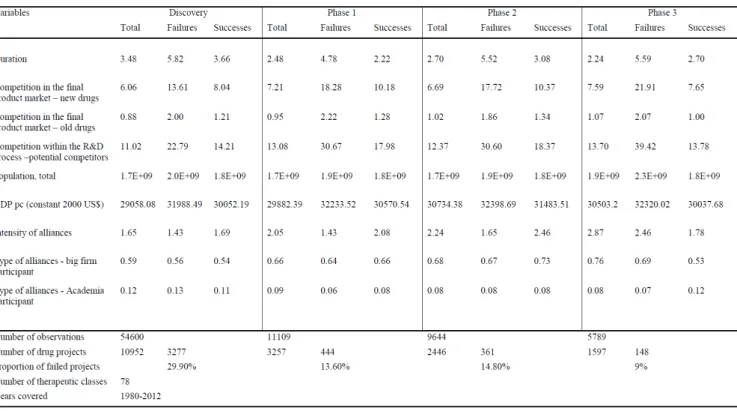
Table 1 – Descriptive statistics across the years between 1980 – 2012 for failures and successes in
R&D, duration of the projects, competition, alliances and market size proxies. ... 3
Table 2 – Evolution trend on the type of molecules terminated from 2011 to 2012. ... 6
Table 3 – Discontinued drugs by phase in 2006, 2007, 2008, 2010, 2011 and 2012. ... 6
Table 4 – Reasons for discontinued development of oncology drugs candidates in 2006, 2007, 2008, 2010, 2011 and 2012. ... 6
Table 5 – Similarities and differences among GSCs, glioma cells of origin, and GICs. ... 15
Table 6 – List of the reagents used along the study. ... 27
Table 7 – List of the equipment used along the study. ... 29
Table 8 – Physicochemical properties of G51 compound. ... 30
Table 9 – Physicochemical properties of FC100 compound. ... 30
Table 10 – Multiple comparison analysis of the G51 induced perturbation in the cellular system-level U-87 MG cell line. ... 43
Table 11 - Multiple comparison analysis of the FC100 induced perturbation in the cellular system-level U-87 MG cell line. ... 45
Master of Pharmacy – Specialization in Applied Pharmacotherapy
1
Introduction
Drug Discovery & Development
Nowadays and regarding the actual world economic conjuncture, on the science community the inefficiencies of the drug discovery and development process are a fashionable subject (Antman et al., 2012; Csermely et al., 2013). As we look back, we can see that this process has faced multiple paradigm shifts since its beginning, which dates back to the early days of human civilization (Chandra, 2009; Ji et al., 2009). Back there, drugs were much more than science, they were also associated with religious and spiritual healing. Those medicines were derived mainly from natural products, such as plants and supplemented by animal materials and minerals. Its discovery was probably done by combination of trial and error experimentation, observing the human and animal reactions. Just in the late 1800s, the drug discovery and development started to follow scientific techniques. This approach increased after the World War I, with the born of the modern pharmaceutical industry, rising and establishing the scientific principles of this complex process (Ji
et al., 2009; Ng, 2008). In spite of this huge step on the modern pharmaceutical industry, the science behind the research and development (R&D) process has been changing, and the early process entirely focused on serendipity or systematic screening (Figure 1A) has been replaced by other process models, such as the ligand-centric approach (Figure 1B), and lately the target-centric approach (Figure 1C) (Chandra, 2009).
2
order to achieve the required qualities of outputs, the European Medicines Agency (EMA), the Food and Drug Administration, (FDA), and other regulatory entities have assumed that it is critical the development of the regulatory science through this process, and so, increase the effectiveness of R&D (Gispen-de Wied et al., 2013).
Master of Pharmacy – Specialization in Applied Pharmacotherapy
3
Challenges
In spite of the innovative developments during the last decades and the huge investments made, the R&D process is still largely inefficient, thus aisi g e p essio s su h as alle of death
& u se of att itio i the s ie e o u it to express the drug failures during this process (Abou-Gharbia et al., 2014; Brown et al., 2003). Table 1 comprises a relatively high percentage of failure (29.9 %) for projects in the preliminary stage of discovery than projects achieving the later stages of the process. This proportion decreases to around 14 % in phase I and II of clinical trials. As well, around 10 % of the projects that are in phase 3 clinical trials fail to be launched in the market (Barrenho et al., 2013). Even for the drugs that pass these alle s , the u de sta di g of thei mechanism is lacking, and this fact is exacerbated by the gap on the respective representative disease models. Therefore, both therapeutic and side effect are poorly predictable (Zhao et al., 2012; Hoeng et al., 2013).
Table 1 – Descriptive statistics across the years between 1980 – 2012 for failures and successes in R&D,
duration of the projects, competition, alliances and market size proxies.
4
The high drug attrition rates – percentage of new molecules that start in one of the clinical evaluation phases and that fail to succeed on that phase (Moreira, 2014) – are the biggest challenge for R&D model, and understanding it is a key to better understand pharmaceutical industry performance, the magnitude of the long-term investments involved in R&D, and improving investment activity in the future (Barrenho et al., 2013; Csermely et al., 2013). In order to analyse the success of drugs during this process, there is reported two different types of metrics of success:
Phase “u ess a d Likelihood of App o al LOA . The fi st et i , Phase “u ess , is al ulated as
the number of drugs that moved from one phase to the next phase divided by the sum of the number of drugs that progressed to the next phase and the number of drugs that were suspended. The n value associated with the Phase Success represents the number of drugs that have advanced plus the number of drugs that have been suspended, labelled as transitions. The LOA denotes the probability of reaching approval from the current phase, being expressed in percentage. It is calculated as the product of each Phase Success probability leading to approval. The n value associated with LOA is the sum of the n values for each Phase Success included in the LOA calculation (Hay et al., 2014).
Still on the side of the business model of R&D, additional challenges are related with key patents expiration, the increase of generic competition and the increasingly constrained healthcare budgets (Williams, 2011). These business concerns are strictly related with the scientific side of the question, since payers will look increasingly to only reimburse medicines that show a clear improvement in patient outcomes relative to existing therapies in defined patient populations, and so, there are some factors that might be critical to analyse and improve in this context:
Poo ta get ualit , k o as d ugga ilit -t ap (Csermely et al., 2013);
Chemical leads are often discovered to have unwanted side-effects and/or be toxic at later development phases (Csermely et al., 2013);
Underestimation of the complexity of cells, organisms and human disease (Csermely et al., 2013);
Lack of mechanistic understanding of how drugs interactions at the molecular level manifest themselves as alterations in tissue/organ-level function (Zhao et al., 2012);
Master of Pharmacy – Specialization in Applied Pharmacotherapy
5
Cellular and tissue/organ-level systems are treated as black boxes (Zhao at al., 2012);
Patient-to-patient variability in drug response (Fallahi-Sichani et al., 2013);
Inability to predict adverse events when the drug is brought to market and used by the population at large (Zhao et al., 2012);
The more limited phenotypic screening in recent years (Swinney et al., 2011);
Data unreliable (Csermely et al., 2013).
Oncologic Drug Discovery & Development Challenges
In oncology, the R&D seems to be even more complex as the success rate of drug candidates is abysmally lower when compared with the other areas of healthcare. On that field, the success rates for drugs entering clinical development range from 3 to 8 % and less than 5% will be on the pharmacy shelf (Williams, 2011; Bhattacharjee, 2012).
6
Table 2 – Evolution trend on the type of molecules terminated from 2011 to 2012.
2011 2012
20 Small molecules 19 Small molecules
13 Antibodies 8 Antibodies
2 DNA-based therapeutics 1 Antisense oligonucleotide
2 Non-antibody proteins 1 Cyclic Peptide
Table 3 – Discontinued drugs by phase in 2006, 2007, 2008, 2010, 2011 and 2012.
Year Phase I Phase II Phase III Total I-III
2006 8 5 2 15
2007 9 10 4 23
2008 12 5 6 23
2010 11 12 5 28
2011 23 9 5 37
2012 13 9 7 29
Table 4 – Reasons for discontinued development of oncology drugs candidates in 2006,
2007, 2008, 2010, 2011 and 2012.
Year
Reasons
Total
Unspecified Strategic Efficacy Toxicity PK Accrual
2006 3 2 8 2 0 0 15
2007 10 2 9 1 1 0 23
2008 8 4 3 6 0 2 23
2010 8 9 6 4 1 0 28
2011 8 20 5 1 3 0 37
2012 10 7 11 0 1 0 29
Reference: Williams, 2013a; Williams, 2013b
Reference: Williams, 2013b
Master of Pharmacy – Specialization in Applied Pharmacotherapy
7
In addition to the challenges shown above, the lack of resources, wrong incentives, aggressive pricing strategies or adverse regulatory environments, no consideration of tumour microenvironment, cross-talk and negative feedback loops, development of resistance, exposure time, drug delivery or the choice of preclinical models must be considered. Much remains to be done in terms of increasing the efficiency of drug development, although new and more effective medicines are being approved for the treatment of cancer. Some of these drugs have made improvements in overall survival for all patients with a given condition, whereas others have only show benefit in smaller groups of patients with known molecular aberrations (Moreno et al., 2013).
Innovation on the Drug Discovery & Development Process
Dramatic changes to the scientific and business environments have made it impossible for pharmaceutical and biotech companies to continue operating as they have over the past 30 years (Csermely et al., 2013). Also, there is currently impossible to predict precisely the effects of a particular candidate drug in humans, making initially promising drugs lack efficacy or to have unsupportable levels of toxicity-typically at a late stage of a clinical trials, costing years of effort and up to $1 billion (Leo, 2011).
To overcome these limitations, efforts and innovative approaches have been developed. One of them, which has been already reported as reaping benefit in terms of new, effective therapies seems to be the collaboration among academics, industry, regulators, government and not-for-profit organisations (Williams, 2013b). This has led to creation of large open-access databases of chemicals and associated bioactivity data, providing fantastic opportunities for computational research to contribute to a systemic understanding of drug-perturbed molecular and physiological processes, hopefully, leading to more rational drug discovery (Iskar et al., 2012). The integration of computational systems approach for drug target discovery with high-throughput screening technologies – covering gene expression, proteomics, metabolomics or cellular phenotypes – will contribute in a wide e te t to elu idate a d ug s ge e al e ha is of a tio (MoA) on a biological system, and so, shortcut many aspects by generating hypotheses early on the process. Just by curiosity, the large-scale profile-based comparison of drug treatments were pioneered by the Connectivity Map (CMap) project (Iskar et al., 2012). Other integrations
8
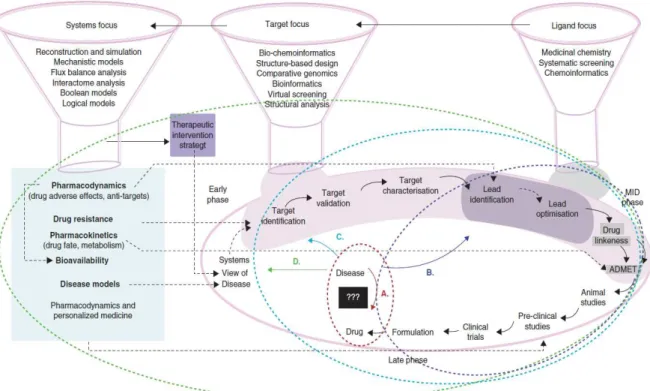
which diseases are characterized by disruptions of processes and networks at the cellular level, integrating profiles of altered gene expression, metabolite concentrations, and other. Also the incorporation of drug-drug similarity measures, side-effe t p ofiles, p ope ties of the d ugs ta gets, disease-disease si ila it , to i it phe ot pes, o pou d s e ha ism-based toxicity, characterize drug-induced organ and organism failures will be in the future part of the routine of the novel drug discovery and development process (Figure 2) and integrating modeling by computational systems approach is expected in a long run to be critical on this process (Figure 3) (Chandra, 2009; Iskar et al., 2012; PwC, 2011).
Figure 2 – Drug discovery and development models. Evolution of the drug discovery processes has resulted in
changing the discovery pipeline. A) la k- o odel ed . B) Ligand-centric approach (Blue). C) Target-centric
approach (cyan). D) Newly emerging shift to systems level focus (green). Various steps of the pipeline(s) as well
the broad techniques that are required and the issues that they can address are also indicated in the figure.
Master of Pharmacy – Specialization in Applied Pharmacotherapy
9
Figure 3 – What the drug discovery process might look like with a fully developed computational systems
approach – Virtual Man . Reference: PwC, 2011
Nowadays, so far, some different metric approaches have been well established with the aim to improve the survival of development candidates and increase the speed at which these candidates are identified (Wager et al., 2010). These app oa hes a e alled Ta getP odu t P ofiles , which are typically defined based on the existing body of knowledge and experience of development of orally dosed drugs, focusing the analysis of simple drug-like properties for known drugs, such as molecular weight (MW), lipophilicity (log P or log D), polar surface area (PSA), counts of hydrogen-bond acceptors (HBA), hydrogen-bond donors (HBD), aromatic rings (AROM) and rotatable bonds (ROTB). Some existing profiles based on different criteria are defined below (Yusof
et al., 2014; Ritchie et al., 2014; Wager et al., 2010):
Lipi ski s ‘ule of Fi e;
3/75 concept introduced by Pfizer;
Patient Rule Induction Method (PRIM);
Central Nervous System Multiparameter Optimisation (CNS MPO) Algorithm;
Drug-likeness Score.
10
are ideal). This calculation uses eight important properties, namely: MW, octanol-water partition coefficient (ALOGP), HBD, HBA, PSA, ROTB, AROM and number of structural alerts (ALERTS) (Ritchie
et al., 2014; Yusof et al., 2014). This approach seems to be attractive as it integrates several important molecular properties and provides a continuous scale against which structures can be compared, where compounds can still achieve reasonable scores even if one or two properties are unfavourable because the others are close to ideal. Also, it solves the issues arising from the use of hard cut-off thresholds for physicochemical properties (Ritchie et al., 2014).
Recently, the Harvard Medical School aiming to transform the drug discovery process
lau hed a I itiati e i “ ste s Pha a olog , hi h is a o p ehe si e st ateg o e i g
Master of Pharmacy – Specialization in Applied Pharmacotherapy
11
Quantitative & Systems Pharmacology
What is it?
As defined by the Quantitative and Systems Pharmacology (QSP) White Paper (Sorger et al., 2011), QSP is an emerging discipline, which focus on identifying and validating drug targets, understanding existing therapeutics and discovering new ones. Its goal is to understand, in a precise, predictive manner, how drugs modulate cellular networks in space and time, moreover, how they impact human pathophysiology.
The aim of this discipline is to develop formal mathematical and computational models that incorporate data at several temporal and spatial scales (Sorger et al., 2011; Iskar et al., 2012). The focus of these models will be on the interactions among multiple elements – biomolecules, cells, tissues and others – promoting the understanding and prediction of safety/efficacy profile (Agoram
et al., 2011). Creation of multi-scale models that ultimately span knowledge of molecules, cells, tissues and patients will be particularly critical for preclinical and clinical research teams evaluating target selection and testing therapeutic proof of concept (Geerts et al., 2013; Sorger et al., 2011).
QSP draws on several existing disciplines, including classic pharmacology, chemical biology, biochemistry and structural biology, molecular genetics and genomics, pathology, applied mathematics, and medicine, and has an intrinsic and extensive experimental component that incorporates approaches from tissue and organ physiology, pharmacology and cell biology as well
12
Parameterising perturbagen dose-response relationships
In order to assess the prediction of the drug response, and so, better characterize the drug and the whole system, other metrics than variation in potency (half-maximum inhibitory concentration – IC50) must be systematically measurement and integrated with other scientific
technologies (Fallahi-Sichani et al., 2013).
The focus to date on potency ignores the potential impact and biological importance of variation in other parameters, such as the (Fallahi-Sichani et al., 2013; Heiser et al., 2011):
Steepness of the dose-response curve, called Hill Slop (HS);
Maximum Effect (E0 or Emax);
Minimum Effect (Einf);
Area under the dose-response curve (AUC);
Concentration needed for growth inhibition by 50% (GI50);
Total Growth Inhibition (TGI);
Concentration at half-maximal effect (EC50).
During the development of a novel compound, reducing IC50 is certainly an important goal,
but when the aim is to understand variability in patient responses to an existing drug, it is likely to be more informative to focus on E0 and HS. Furthermore, different dose-response parameters
encode distinct information (Fallahi-Sichani et al., 2013):
E0, IC50, AUC are parameters for simplicity;
EC50, IC50 are classic measures of drug potency;
E0, Einf are measures of drug efficacy;
AUC combines potency and efficacy of a drug into a single parameter.
Some of the parameters mentioned above are reported to vary systemically with cell line and others with drug. For example, for cell-cycle inhibitors, E0 often but not always correlate with
cell proliferation rate. In the case of drugs targeting protein kinase B/phosphtaidylionositol-3-kinase/mammalian target of rapamycin (Akt/PI3K/mTOR) pathway, dose-response curves are reported to be unusually shallow. Also, HS and E0 shown to be frequently uncorrelated with each
Master of Pharmacy – Specialization in Applied Pharmacotherapy
13
was shown so far that HS was particularly high for drugs such as proteasome and histone deacetylase (HDAC) inhibitors, whereas inhibitors of the Akt/PI3K/mTOR pathway had low and variable HS, special drugs as PP242, temsirolimus, everolimus and rapamycin. In many cases, classical pharmacology has no ready explanation for this phenomenon of variation in dose-response parameters. Association with drug class or target is confounded by polypharmacology, which almost certainly affects the shape of dose-response curves at high drug concentrations, particularly with phenotypic measures of response (Fallahi-Sichani et al., 2013).
Systems Pharmacology: Glioblastoma Multiforme
Epidemiology
Glioblastoma Multiforme (GBM) is the most common intrinsic primary brain tumour in adults, and represents over 80% of diffuse gliomas (Toda, 2013). The age-adjusted rate for glioblastoma is 3.19/100 000, according to the last Central Brain Tumour Registry of the United Stated of America (CBTRUS) statistical report. It is evident that glioblastoma increases with age and incidence is 75-84 years old, being more common in white males. When it comes to children, GBM accounts approximating 3 % of all primary brain and Central Nervous System (CNS) tumours. The 5 year survival rate is approximately 12 % in children and <5% in adults (Olar et al., 2014).
Definitions & Histopathological Diagnosis
14
Histologically, glioblastoma is composed of pleomorphic cells, mitotic activity, intravascular microthrombi, necrosis with or without cellular pseudopalisading and/or microvascular proliferation (MVP) (Figure 4). Either one of the latter two features are the sine qua non criteria for diagnosis. This aggressive tumour encloses under its umbrella multiple distinct patterns ( small cell, giant cell, gliosarcoma, etc.) (Olar et al., 2014).
The WHO classification is based on subjective criteria and is imperfect in predicting patient outcome. Tumours may appear virtually identical by histology, yet still have very different outcomes. Beyond their histological criteria, progress in molecular techniques has allowed the identification of a number of markers and genetic profiles that can characterize gliomas (Hofer et al., 2014).
Glioblastoma may be divided into two identical morphological subtypes, based on the presence or absence of a precursor lesion. Primary glioblastoma is the most common type (~90%); it arises de novo, without evidence of a precursor lesion, and is common in older adults (> 50 years). Secondary glioblastoma represents progression from a pre-existent, lower-grade astrocytoma (WHO grades II or III) (Dunn et al., 2012). The time to progression from diffuse astrocytoma (WHO grade II) to glioblastoma is longer (~5 years) than the time to progression from anaplastic astrocytoma (WHO grade III), which is about 2 years. However, this is not a straight process (Olar
et al., 2014).
Figure 4 – Histopathology of glioblastoma. Proliferating atypical cells with mitotic activity, necrosis
Master of Pharmacy – Specialization in Applied Pharmacotherapy
15 Cellular and Molecular Biology Heterogeneity
Although morphologically identical, different glioblastoma tumours has been shown different clinical behaviours, and so, different clinical outcomes (Olar et al., 2014). Also, so far, it is well recognized that GBM shows high complex heterogeneous cellular, molecular, microenvironmental characteristics, which might partially explain the variety of clinical responses (Olar et al., 2014; Hofer et al., 2014; Dunn et al., 2012). Therefore, it is highly important to identify biomarkers able to predict individual prognosis and to develop specifically directed therapies (Denysenko et al., 2014).
Recently, there is increasing evidence that tumour bulk mass contain subpopulations of cells, such as glioma-initiating cells (GICs) and glioma stem cells (GSCs), which renders the so-called
novel strategies a old fashio ed procedure (Persano et al., 2011; Sampetrean et al., 2013). When it comes to the glioma cells of origin – their cellular origin that give rise to the initial tumour – continues to be a source of debate (Table 5) (Sampetrean et al., 2013; Dunn et al., 2012). There is reported that neural stem cells (NSCs) or oligodendrocyte precursor cells (OPCs) might be putative glioma cells of origin (Figure 5) (Sampetrean et al., 2013; Clarke et al., 2013).
Table 5 – Similarities and differences among GSCs, glioma cells of origin, and GICs.
16
At the moment, there is absent unequivocal biomarkers to well characterize this newly discovered type of cells – GICs – making it as a remaining working hypothesis to be adjusted and validated through further research. Hopefully, a better characterization of GICs, and through them the glioma cells of origin, will increase the understanding of the initial steps of gliomagenesis and could lead to early detection and even prevention of this intractable disease (Sampetrean et al., 2013).
Figure 5 – Possible cells of origin of glioma. Studies in mouse models have shown that various cell types can
give rise to glioma. Neural stem cells (NSCs) give rise to other Neural Stem Cells, Astrocytes, Astrocyte-like
cells, and neurons. It is demonstrated that NSCs give rise to OPCs, which can give rise to glioma (Liu et al.,
2011). Others shown that astrocytes and neurons can give rise to glioma (Marumoto, Singer, Ellisman, &
Verma, 2013). Also, astrocytes can give rise to glioma after platelet-derived growth factor (PDGF)
overexpression and lnk4a, and ARF deletion as said somewhere (Hambardzumyan, Cheng, Haeno, Holland, &
Michor, 2011). As well, overexpression of a mutagenic Sleeping Beauty (SB) transposon (T2/Onc2) along with
a dominant negative p53 in astrocyte like cells can give rise to glioma (Koso et al., 2012). Additionally, it is
reported that NSCs could give rise to glioma after Nf1, p53, and Pten deletion (Chen, McKay, & Parada, 2012).
Master of Pharmacy – Specialization in Applied Pharmacotherapy
17
The cellular microenvironment also plays a critical role in the regulation of cells in GBM. The heterogeneous cell populations do not only catch external signals from the environment but also respond to the latter in order to take advantage of it (Schonberg et al., 2013). Therefore, there is reported and well accepted the following tumour-associated parenchyma cells interact with GBM cells, controlling the course of the pathology (Goffart et al., 2013):
Involvement of Microglia;
Involvement of the Immune System;
Involvement of Neural Progenitors;
Involvement of the Vascular Niche.
For instance, GSCs often reside and thrive in perivascular and hypoxic (region of irregular blood flow that experience fluctuating abnormal hypoxic oxygen tension levels, ranging from less than 1-5%) niches (Figure 6), which are anatomical and functional locations.
Figure 6 – GSCs microenvironment. GSCs often reside and thrive in perivascular and hypoxic niches
where growth factors and cytokines promote their maintenance. In turn, GSCs up-regulate the
expression, activation and secretion of a number of niche-dependent signaling molecules and
transcription factors involved in pathways such as angiogenesis, proliferation, migration, hypoxia
response, etc. GSCs interact with other tumour cells and have the potential to differentiate into other
18
The morphological heterogeneity that prompted the original description of high-grade glioma as glioblastoma multiforme has also extended to the molecular level and these molecular alterations are extremely complex (Dunn et al., 2012). Based on genomic profiling of hundreds of human samples, four subtypes of GBM have been proposed and these subgroups might develop from different cells of origin (Clarke et al., 2013):
Proneural GBMs – altered expression of platelet-derived growth factor receptor, alpha polypeptide (PDGFRA); isocitrate dehydrogenase 1 (IDH1); tumour protein p53 (TP53) mutation; loss of heterozygosity (LOH) along with phosphatase and tensin homolog (PTEN) mutation; and cyclin-dependent kinase inhibitor 2A (CDKN2A) loss;
Mesenchymal GBMs – deletion of neurofibromin 1 (NF1), mutation of TP53 and
PTEN, and loss of CDKN2A;
Classical GBMs – typified by epidermal growth factor receptor (EGFR) amplification and lack of PTEN, and CDKN2A;
Neural GBMs – show a strong expression of neuron markers and genes associated with neuron projection and axon and synaptic transmissions.
Epigenetic alterations has been increasingly debated and studied in GBM. Some regulator agents on that matter are micro-ribonucleic acid– miRNA – approximately 21-nucleotides in length, single stranded endogenous non-coding RNAs (ncRNAs) that post-transcriptionally modulate gene expression and by that regulate a wide array of biological processes including differentiation, cell cycle, cell proliferation, apoptosis and angiogenesis; competitive endogenous RNAs – ceRNAs – control the amount of each miRNA species; long non-coding RNAs– lncRNAs – control global gene repression. Also, epigenetic enzymes, which are controlled by these RNAs, might play a critical role as GBM drivers (Clarke et al., 2013).
Network Analysis
Master of Pharmacy – Specialization in Applied Pharmacotherapy
19
On these networks there are edges, which are often called interactions, connections, or links. In terms of local topology, there can be described hubs, motifs and graphlets. A hub is a node having a much higher number of neighbours than average. Usually, hubs are attractive as drug targets. In the case of network motifs, they are circuits of 3 to 6 nodes in directed networks that are highly overrepresented as compared to randomized networks. Lastly, graphlets are similar to motifs but are defined as undirected networks (Csermely et al., 2013).
Recently, there was created a functional interaction (FI) network to study GBM by developing a human-curated map of the molecular pathways involved in GBM (Figure 7) (Wu et al., 2010).
Figure 7 – Overlay of predicted functional interactions onto a human curated GBM pathway. Many genes can
interact with multiple pathways genes. In this diagram, only genes interacting with one pathway gene are shown
to minimize diagram clutter. Newly added genes are colored in light blue, while original genes are colored in grey.
Newly added FIs are in blue, while original interactions are in other colors. FIs extracted from pathways are shown
as solid lines, while those predicted based on Naïve Bayes classifier (NBC) are shown as dashed lines. Extracted FIs
involved in activation, expression regulation, or catalysis are shown with an arrowhead on the end of the end of
20 PDK1 Structure & Pathway
The 3-phosphoinositide-dependent protein kinase-1 (PDK1) is a serine/threonine kinase, discovered over a decade ago. Its structure consists of an N-terminal kinase domain (amino acids 71-359) and a carboxyl-terminal (C-terminal) pleckstrin homology (PH) domain (amino acids 459-550), which binds PtdIns(3,4,5)P3 and PtdIns(3,4)P2 (Figure 8) (Nesi, 2011a).
Identification of the PH domain as a specialized lipid-binding module has been an important clue in understanding the mechanism by which membrane-bound lipids convey signals to the cytoplasm. Deletion of the PH domain prevents PDK1 recruitment to the plasma membrane and affects the activation and membrane localization of Akt. Binding of PDK1 to PtdIns(3,4,5)P3 induces a major conformational change that is likely required for the activation of substrates. However, PtdIns(3,4,5)P3 binding to the PH domain of PDK1 does not affect the activity of PDK1 directly (Nesi, 2011a).
Figure 8 – PDK1 feature view of Protein Data Bank (PDB) entries mapped to a UniProtKB sequence. Data in
greenoriginates from UniProtKB. Data in yellow originates from Pfam, by interacting with the HMMER3 web
site. Data in grey has been calculated using BioJava. Protein disorder predictions are based on JRONN, a Java
implementation of RONN: red – potentially disorderd region; blue – probably ordered region. Hydropathy has
been calculated using a sliding window of 15 residues and summing up scores from standard hydrophobicity
table: red – hydrophobic; blue – hydrophilic. Data in blue originates from PDB. Secstruct: Secondary structure
projected from representative PDB entries onto the UniProt sequence. Data in red indicates combined ranges
of Homology Models from SBKB and the Protein Models Portal. Reference: From Protein Data Bank (Rutgers,
Master of Pharmacy – Specialization in Applied Pharmacotherapy
21
PDK1 belongs to the protein kinase superfamily, AGC protein kinase family, PDPK1 subfamily, acting as a master upstream protein kinase, phosphorylating and activating a subgroup of the AGC family of protein kinases implicated in the control of cell growth, proliferation, survival and metabolism regulation (Nesi, 2011a; Sephton et al., 2009). The AGC group is named after three of its substituents: cyclic adenosine monophosphate (cAMP)-dependent (protein kinase A, PKA), cyclic guanosine monophosphate (cGMP)-dependent protein kinase (PKG) and protein kinase C (PKC). Members of this group preferentially phosphorylate serine/threonine residues close to arginine and lysine, the basic residues. Like all members of this family, the catalytic core of PDK1 possess (Figure 9) an amino-terminal (N-terminal) lobe that consists mainly of a β-sheet and a predominantly α-helical C-terminal lobe, whereas, unlike other AGC kinases, PDK1 possesses an HM pocket in the small lobe of its catalytic motif. The αC-helix (residues 124-136), located in the small lobe of the kinase domain, is a key regulatory domain because it links a substrate interacting site termed the hydrophobic motif (HM) pocket with Ser-241 in the activation loop. The HM pocket in the kinase domain of PDK1 has been termed the PIF pocket after the first discovery that the C terminus of PKC-related kinase-2, which contains an HM motif, interacts with the kinase domain of PDK1. Then, PDK1 interacting fragment (PIF) pocket act as a docking site, which enables the kinase to interact with some of its physiological substrates (Biondi et al., 2002; Feldman et al., 2005).
Phosphate-pocket
PIF-pocket
Ser-241
Small lobe
Large lobe
Figure 9 – Overview of the PDK1 structure. Generated by Jmol Java
22
Protein phosphorylation plays a key regulatory role in numerous facets of protein behaviour including localization, activity and intermolecular interactions and it is mediated by kinases and phosphatases. PDK1 show to be a constitutive active kinase that can use distinct mechanisms to phosphorylate different substrates within cells. Its targets include (Swiss-prot, 2013; Sephton et al., 2009):
Protein kinase B (PKB/AKT1, PKB/AKT2, PKB/AKT3);
p70 ribosomal protein S6 kinase beta-1 (RPS6KB1);
p90 ribosomal protein S6 kinase alpha-1 (RPS6KA1), p90 ribosomal protein S6 kinase alpha-2 (RPS6KA2) and p90 ribosomal protein S6 kinase alpha-3 (RPS6KA3);
cAMP-dependent protein kinase (PRKACA);
Protein kinase C delta type (PRKCD) and Protein kinase C zeta type (PRKCZ);
Serum/glucocorticoid-inducible kinase 1 (SGK1), serum/glucocorticoid-inducible kinase 2 (SGK2) and serum/glucocorticoid-inducible kinase 3 (SGK3);
p21-activated kinase-1 (PAK1);
Serine/threonine-protein kinase N1 (PKN1) and Serine/threonine-protein kinase N2 (PKN2).
In glioblastoma multiforme, PDK1 is directly or indirectly part of critical molecular pathways which regulate several growth factors and oncogenes (Krakstad et al., 2010; Mao et al., 2012):
Phosphtaidylionositol-3-kinase (PI3K)/PDK1/Akt pathway: one of the most critical and best characterized pathways in gliomas, being important in cell survival, migration and proliferation;
PI3K-mTOR crosstalk pathway: critical for proliferation and angiogenesis;
PTEN-Akt-mTOR signaling pathway: regulates normal cellular functions that can be crucial in tumorigenesis, including cellular proliferation, apoptosis, cell invasion, and mobility.
Master of Pharmacy – Specialization in Applied Pharmacotherapy
23 Treatment Options
In spite of the increased understanding of the complex processes underlying GBM development, this disease still has a dramatic prognosis that has not improved during the last two decades, therefore, a pathology with a clear fatal outcome for patients (Denysenko et al., 2014).
Standard treatment upon initial diagnosis of GBM consists of maximal surgical resection, radiotherapy, and concomitant and adjuvant chemotherapy with temozolomide (TMZ) (Fialho et al., 2012). In the case of patients older than 70 years less aggressive therapy is sometimes employed, through radiation or sole administration of temozolomide. For these patients, recent evidence suggests that temozolomide or hypofractional radiotherapy is associated with prolonged survival than treatment with standard fractioned radiotherapy. For patients over 60 years old, in turn, temozolomide therapy has been shown to lead to a longer survival than treatment with standard radiotherapy (Malmström et al., 2012).
Average time to recurrence after standard therapy is presently 6.9 months for GBM patients. For recurrent tumours, surgery is appropriate in selected patients, and various radiotherapeutic, chemotherapeutic, biologic, or experimental therapies are also employed (Stupp
et al., 2005; Chamberlain et al., n.d.).
24
The optimal chemotherapeutic regimen for GBM is not yet defined, however, there are some therapeutic options, even not being specific to treat GBM (Bruce et al., 2014a; Bruce et al., 2014b; Mao et al., 2012):
Temozolomide (Temodar): an oral alkylating and chemotherapeutic agent, first used to treat primary brain tumours in 1993. It alkylates or methylates DNA, causing cancer cells to die. O-6-methylguanine-DNA methyltransferase (MGMT) or O-6-alkylguanine-DNA alkyltransferase can diminish the effect of TMZ by repairing the DNA damage. Also, TMZ has been combined with other inhibitors, in many phase I and II clinical trials, such as EGFR inhibitor, erlotinib, and radiotherapy and shown improvement on patient survival;
Carmustine (BiCNU): Alkylates and cross-links DNA strands, inhibiting cell proliferation;
Cisplatin (Platinol): DNA damaging agent (DNA crosslinks and denaturation of double helix), inhibits protein synthesis and, thus, cell proliferation.
Erlotinib (Tarceva): a human epidermal growth factor receptor type1/epidermal growth factor receptor (HER1/EGFR) tyrosine kinase inhibitor. EGFRs are overexpressed in multiple GBM cases and play a significant role in regulating other intracellular significant pathways that contribute to GBM pathogenesis, including mTOR/PI3K/Akt and Rat Sarcoma/mitogen-activated protein kinase (RAS/MAPK).
Gefitinib (Iressa): An aniliniquinazoline, which mechanism is not fully understood, but seems to inhibit tyrosine kinase intracellular phosphorylation associated with transmembrane cell surface receptors.
Master of Pharmacy – Specialization in Applied Pharmacotherapy
25 Therapeutic Challenges
In glioblastoma multiforme drug discovery, one of the biggest challenges is defining the cellular origin of GBM since it is difficult to develop a successful GBM treatment without first uncovering the responsible cell or cells types to eliminate, having in mind the complex heterogeneity of this specific cancer type (Clarke et al., 2013). Nevertheless, the tumour location in a region where it is beyond the reach of local control, and rapid, aggressive tumour relapse are further challenges related to tumour aspects to overcome. Other factors that frustrate therapeutic interventions are the physiologic barriers (blood brain barrier, blood-cerebrospinal fluid barrier and blood-tumour barrier), mechanisms of transport (for example, efflux) and physicochemical factors (for instance, log octanol-water partition coefficient (logPo/w), permeability-surface area product
(PS) or permeability coefficient (PC)) (Misra et al., 2003). As well as, identifying epigenetic targets for GBM treatment and subsequently develop therapeutic strategies against GBM are further steps to overcome.
26
Aims of the Study
This MSc study assume in Portugal the vanguard on the area of Quantitative & Systems Pharmacology applied to glioblastoma multiforme drug discovery & development.
The main goal of the work is evaluate the induced drug perturbation in glioblastoma cancer cells through in vitro assays by performing a multiparametric characterization of the PDK1 inhibitors dose-response. Specifically it means:
Grow the U-87 MG Human Cell Line representative of the human glioblastoma multiforme;
Perform the cellular growth profile;
Parameterising multiparamentric perturbagen dose-response relationships for two newly synthetised PDK1 inhibitors (G51 and FC100).
Master of Pharmacy – Specialization in Applied Pharmacotherapy
27
Materials & Methods
In this study, the effects of two PDK1 inhibitors were parameterised in a multiparametric dose-response relationship way on U-87MG Human glioblastoma astrocytoma cell line by fitting pharmacologic experimental methods to dedicated models. The detailed experimental procedures will be described on this section.
Reagents
Table 6 – List of the reagents used along the study.
Reagent Supplier
Aseptic Technique and Good Cell Culture Practice
70% Ethanol Prepared on the laboratory
70% Isopropanol Prepared on the laboratory
Sodium Hypochlorite Random
Preparation of Sample Solutions
Phosphate Buffered Saline (PBS) powder, pH 7.4 in 1L sterile water
Powder from Sigma-Aldrich Chemical S.L., Sintra, Portugal; Solution prepared on the
laboratory
Dimethyl Sulfoxide (DMSO) Sigma-Aldrich Chemical S.L., Sintra, Portugal Cell Culture
Dul e o s Modified Eagle s Mediu – high glucose with 4500 mg/L glucose and L-glutamine, without sodium bicarbonate,
powder
Sigma-Aldrich Chemical S.L., Sintra, Portugal
Penicillin-Streptomycin, liquid Invitrogen, Barcelona, Spain Fetal Bovine Serum (FBS) Invitrogen, Barcelona, Spain
28 Phosphate Buffered Saline (PBS) powder, pH
7.4 in 1L sterile water Sigma-Aldrich Chemical S.L., Sintra, Portugal Trypsin-EDTA Solution Sigma-Aldrich Chemical S.L., Sintra, Portugal Trypan Blue Solution Sigma-Aldrich Chemical S.L., Sintra, Portugal
Sulforhodamine B (SRB) Colorimetric Assay
Phosphate Buffered Saline (PBS) powder, pH 7.4 in 1L sterile water
Powder from Sigma-Aldrich Chemical S.L., Sintra, Portugal; Solution prepared on the
laboratory
Methanol (MeOH) Sigma-Aldrich Chemical S.L., Sintra, Portugal Sulforhodamine B Sigma-Aldrich Chemical S.L., Sintra, Portugal
Acetic acid José M. Vaz Pereira, Lisboa, Portugal Tris(hydroxymethyl)aminomethane or Tris National Diagnostic, Hessle Hull, United
Kingdom Cell Lysis and Protein Extraction
Dithiothreitol (DTT) Bio-Rad Laboratories, Amadora, Portugal Glycerol Sigma-Aldrich Chemical S.L., Sintra, Portugal
4-(2-Hydroxyethyl)piperazine-1-ethanesulfonic acid (HEPES) Sigma-Aldrich Chemical S.L., Sintra, Portugal Magnesium chloride (MgCl2) Sigma-Aldrich Chemical S.L., Sintra, Portugal
Sodium chloride (NaCl) Sigma-Aldrich Chemical S.L., Sintra, Portugal Phenylmethanesulfonyl fluoride solution
(PMSF) Sigma-Aldrich Chemical S.L., Sintra, Portugal
Pepstatin A AppliChem, Germany
Master of Pharmacy – Specialization in Applied Pharmacotherapy
29
Equipment
Table 7 – List of the equipment used along the study.
Equipment Supplier
Aseptic Technique and Good Cell Culture Practice
Personal protective equipment (sterile gloves,
laboratory coat, safety visor, others) Various
Microbiological Safety Cabinet class II
Biowizard (BW)-100 Kojair Tech Oy, Vilppula, Finland Preparation of Sample Solutions
Vortex, IKA, MS2 Minishaker Deutschland, Germany Falcon 15 mL tubes Orange Scientific, Braine-l Alleud, Belgiu
Filter Frilabo, Maia, Portugal
Syringe Terumo Medical Corporation, Canada
Cell Culture
Microbiological Safety Cabinet class II
Biowizard (BW)-100 Kojair Tech Oy, Vilppula, Finland
MCO-19A Incubator Sanyo Electric Co. Ltd., Japan
NE1B-14 Water bath Clifton, England
Olympus CKX41 Microscope with an Olympus
DP20-5E Digital Olympus Optical Co. Ltd., Japan
MPW-350R Centrifuge MPW Medical Instruments, Poland
Plates, Flasks, Eppendorfs & Falcon tubes Orange Scientific, Braine-l Alleud, Belgiu Sulforhodamine B (SRB) Colorimetric Assay
Plates Orange Scientific, Braine-l Alleud, Belgiu Bio-Tek µQuant MQX200
Spectrophotometer UV-VIS (Gen5 software)
30
Compounds & Stock Solutions
The new PDK1 inhibitors used in this project (Table 8 and 9) – G51 and FC100 – were synthesised and kindly provided upon collaboration with Dr. Simona Rapposelli from the Department of Pharmacy of the University of Pisa, Italy.
Table 8 – Physicochemical properties of G51 compound.
MW – Molecular weight; MF – Molecular formula. Purity clogP Drug like properties Melting point MW MF
169-171 459.50
g.mol-1 C25H25N5O4
Structure G51
± 0.4 % 0.8 -4.88
Table 9 – Physicochemical properties of FC100 compound.
MW – Molecular weight; MF – Molecular formula. Purity clogP Drug like properties Melting point MW MF
C13H12N4O3S FC100
Structure
Master of Pharmacy – Specialization in Applied Pharmacotherapy
31
Two different stock solutions of these inhibitor were prepared and it can be visualized on the Figure 10.
Figure 10 – Schematic representation of compound solutions preparation. Stock solutions 1 of PDK1
inhibitors were made by dissolving each compound in 100% DMSO followed by sterile-filtration, and then,
dilution with PBS, obtaining the stock solutions 2. Further dilutions were made from stock solutions 2 with
PBS to obtain the required concentrations – ranging from 25 µM to 400 µM – in eppendorfs. Remaining stock
solutions 2 were stored at 4°C. Additional dilutions were made in complete cell culture medium to obtain the
32
Cell Culture
The U-87 MG human glioblastoma astrocytoma cell line was kindly offered by Professor Conceição Pedroso de Lima, from the Center for Neuroscience and Cell Biology of the University of Coimbra, Portugal. The cells were at the passage number 28, mycoplasma free and frozen on 28.10.2013.
Resuscitation of Frozen Cell Lines
In order to maintain the viability of the cell culture and enable it to recover more quickly, it is vital to thaw cells correctly. Since some cryoprotectants, such as DMSO, are toxic above 4 °C, the cells were thawed quickly and diluted in culture medium to minimise the toxic effects. Followed by centrifugation (to remove the cryoprotectant), the supernatant was removed and the cells were re-suspended in growth medium. Then, they were transferred to a 75 cm2 flask and incubated at 37
°C, 5% carbon dioxide (CO2). Cells were examined microscopically (phase contrast) after 24 hours
and the medium replaced.
Cell Morphology & Cell Culture Conditions
The U-87 MG cells have an epithelial-like morphology (Figure 11), therefore growing in adherent mode.
Figure 11 – U-87 MG cell line human glioblastoma
Master of Pharmacy – Specialization in Applied Pharmacotherapy
33
Cells were seeded at a 1.5 x 10⁵ cells/mL (density) in 75 cm2, 150 cm2 or 175 cm2 culture
flasks a d the e e ai tai ed i Dul e o s odified Eagle s ediu DMEM o tai i g . g/L
glucose supplemented with 10% heat-inactivated fetal bovine serum (FBS), 100 U/mol penicillin and 100 µg/mL streptomycin. They were grown at 37 °C under humidified atmosphere containing 5% CO2.
Subculture of Adherent Cell Lines
U-87 MG cells were splitted when sub-confluent (70-80 %) as recommended on the cell line data sheet from Sigma-Aldrich. Cells were brought into suspension by using tripsinisation. Upon centrifugation at 1100 for 5 minutes, cells were counted in a haemocytometer, using the Trypan blue colorimetric exclusion assay and then seeded at 1.5 x 10⁵ cells/mL density.
Cell Quantification
For the majority of manipulations using cell cultures, for example cryopreservation and subculture routines, it is necessary to quantify the number of cells prior to use. Also, by doing that, cells maintain optimum growth, as well as, it helps to standardise procedures using cell cultures. This in turn gives results with better reproducibility (ECACC, 2013).
When required, cell quantification was performed after harvesting cells by tripsinisation as described above. Cells were re-suspended in a required volume of fresh culture medium and 20 µL were placed on an eppendorf with the same amount of Trypan blue dye (dilution factor 2). This cell suspension was then placed onto a haemocytometer chamber. Cell count was the following step (Figure 12) and the calculation of cell density was achieved by following the equation (ECACC, 2013):
34
Cell Proliferation Studies & Doubling Time Analysis
In order to obtain the cellular growth profile of the U-87 MG cell line, cell proliferation studies (increase in the number of cells as a result of growth and division) and doubling time analysis (DTA) were performed. For the latter, the population doubling time (PDT) was also assessed and it can be defined as the time interval, calculated during the logarithmic phase of growth in which cells double in number. PDT can be determined by direct cell counting using a haemocytometer. It is important to have in mind that with each subculture the population doubling increases in relationship to the slip ratio at which the cells are plated (ATCC, 2012).
For these studies, cells were plated onto 6-well plates in triplicate at a density of 2.5 x 10⁴
cells/mL in DMEM. After 6, 24, 48, 72, 96, 120 and 144 hours, cells were collected after typsinization and counted using the following formula = h x ln(2)/ ln(c2/c1) for DTA, here c is the number of cells
at each time of collection and ln is a neperian logarithm (Roth V. 2006 http://www.doubling-time.com/compute.php). Cell proliferation graph was performed on Excel 2013 © Microsoft Corporation.
Figure 12 – Schematic representation of