Use of signal thresholds to determine significant changes
in microarray data analyses
Xinmin Li
1, Jaejung Kim
1, Jian Zhou
1, Weikuan Gu
3and Richard Quigg
1,2 1The University of Chicago, Functional Genomics Facility, Chicago, IL, USA.
2
The University of Chicago, Division of Biological Sciences, Section of Nephrology, Chicago, IL, USA.
3
University of Tennessee Health Science Center, Department of Orthopedic Surgery, Center of Genomics
and Bioinformatics & Center of Diseases of Connective Tissues, Memphis, TN, USA.
Abstract
The use of a constant fold-change to determine significant changes in gene expression has been widely accepted for its intuition and ease of use in microarray data analysis, but this concept has been increasingly criticized because it does not reflect signal intensity and can result in a substantial number of false positives and false negatives. To resolve this dilemma, we have analyzed 65 replicate Affymetrix chip-chip comparisons and determined a series of user adjustable signal-dependent thresholds which do not require replicates and offer a 95% confidence interval. Quantitative RT-PCR shows that such thresholds significantly improve the power to discriminate biological changes in mRNA from noise and reduce false calls compared to the traditional two-fold threshold. The user-friendly nature of this approach means that it can be easily applied by any user of microarray analysis, even those without any specialized knowledge of computational techniques or statistics. Noise is a function of signal intensity not only for Affymetrix data but also for cDNA array data, analysis of which may also be benefited by our methodology.
Key words:microarray, signal threshold, affymetrix, data analysis.
Received: June 26, 2003; Accepted: October 14, 2004.
Introduction
Affymetrix oligonucleotide arrays (Lockhart et al., 1996) are widely used for measuring global changes in gene expression (Landis et al., 2004; Zamurovic et al., 2004; Baechleret al., 2004; Hunteret al., 2002). While the power of this technology has been recognized, how thresh-olds for significant changes should be determined remains an open question.
To date, fold-change thresholds have been the most commonly used method for filtering false positives and de-claring significant changes (Bassettet al., 1999; Deret al., 1998; Fambroughet al., 1999; Wanget al., 1999). Because this is an arbitrary decision and has no statistical basis, dif-ferent thresholds have been used in the literature, varying from 2- to 6-fold (Amundson et al., 1999; Coller et al., 2000; Schenaet al., 1996; Tamayoet al., 1999). Although this approach is intuitively appealing, it does not take into account absolute signal intensities and ignores the fact that the confidence levels of fold-change appear to be
sig-nal-dependent. Such constant thresholds tend to produce false positives when signal intensities are low and false negatives when signal intensities are high.
Several statistical treatments of microarray data anal-ysis have been explored to overcome these weaknesses, (Chenet al., 1997; Kerret al., 2000; Newtonet al., 2001; Tusheret al., 2001; Li and Wong, 2001, Longet al., 2001, Goryachev et al., 2001; Strand et al., 2002). Locally weighted linear regression (Lowess) (Cleveland and Devlin 1988) has been proposed as a normalization method for microarray data analysis (Yanget al., 2002; Dudoitet al., 2002) to remove intensity-dependent dye-specific effects. Hugheset al(2000) proposed a mathematical model to esti-mate intensity-dependent differential expression, which can identify biologically meaningful differential regulation at levels lower than twofold in a compendium of 300 differ-ent yeast mutants and chemical treatmdiffer-ents. Use of a smoothed estimate of the SD as a function of the fluores-cence intensity has also been discussed (Baggerlyet al., 2001). These treatments are responsive to signal intensity and provide a better discrimination of true change from noise but suffer from a common drawback in that they re-quire that the researcher who uses them has both statistical and computational training. To address this problem, a
rela-www.sbg.org.br
Send correspondence to Xinmin Li. The University of Chicago, Divi-sion of Biological Sciences, The Functional Genomics Facility, 5841 S. Maryland Ave., 60637 Chicago, IL USA. E-mail: [email protected].
tively simpler approach has been proposed to identify dif-ferentially expressed genes using the intensity-dependent calculation of a standard Z-score (Yanget al., 2003).
Because traditional fold-change thresholds (tradi-tional thresholds) are popular but have limitations we theo-rized that signal-dependent fold-change thresholds (signal thresholds) could be used because signal thresholds take into account the fact that fold-change variability is a func-tion of signal intensity. In this paper we report the use of multiple replicate comparisons to establish and validate user-adjustable signal thresholds which have improved power to discriminate true change from noise without the drawbacks of traditional thresholds.
Materials and Methods
Sources of data
All data were generated by the Functional Genomics Facility (FGF), University of Chicago, Illinois, USA. Sixty-five duplicate chip-chip comparison data sets were derived from 14 experiments, performed over a period of 11 months, using Human Genome U133A and U95A, Rat Genome U34A and Murine Genome U74Av2 arrays. Thirty-three comparisons were biological replicates in which RNA was extracted from different samples that were genetically identical and exposed to the same manipula-tion; 16 were technical replicates in which the same RNA source was used for replicate experiments; and 16 were cell line replicates in which RNA was extracted from different batches of daughter cells.
RNA quality assurance
All RNA samples submitted to the FGF for hybridiza-tion had a 260nm/280 nm optical density ratio (OD260/280) > 1.8 and a total RNA concentration > 1µg/µL
and the quality of the RNA was validated using an Agilent 2100 Bioanalyzer (Agilent Technologies, Palo Alto, CA, USA).
Target preparation
The target preparation protocol followed the Affymetrix GeneChip® Expression Analysis Manual (Affymetrix, Inc. Santa Clara, CA) with minor modifica-tions. Briefly, 10µg of total RNA was used to synthesize double-stranded cDNA using the Superscript Choice Sys-tem (Life Technologies). First strand cDNA synthesis was primed with a T7-(dT24) oligonucleotide. From 3 µg of
log-phase Gel-purified cDNA, biotin-labeled antisense cRNA was synthesized using the BioArray High Yield RNA Transcript Labeling Kit (Enzo Diagnostics, Farmingdale, NY, USA). After precipitation with 4 M Lith-ium Chloride, 20µg of cRNA was fragmented in fragmen-tation buffer (40 mM Tris-Acetate, pH 8.1, 100 mM KOAc, 30 mM MgOAc) for 35 minutes at 94 °C and then hybrid-ized to Affymetrix Arrays for 16 hours at 45 °C and 60 rpm
in an Affymetrix Hybridization Oven 640. The arrays were washed and stained with streptavidin phycoerythrin in Affymetrix Fluidics Station 400 using the Affymetrix GeneChip protocol and then scanned using the Affymetrix Agilent GeneArray Scanner.
Data analysis and definitions
Hybridization signals were analyzed using Affymetrix Microarray Suite version 5.0 (MAS 5.0) with the default analytic parameters (Alpha 1: 0.04; Alpha 2: 0.06; Tau: 0.015; global scaling target signal: 500). The qualitative output of MAS 5.0 includes detection calls and change calls, the confidence of each call being reflected by a p value which is a new feature of MAS 5. Quantitative output includes signal intensities from absolute analyses and signal log2ratios (SLRs) from comparison analyses.
Data analysis in this study involved three stages: visual ex-amination of the scatter plot using MAS 5.0 software, two-step data filtration (see results section for details) and empirically determining signal thresholds. For each repli-cate comparison (after data filtration), genes were divided into six groups based on the average signal intensity of two replicates (see results for grouping criteria) and then a 95% confidence threshold (α) was determined based on all SLRs within each group, 95% of SLRs of a given signal intensity group being encompassed withinα. The signal thresh-old was the average value ofαderived from 65 replicate comparisons. This study established six signal thresholds, one for each signal intensity group. There were sixαvalues for each replicate comparison,i.e.one for each signal inten-sity group. The interarray variability (β) is a measure of sig-nal intensity variation between the two replicate samples being compared, whereβ=Σ[Ai-Bi/(Ai+Bi)]/n where Ai
is the signal intensity of the ithgene in replicate A, Biis the
signal intensity of the ithgene in replicate B and n is the total number of genes on the GeneChip® array. Experimental variation between replicate experiments was defined as the interarray variability (β), which was used to predict the weighted average threshold (δ), the weighted average value of all sixαvalues from a replicate comparison. This study used 65 replicate comparisons and therefore 65δwere de-rived. As an alternative approach for data visualization (Dudoitet al., 2002), a standardM vs. Aplot was derived, in whichMg= log2(Yg/Xg) andAg= log2(XgYg)1/2for
expres-sionsXgandYgfrom the two arrays being compared for all
genesg= 1, 2, 3, ...,G.
Results
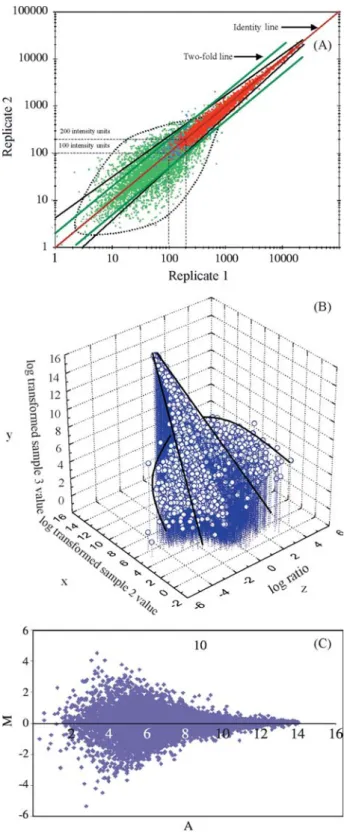
Visualization of signal intensity scatter plot
repre-sents noise. Visually examination of these plots provided important information for developing the subsequent data analysis strategy. Firstly, the scatter plot clearly showed (Figure 1A) that the degree of signal variation was a func-tion of the signal intensity, with the variafunc-tion increasing as the signal intensities decreased. This fundamental relation-ship was also seen in 3-D plots where the third dimension was the SLR (Figure 1B) and also in MvA plots (Figure 1C). These observations illustrate the practical difficulty in using a constant fold-change threshold for all genes under study and suggests that thresholds for significant change should vary in accordance with the signal intensity, the premise which formed the basis for the current study.
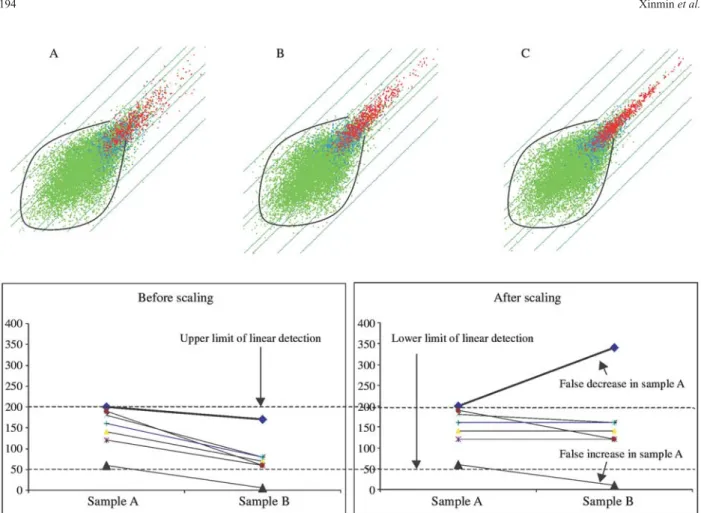
Secondly, genes with low signal intensities and ab-sent calls (green dots in the plot) had an elliptical variation pattern which did not obey the linear functional relation-ship described above. Figure 2 shows plots of two replicate experiments using three potential sources of variation: the RNA derived from different mice (A); using the same RNA sample but with separate enzymatic reactions (B); and us-ing the same hybridization master mix (C). It is clear that the degree of variation increases as the number of potential sources of variation increase (A > B > C) for genes with present calls but the variation seems constant for genes with absent calls (elliptical variation,i.e.elliptical noise). About 50% of genes have absent calls and account for most of the false positives. This observation highlights the need to filter out this constant noise before performing data analysis.
Thirdly, scatter plots provides a convenient way to evaluate the non-random noise contributed by scaling it-self. The relationship between the level of gene expression and signal intensity reported by a scanner is linear only within a certain range of intensities, being limited by detec-tion sensitivity below and subject to saturadetec-tion above that range. When the overall signal intensity in sample A is sig-nificantly higher than that in sample B (i.e.the scaling fac-tor is higher in sample B than in sample A), scaling itself could introduce false increases in the low non-linear range and false decreases in the high non-linear range in a com-parison of Avs.B (Figure 2). We plotted all chip-chip com-parisons and scatter plots with a characteristic sigmoidal shape (about 2% of the plots examined) were eliminated from the analysis.
Data filtration
After visualization of scatter plots, it was clear that raw data needed to be filtered to avoid excessive noise at the low signal intensity range. We used a two-step filtration strategy to balance the removal of noise with the retention of the true biological information. The first filtration step was to filter genes with a signal intensity in both replicate experiments of≤100 intensity units, a rather conservative but effective strategy which resulted in the vast majority of elliptical noise being eliminated at this cut-off intensity (Figure 1A). The second filtration step was to remove the
genes with a signal intensity≤200 and also having an ab-sent call in both replicate experiments. About 50% of genes were eliminated by this two-step filtration strategy. The re-maining genes were used to determine signal thresholds.
Signal thresholds with 95% confidence
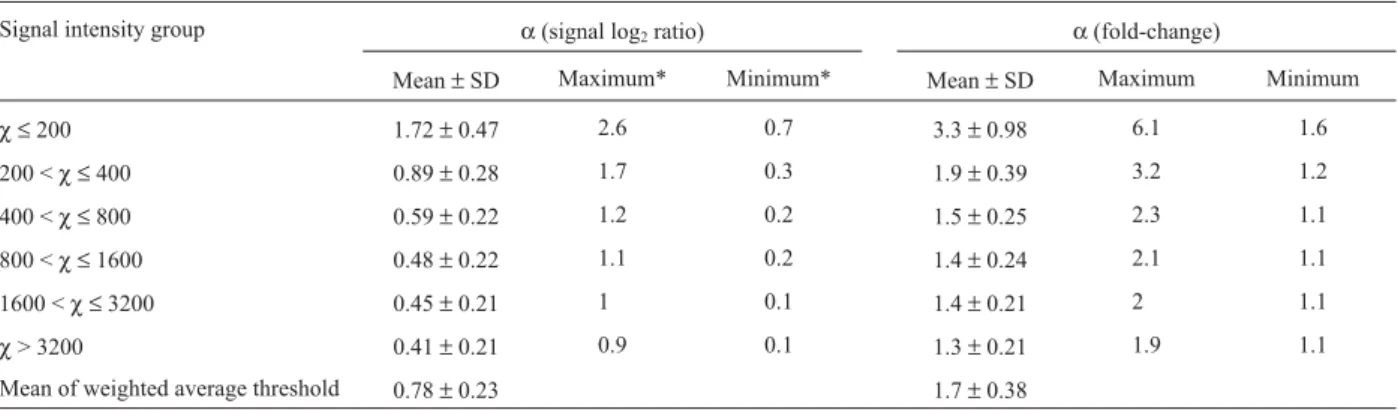
After data filtration, average signal intensities were calculated for each gene in each pair of comparisons and sorted in ascending order. The genes were then divided into the following six groups based on average signal intensi-ties:χ ≤200, 200 <χ ≤400, 400 <χ ≤800, 800 <χ ≤1600, 1600 <χ ≤3200, andχ> 3200. A 95% confidence threshold (α) for each of the 6 groups was determined for each repli-cate comparison as illustrated in Figure 3. The average value of allαvalues from 65 replicate comparisons in a par-ticular intensity group represents the signal threshold for that group (Table 1). For example, when signal intensity is
≤200 the magnitude of change should be a≥SLR of 1.72 (3.3-fold) in order to declare that it represents a significant
change with 95% confidence, while a significant change can be declared at a SLR of > 0.41 (1.3-fold) when the sig-nal intensity is > 3600. Table 1 also shows a considerable degree of variability in the 95% confidence threshold over 65 replicate comparisons as indicated by the difference be-tween the maximum and minimum threshold values as well as by the standard deviation. This variation motivated us to explore how these signal thresholds could be adjusted using specific experimental variation.
Signal thresholds are user-adjustable
We used the interarray variability,β, to measure sig-nal intensity variation between two replicate samples and weighted average threshold,δ, to reflect variability at the SLR level. As shown in Figure 4,βwas linearly correlated withδ, the correlation being so good thatδcan be predicted for a particular comparison from the formulaδ= 6.6157β– 0.4325, whereβcan be determined from the signal inten-sity of two replicate samples (hence, experimental variation
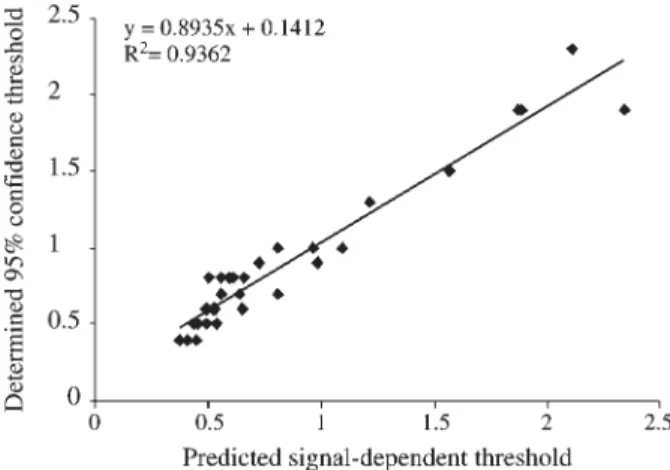
is directly related to the 95% confidence thresholds). The ratio of predictedδvalues from a particular replicate com-parison versus the mean weighted average threshold (0.78, calculated from 65 weighted average thresholds) can be used to convert the signal thresholds established in this study (1.72, 0.89, 0.59, 0.48, 0.45, 0.41) to a new set of sig-nal-dependent thresholds (1.72*δ/0.78, 0.89*δ/0.78, 0.59*δ/0.78, 0.48*δ/0.78, 0.45*δ/0.78, 0.41*δ/0.78), whereδis derived from the formula above. These converted signal-dependent thresholds reflect the experimental varia-tion of that particular comparison. We validated this conver-sion strategy using 5 new replicate comparisons with different experimental variability. There was no significant difference between the predicted and practically determined thresholds for each of five comparisons. A plot of deter-mined against predicted thresholds for all 5 comparisons showed a correlation coefficient of 0.94 (Figure 5).
The interarray variability in this study was derived from replicate experiments and thus represents only experi-mental noise, while in a typical experiment comparing
con-trol and experimental treatments interarray variability in-cludes both experimental noise and expected biological variation. There is a potential complication when the signal thresholds derived from replicate experiments are used to predict the expected signal thresholds for a biological com-parison. We evaluated this potential complication by ana-lyzing a set of real experimental data which included 7 biological samples each with two replicates. We compared interarray variability derived from replicate samples with those derived between biological samples and our results showed that the biological sample-derived interarray vari-ability is on average 2.7% greater than the replicate sam-ple-derived interarray variability. This suggests that the interarray variability mainly consists of experimental noise and that a small number of genes with biological changes in a typical experiment have only a limited effect (about 2.7% increase) on the magnitude of the interarray variability. This small effect could slightly increase the confidence
in-Figure 3- Illustration of how the 95% confidence threshold (α) is deter-mined. Signal intensity group of 400 < x≤800 in one representative chip-chip comparison was used for demonstration, in whichαwas defined as encompassing 95% of the signal log2ratios (SLR).
Table 1- Signal thresholds with 95% confidence. The thresholds listed represent absolute values,e.g.a threshold of 1.72 represents1.72.
Signal intensity group α(signal log2ratio) α(fold-change)
Mean±SD Maximum* Minimum* Mean±SD Maximum Minimum
χ ≤200 1.72±0.47 2.6 0.7 3.3±0.98 6.1 1.6
200 <χ ≤400 0.89±0.28 1.7 0.3 1.9±0.39 3.2 1.2
400 <χ ≤800 0.59±0.22 1.2 0.2 1.5±0.25 2.3 1.1
800 <χ ≤1600 0.48±0.22 1.1 0.2 1.4±0.24 2.1 1.1
1600 <χ ≤3200 0.45±0.21 1 0.1 1.4±0.21 2 1.1
χ> 3200 0.41±0.21 0.9 0.1 1.3±0.21 1.9 1.1
Mean of weighted average threshold 0.78±0.23 1.7±0.38
*Maximum/minimum threshold at that signal intensity in a group of 65 comparisons.
terval of adjusted signal thresholds ( 95%) and further re-duce false discovery rates.
Validation of signal thresholds in predicting changes using real-time PCR
To test the validity of the signal thresholds, we de-signed two independent RT-PCR experiments. The first ex-periment was to assess whether or not the signal thresholds can identify small biological changes at the high signal in-tensity range that traditional thresholds fail to detect. Eleven genes were selected that were known to have changed significantly in respect to their signal threshold but not by the traditional 2-fold change. The RT-PCR method showed that 10 out of the 11 genes were up-regulated 50% or more relative to the controls (Table 2). The second ex-periment involved 15 genes randomly selected from an
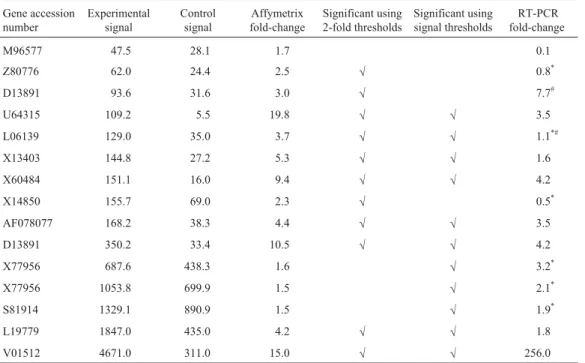
Affymetrix microarray experiment that were independently evaluated by RT-PCR. Use of our signal threshold pro-duced a false positive rate of 9% and a false negative rate of 7%, while the use of a 2-fold change threshold would have produced a false positive rate of 27% and a false negative rate of 20% (Table 3). The RNA samples used in both RT-PCR experiments were the same as those used for the compared microarray experiments.
Discussion
Traditional fold-change thresholds are currently in common use in microarray data analysis for at least four reasons: 1) researchers are used to the concept that fold-change defines fold-change; 2) the traditional thresholds are in-tuitive and easy to use; 3) many of the statistical approaches available require substantial statistical knowledge and computational ability; and 4) the majority of microarray ex-periments have no replicates, which is a practical limitation to the use of replicate-based statistical strategies (Longet al., 2001; Tusheret al., 2001).The use of traditional thresh-olds to determine significant changes in transcriptional quantities has three limitations: 1) the decisions made are arbitrary and without a statistical basis; 2) traditional thresholds do not reflect signal intensity, which carries im-portant information about signal variability; and 3) tradi-tional thresholds are particularly vulnerable to artifacts produced by global scaling. These factors led us to develop a novel threshold strategy which, like traditional thresh-olds, could easily be applied by the microarray community but has a significantly improved predictive power com-bined with a certain level of statistical assurance incorpo-rating more sophisticated data treatment approaches. The signal-dependent fold-change thresholds reported in this paper offer such features since they are responsive to signal intensity, adjustable to specific experimental variation, carry 95% confidence levels and are user-friendly in that
Figure 5- Scatter plot of experimentally determined 95% confidence thresholds with predicted signal-dependent thresholds using the formulae: δ = 6.6157*β – 0.4325 and (1.72*δ/0.78, 0.89*δ/0.78, 0.59*δ/0.78, 0.48*δ/0.78, 0.45*δ/0.78, 0.41*δ/0.78). Five new replicate comparisons (not used for establishing the signal-dependent thresholds described in this paper) are included in this plot. There are 30 data points because each comparison has six thresholds.
Table 2- Validation of significant changes identified by signal thresholds. All genes have no significant changes using a two-fold threshold but have significant changes by using signal thresholds. Ten out of the eleven genes have≥1.5 fold-change by quantitative RT-PCR.
Gene accession number Experimental signal Control signal Affy fold-change RT-PCR fold-change
AA929330 1776 1241 1.5 1.5
D86725 1844 1279 1.7 2.9
K02927 1865 1275 1.4 1.9
AA840409 1874 1223 1.4 1.7
AW045261 1919 1233 1.5 1.1
M14223 2133 1380 1.4 1.9
D88792 2551 1522 1.5 1.6
AW123697 3095 2177 1.5 2.1
AF036008 3235 2844 1.5 2.1
D26090 3555 3837 1.4 2.0
they do not require advanced statistical knowledge or ex-tensive computational ability.
Our strategy to establish these empirical thresholds involved three steps: visual examination of scatter plots, data filtration and the determination of 95% confidence in-tervals for each of the signal intensity groups. We consider visualization of scatter plots as a critical starting point for any microarray data analysis, and our visual analysis showed three important observations: 1) variation as a function of signal intensity is a general phenomenon re-gardless of the type of chips, tissue type, or species used, this universal linear functional relationship providing the rationale for establishing signal thresholds; 2) genes with low signal intensity and absent calls have a constant varia-tion pattern across different experimental designs, suggest-ing that this unusual eliptical variation is governed by a specific factor independent of biological, technical and chip-to-chip variability. This invariable variation seems be-yond experimental control and is most likely caused by the perfect match- mismatch probe pair subtraction procedure (this variation pattern was not seen when either perfect match intensity or mismatch intensity was used for data analysis). Identification of this constant noise provided a foundation for developing a data filtration strategy; 3) global scaling can introduce false positives when two sam-ples have substantially different signal intensities. This im-portant source of variation was largely ignored until Mills and Gordon (2001) demonstrated it hypothetically. Scaling-induced false positives at the high non-linear range
are particularly problematic because experimental variation between experiments at the high intensity range is significantly smaller. A small deviation from the identity line could be treated as a significant change when using sig-nal thresholds, which is why the comparisons with obvious scaling-induced sigmoidal curves were eliminated from this study. When users apply the empirical thresholds re-ported in this paper it is important to make sure of the ab-sence of a sigmoidal curve in the chip-chip comparisons. Otherwise, interpretation of changes at the two extreme in-tensity ranges must be made with caution.
We adopted a two-step data filtration strategy, which was designed to maximize the capacity of eliminating noise and minimize the possibility of excluding biological infor-mation. The rationale for choosing 100 as the first-step cut-off intensity was based on our observation that the final concentration of spike control BioB in the hybridization mix is 1.5 pM, which is equivalent to 1-3 RNA molecules per cell, but the signal intensity of BioB is normally above 100 when the global scaling target signal is set as 500 (Affymetrix Microarray Suit default setting). Thus, the sig-nal intensity of BioB can be used as a guideline to deter-mine the lower limit of intensity which still carries biological information. Furthermore, over 99% of the genes with a signal intensity of≤100 are called absent by MAS 5. The second filtration step considered both signal intensities of between 100 and 200 and an absent detection call. Since the MAS 5 has independent algorithms to calcu-late signal intensities and absent detection calls their use as
Table 3- Comparison between the traditional 2-fold threshold and signal thresholds.
Gene accession number
Experimental signal
Control signal
Affymetrix fold-change
Significant using 2-fold thresholds
Significant using signal thresholds
RT-PCR fold-change
M96577 47.5 28.1 1.7 0.1
Z80776 62.0 24.4 2.5 √ 0.8*
D13891 93.6 31.6 3.0 √ 7.7#
U64315 109.2 5.5 19.8 √ √ 3.5
L06139 129.0 35.0 3.7 √ √ 1.1*#
X13403 144.8 27.2 5.3 √ √ 1.6
X60484 151.1 16.0 9.4 √ √ 4.2
X14850 155.7 69.0 2.3 √ 0.5*
AF078077 168.2 38.3 4.4 √ √ 3.5
D13891 350.2 33.4 10.5 √ √ 4.2
X77956 687.6 438.3 1.6 √ 3.2*
X77956 1053.8 699.9 1.5 √ 2.1*
S81914 1329.1 890.9 1.5 √ 1.9*
L19779 1847.0 435.0 4.2 √ √ 1.8
V01512 4671.0 311.0 15.0 √ √ 256.0
filters enhance the power of MAS 5 to distinguish noise from real biological variation. We believe that the direct use of a relatively high cutoff signal intensity (Grundschoberet al., 2002; Sreekumaret al., 2002) to filter data may sacrifice biological information. By surveying 11 independent experiments involving different human, mouse and rat tissue, we found that 10-35% of the genes with a signal intensity of 100-200 were called present or marginal by the Affymetrix software, many of these genes being transcription factors. For example, ER81, an impor-tant transcription factor responsive to many signals via mitogen-activated protein kinases (Wu and Janknecht, 2002), was expressed in mouse kidney at a signal intensity of 146 (present call) but in the vitamin D receptor knock-out mouse its expression was reduced to 20 (absent call), an extremely important observation in this particular study be-cause this gene would be detected by the double filtration strategy but not if a signal intensity of 200 was used as the only cutoff threshold.
The 65 chip-chip comparisons for determining signal thresholds involved 14 experiments, 4 different types of chips and 9 different tissues, and included biological, tech-nical and cell line replicates. The thresholds we established using such a wide range of replicate experiments should be representative and robust enough to guide GeneChip data analysis while also being as easy to use as traditional threshold. Unlike traditional thresholds, signal thresholds vary according to signal intensity and thus overcome the weakness of the traditional 2-fold threshold which is nor-mally too low for genes within the low signal intensity range but too high for genes in the high signal intensity range. Signal thresholds also have the advantage that the threshold for a particular gene can be determined with 95% confidence simply by examining the signal intensity of the gene.
Though convenient, the use of a constant set of signal thresholds for different experiments can be criticized be-cause some experiments are more variable than others and one set of thresholds may not be ideal for all type of experi-ments. We addressed this potential problem by identifying a linear relationship between the interarray variability β which is a measure of experimental variation between two replicate samples and the weighted average threshold δ which is the weighted mean of six 95% confidence thresh-olds from each replicate comparison, the linear relationship making it possible to adjust the thresholds based on the ex-tent of experimental variation in a particular experiment. We validated the feasibility of this adjustment by directly comparing the predicted thresholds with experimentally determined thresholds and found no significant difference between the two. User-adjustable signal thresholds are ap-plicable to all types of experiments with different degrees of variation but are particularly useful for those experi-ments without replicates, these types of experiexperi-ments ac-counting for the majority of published microarray
experiments. Signal thresholds can either be used directly as a guideline for microarray data analysis or three simple steps can be followed to convert the signal thresholds into a new set of thresholds to suit a specific experiment, these steps being: 1) calculating the interarray variabilityβ as
β=Σ[|Ai-Bi|/(Ai+Bi)]/n, where Aiis the signal intensity of
the ithgene in experiment A and Biis the signal intensity of
the ithgene in the control (easily achieved using Excel®); 2) predicting the weighted average threshold δ using
δ= 6.6157*β– 0.4325; and 3) converting the established signal thresholds into a new set of thresholds (1.72*δ/0.78, 0.89*δ/0.78, 0.59*δ/0.78, 0.48*δ/0.78, 0.45*δ/0.78, 0.41*δ/0.78). The whole conversion procedures requires less than 10 min using the Excel®spreadsheet and a hand calculator.
Mills and Gordon (2001) have also developed an em-pirical approach for eliminating noise from Affymetrix mouse GeneChip®data sets in order to overcome the weak-ness of traditional thresholds. In this case, Mills and Gordon used three-dimensional plots to characterize noise in the context of biological variation and summarized the noise in the form of tables of look-up scores which they used to evaluate the reliability of the `increase’ or `de-crease’ in the calls produced by the Affymetrix software. This approach is useful for initial screening and has proven to be more effective than the traditional thresholds but has the following drawbacks: the look-up tables were derived from only 18 chip-chip comparisons of the same mouse chips; the score system (particularly for a partner chip) has no rules to follow and is difficult to remember; the use of the score is still an arbitrary decision with no statistical ba-sis. In contrast, the signal thresholds described in our pres-ent paper were derived from 65 replicate comparisons involving different samples and chips; the signal intensity bins were grouped in increments ofχi-1(χi= 2*χi-1); and the
thresholds carry 95% confidence levels and offer signifi-cantly enhanced power in predicting change compared to traditional thresholds. Quantitative RT-PCR showed that the use of signal-dependent thresholds produced three times less false change calls than the use of the traditional two-fold thresholds.
Acknowledgments
We thank Kay Macleod, Anning Lin, Eric Svensson, Chyung-Ru Wang, Michelle LeBeau, Erich Jaeger, Tina Harr, Audrey Esclatine, Yanchun Li, Mitchel Villereal and Brunella Taddeo for giving us permission to use their repli-cate comparisons in this study. This work was in part sup-ported by the Division of Biological Sciences, the Cancer Research Center and the NIDDK Biotechnology Center at the University of Chicago (U24D55370).
References
Amundson SA, Bittner M, Chen Y, Trent J, Meltzer P and Fornace Jr AJ (1999) Fluorescent cDNA microarray hybridization reveals complexity and heterogeneity of cellular genotoxic stress responses. Oncogene 18:3666-3672.
Baechler EC, Batliwalla FM, Karypis G, Gaffney PM, Moser K, Ortmann WA, Espe KJ, Balasubramanian S, Hughes KM, Chan JP, Begovich A, Chang SY, Gregersen PK and Behrens TW (2004) Expression levels for many genes in hu-man peripheral blood cells are highly sensitive toex vivo in-cubation. Genes Immun 5:347-353.
Baggerly KA, Coombes KR, Hess KR, Stivers DN, Abruzzo LV and Zhang W (2001) Identifying differentially expressed genes in cDNA microarray experiments. J Comput Biol 8:639-659.
Bassett Jr DE, Eisen MB and Boguski MS (1999) Gene expres-sion informatics – It is all in your mine. Nature Genet 21:51-55.
Chen Y, Dougherty ER and Bittner M (1997) Ratio-based deci-sions and the quantitative analysis of cDNA microarray im-ages. J Biomed Opt 2:364-374.
Cleveland W and Devlin S (1988) Locally weighted linear regres-sion: An approach to regression analysis by local fitting. J Am Stat Assoc 83:596-609.
Coller HA, Grandori C, Tamayo P, Colbert T, Lander ES, Eisenman RN and Golub TR (2000) Expression analysis with oligonucleotide microarrays reveals that MYC regu-lates genes involved in growth, cell cycle, signaling, and ad-hesion. Proc Natl Acad Sci USA 97:3260-3265.
Der SD, Zhou A, Williams BR and Silverman RH (1998) Identifi-cation of genes differentially regulated by interferon alpha, beta, or gamma using oligonucleotide arrays. Proc Natl Acad Sci USA 95:15623-15628.
Dudoit S, Yang YH, Callow M and Speed T (2002) Statistical methods for identifying differentially expressed genes in replicated cDNA microarray experiments. Statistica Sinica 12:111-139.
Fambrough D, McClure K, Kazlauskas A and Lander ES (1999) Diverse signaling pathways activated by growth factor re-ceptors induce broadly overlapping, rather than independ-ent, sets of genes. Cell 97:727-741.
Goryachev AB, Macgregor PF and Edwards AM (2001) Un-folding of microarray data. J Comp Biol 8:443-461. Grundschober C, Malosio ML, Astolfi L, Giordano T, Nef P and
Meldolesi J (2002) Neurosecretion competence: A compre-hensive gene expression program identified in PC12 cells. J Biol Chem 277:36715-36724.
Hughes TR, Marton MJ, Jones AR, Roberts CJ, Stoughton R, Ar-mour CD, Bennett HA, Coffey E, Dai H, He YD, Kidd MJ,
King AM, Meyer MR, Slade D, Lum PY, Stepaniants SB, Shoemaker DD, Gachotte D, Chakraburtty K, Simon J, Bard M and Friend SH (2000) Functional discovery via a com-pendium of expression profiles. Cell 102:109-126. Hunter BG, Beatty MK, Singletary GW, Hamaker BR, Dilkes BP,
Larkins BA and Jung R (2002) Maize opaque endosperm mutations create extensive changes in patterns of gene ex-pression. Plant Cell 14:2591-612.
Kerr MK, Martin M and Churchill GA (2000) Analysis of vari-ance for gene expression microarray data. J Comp Biol 7:819-837.
Landis GN, Abdueva D, Skvortsov D, Yang J, Rabin BE, Carrick J, Tavare S and Tower J (2004) Similar gene expression pat-terns characterize aging and oxidative stress inDrosophila melanogaster. Proc Natl Acad Sci USA 101:7663-8. Li C and Wong WH (2001) Model-based analysis of
oligonucleotide arrays: Expression index computation and outlier detection. Proc Natl Acad Sci USA 98:31-36. Lockhart DJ, Dong H, Byrne MC, Follettie MT, Gallo MV, Chee
MS, Mittmann M, Wang C, Kobayashi M, Horton H and Brown EL (1996) Expression monitoring by hybridization to high-density oligonucleotide arrays. Nat Biotechnol 14:1675-80.
Long AD, Mangalam HJ, Chan BYP, Toller L, Hatfield GW and Baldi P (2001) Improved statistical inference from DNA microarray data using analysis of variance and a Bayesian statistical framework. J Biol Chem 276:19937-19944. Mills JC and Gordon JI (2001) A new approach for filtering noise
from high-density oligonucleotide microarray datasets. Nu-cleic Acids Res 29:E72-2.
Newton MA, Kendziorski CM, Richmond CS, Blattner FR and Tsui KW (2001) On differential variability of expression ra-tios: Improving statistical inference about gene expression changes from microarray data. J Comp Biol 8:37-52. Schena M, Shalon D, Heller R, Chai A, Brown PO and Davis RW
(1996) Parallel human genome analysis: Microarray-based expression monitoring of 1000 genes. Proc Natl Acad Sci USA 93:10614-10619.
Sreekumar R, Halvatsiotis P, Schimke JC and Nair KS (2002) Gene expression profile in skeletal muscle of type 2 diabetes and the effect of insulin treatment. Diabetes 51:1913-1920. Strand AD, Olson JM and Kooperberg C (2002) Estimating the statistical significance of gene expression changes observed with oligonucleotide arrays. Hum Mol Genet 11:2207-2221. Tamayo P, Slonim D, Mesirov J, Zhu Q, Kitareewan S, Dmitrovsky E, Lander ES and Golub TR (1999) Interpreting patterns of gene expression with self-organizing maps: Methods and application to hematopoietic differentiation. Proc Natl Acad Sci USA 96:2907-2912.
Tusher VG, Tibshirani R and Chu G (2001) Significance analysis of microarrays applied to the ionizing radiation response. Proc Natl Acad Sci USA 98:5116-5121.
Wang Y, Rea T, Bian J, Gray S and Sun Y (1999) Identification of the genes responsive to etoposide-induced apoptosis: Appli-cation of DNA chip technology. FEBS Lett 445:269-273. Wu J and Janknecht R (2002) Regulation of the ETS transcription
factor ER81 by th e 90 kDa ribosomal S6 kinase 1 and pro-tein kinase A. J Biol Chem 277:42669-42679.
differen-tial expression measures and reproducibility in microarray assays. Genome Biol 3(11):research0062.
Yang YH, Dudoit S, Luu P, Lin DM, Peng V, Ngai J and Speed TP
(2002) Normalization for cDNA microarray data: A robust composite method addressing single and multiple slide
sys-tematic variation. Nucleic Acids Res 30:e15.
Zamurovic N, Cappellen D, Rohner D and Susa M (2004) Coordi-nated activation of Notch, Wnt and TGF-beta signaling pathways in BMP-2 induced osteogenesis: Notch target gene Hey1 inhibits mineralization and Runx2 transcriptional activity. J Biol Chem 279:37704-37715.