Genetic characterization and phylogeography of the wild boar
Sus scrofa
introduced into Uruguay
Graciela García, Julia Vergara
*and Raúl Lombardi
Sección Genética Evolutiva, Facultad de Ciencias, Universidad de la República Uruguay,
Montevideo, Uruguay.
Abstract
The European wild boarSus scrofa was first introduced into Uruguay, in southern South America during the early de-cades of the last century. Subsequently, and starting from founder populations, its range spread throughout the country and into the neighbouring Brazilian state Rio Grande do Sul. Due to the subsequent negative impact, it was officially declared a national pest. The main aim in the present study was to provide a more comprehensive scenario of wild boar differentiation in Uruguay, by using mtDNA markers to access the genetic characterization of populations at present undergoing rapid expansion. A high level of haplotype diversity, intermediate levels of nucleotide diversity and considerable population differentiation, were detected among sampled localities throughout major watercourses and catchment dams countrywide. Phylogenetic analysis revealed the existence of two different phylogroups, thereby reflecting two deliberate introduction events forming distantly genetic lineages in local wild boar populations. Our analysis lends support to the hypothesis that the invasive potential of populations emerge from introgressive hy-bridization with domestic pigs. On taking into account the appreciable differentiation and reduced migration between locales in wild boar populations, management strategies could be effective if each population were to be considered as a single management unit.
Key words:Uruguayan wild boar.
Received: October 22, 2010; Accepted: December 1, 2010.
Introduction
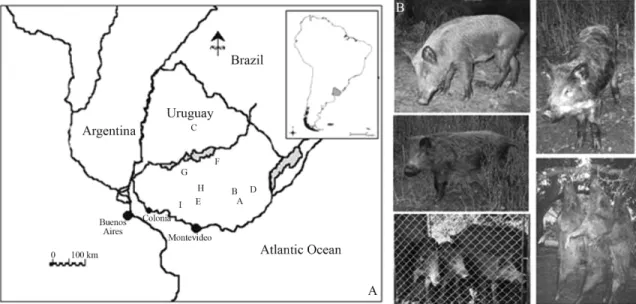
The European wild boarSus scrofa was first intro-duced into Uruguay, in southern South America, during the early decades of the last century. During the 1920's, Aaron de Anchorena, an Argentinean landowner, introduced a number of wild boars onto his ranch in the south-western Department of Colonia (one of the administrative divisions in Uruguay) for hunting purposes (Figure 1a). The founder population, on encountering adequate environmental con-ditions, and through specific dispersal capacity and genera-list predator habits, began to increase in numbers and widely expand its range. The present day wild boar popula-tion is presumed to comprise a cross-breed with domestic pigs (Figure 1b), thereby giving rise to great variability in phenotypes, albeit with a predominance of wild boar char-acteristics (Herrero and Fernandez de Luco, 2003). The quick expansion of the animal's range was facilitated by the locally mild climate, dense network of rivers, forest corri-dors, and an abundant food source of cultivated crops and
vulnerable domestic animals, together with the absence of natural predators. Nowadays, species distribution is wide-spread, having started in the west, the main agricultural zone, from there later extending to central and eastern parts of the country, and in the neighbouring Brazilian state Rio Grande do Sul.
The species has been extensively hunted over recent years. Some landowners have a highly negative perception of wild boars, regarding them as being responsible for di-rect predation of sheeps, even though such was not verified and quantified and only apparent by interviewing farmers (Herrero and Fernandez de Luco, 2003). In 1982, the ani-mal was officially declared a national pest (Decree 463/982).
Feral pigs are also potential reservoirs or `vectors for a number of endemic and exotic diseases capable of affect-ing domestic livestock, wildlife and even humans. In Aus-tralia, for example, besides leptospirosis and brucellosis, they are also capable of transmitting exotic diseases, such as foot-and-mouth disease and Japanese encephalitis (Dex-ter, 2003; Caley and Hone, 2004).
Along with knowledge of spatial genetic structure, that of population dispersal is also essential for reducing and reversing environmental impacts (Hampton et al., 2004), particularly so in the development of effective con-Send correspondence to Graciela García. Facultad de Ciencias,
UDELAR, Iguá 4225. 11400 Montevideo, Uruguay. E-mail: [email protected].
*Present address: CONICET- Cátedra de Diversidad Animal I, FCEFyN, UNC, Córdoba, Argentina.
trol programmes for feral or invasive species, and for ob-taining informative and reliable risk analysis (Edwardset al., 2004).
A major genetic paradox in invasive species is resolv-ing how bottlenecked populations, with typically low ge-netic diversity, low evolutionary potential and, possibly, reproductive fitness, can become invasive (Frankham, 2005). The wild boar from Uruguay thus constitutes an interesting species-model for solving the issue, besides rep-resenting an unusual challenge for encountering local man-agement strategies.
New approaches, using contemporary molecular techniques, in conjunction with demographic data, can be extremely useful for a better comprehension of the dynam-ics, population structure and social biology of many inva-sive species (Tayloret al., 2000).
Among genetic markers, highly polymorphic animal mitochondrial DNA (mtDNA), almost exclusively mater-nally inherited and without genetic recombination, consti-tutes a powerful tool for a population genetic approach. The clonal transmission of mtDNA haplotypes facilitates the discrimination of matrilineage within species, the sequence analysis of their most variable regions being useful for in-vestigating the genetic origin of animal populations and breeds, and thus, domestication processes in livestock spe-cies themselves (Bradleyet al., 1996; Luikartel al., 2001).
The main aim of this investigation is to provide a more comprehensive scenario of wild boar differentiation in Uruguay, using mtDNA population markers and phylo-genetic analysis for testing possible hypotheses regarding their rapid expansion. Furthermore, this is a first-time re-port containing genetic information, with
recommenda-tions for more effective control strategies of feral pigs in Uruguay.
Material and Methods
Sampling and DNA extraction
This phylogeographic study of the Uruguayan wild boar included specimens (Appendix 1) mostly from the southern, central, northeastern and eastern regions of the country, covering the geographic range of expansion, start-ing from the introduction site in the Department of Colonia (Figure 1). The remainder are sequences retrieved from GenBank, and pertaining to Spanish, Italian, central Euro-pean and Japanese wild boars, as well as commercial pig breeds, viz., Large White, Landrace, Duroc and Pietrain (Supplementary Material, Table S1). Tissues of voucher specimens were deposited in the Sección Genética Evo-lutiva, Facultad de Ciencias, Uruguay. Outgroup analysis included individuals pertaining to two additional taxaSus verrucosusandPhacochoerus africanus.
Genomic DNA was isolated from liver and muscle tissues of freshly sacrificed animals (fixed in ethanol 95%), using an extraction with a sodium chloride protein precipi-tation, followed by ethanol DNA precipitation (modified from Milleret al., 1988).
Mitochondrial cytochrome b (cyt b) sequences
ences inc.) Rapid PCR Purification System, to then undergo sequencing using amplification primers with a Perkin-Elmer ABI Prism 377 automated sequencer. The fi-nal sequences for afi-nalysis were obtained by reconciling chromatograms for light and heavy DNA strands. Sequence alignment was performed using the CLUSTAL X program (Thompsonet al., 1997).
Data analysis and DNA polymorphism
Nucleotide composition and substitution patterns were calculated using the MEGA (Kumaret al., 2004) and DNASP4 (Rozas et al., 2003) computer programs. Cor-rected estimates of pairwise sequence divergence were ob-tained using the two-parameter algorithm (K2P) of Kimura (1980) implemented into MEGA. Population DNA poly-morphism was measured by calculating the proportion of segregating sites (S), haplotype diversity (Nei, 1987; p. 179), and nucleotide diversityp(Nei, 1987; p.257), using
ARLEQUIN (Schneideret al., 2000) and DNASP4 (Rozas
et al., 2003) software packages.
In order to evaluate neutrality departure in the data, Tajimas D (Tajima, 1989) was calculated using the DNASP4 (Rozaset al., 2003) software package, as a way of testing any significant excess of low-frequency haplotypes.
Phylogenetic analyses
Two methods of phylogenetic reconstruction viz., maximum-parsimony (MP) and neighbor-joining (NJ), were employed to define phylogeographic association among mitochondrial sequences, using for the purpose PAUP*4.0b8 (Swofford, 1998). Equally weighted maxi-mun-parsimony analysis was undertaken by way of heuris-tic search (MULPARS option, stepwise addition, tree-bisection-reconnection [TBR] branch swapping, 100 repli-cations). Strict consensus between rival trees was com-puted to reconcile equally parsimonious topologies. Dis-tance trees were generated using a Hasegawaet al.(1985) model, taking into consideration differences among trans-version and transition substitutions, as well as those among base frequencies. The neighbour-joining method (Saitou and Nei, 1987) was employed for phylogenetic reconstruc-tion. In the case of both methods (MP and NJ), the degree of confidence assigned to nodes in trees was assessed by boot-strapping with 1000 replicates. All the trees were rooted by means of the outgroup criterion.
Analysis of Molecular Variance and Nested Clade Analysis (NCA)
In order to examine genetic structuring among Uru-guayan wild boar populations, variance components among hierarchical partitions in the data set were assessed through the Analysis of Molecular Variance (AMOVA) developed by Excoffieret al.(1992). The Euclidean metric (Excoffier
et al., 1992) was used to construct the matrix of pairwise distances. Various grouping hypotheses were proposed for
analyzing the hierarchical partitioning of genetic variation. Three among these were retained, viz., 1) all the haplotypes were gathered into a single group, 2) haplotypes from two neighbouring eastern sites and distributed into the corre-sponding groups (B and D in Figure 1)vs. all the remaining geographic localities, 3) the haplotypes were assigned to three regions (southern, central-northeastern and eastern Uruguay) representing the diverse Uruguayan basins, as a means of recuperating biogeogeographic information.
The existence of geographic association among haplotypes was assessed by NCA (Templetonet al., 1995). Thecyt bhaplotype network in Uruguayan wild boars was estimated by using the statistical parsimony method, with the algorithm described by Templetonet al. (1992). Ac-cordingly, the cladogram for finding haplotype connections with probabilities above the 0,95 confidence level was contructed using the TCS 1.06 (Clementet al., 2000) pro-gram. Statistics related to data distances, viz., internal clade (Dc), between clades (Dn) and between interior and tip clades (I-T), were generated by exact permutation contin-gency analysis of clades within nested categories as against their respective geographic locality (Templeton et al., 1995), using in the process 10,000 permutations of nesting clades versus sampling localities, and assuming as recom-mended statistical significance,a= 0.05. Results obtained
from GEODIS were then interpreted, using the revised Posada and Templeton (2008) inference key to elucidate al-ternative historical scenarios of wild boar differentiation.
Population subdivision was measured by assuming the infinite mutation model (Kimura and Crow, 1964) and calculating FST (Slatkin, 1991) for the whole population.
Pairwise estimates of FSTwere calculated using Arlequin
(Schneideret al., 2000) to generate pairwise estimates of gene flow levels, as follows: Nfm » 1/2 [(1/ FST) - 1]
(Wright, 1951).
Results
Mitochondrialcyt bdiversity and population genetic analysis
The estimated average rate of transitional/transver-sional substitution (r = si/sv) in the wild boarcyt bgene was 2:1 (1str = 1.7; 2sdr = 0.5 and 3rdr = 2.8 codon positions). Among the Uruguayan wild boar samples, deduced amino acid sequences showed only 20 of 190 amino acids to be variable and 9 phylogenetically informative sites.
Corrected pairwise K2P sequence divergence among the sampled Uruguayan wild boars is presented in Table 1. The average genetic distance was 1.7% (SD = 0.003), thus remarkably higher than that found among European (0.3% -SD = 0.001), and Japanese and Israeli (1.3% - -SD = 0.005) wild boars, as well as the analyzed commercial breeds (0.9% - SD = 0.003). The maximun divergence by includ-ing outgroup taxa was 8.4% (SD = 0.009).
No significant excess of low-frequency haplotypes among Uruguayan wild boars (D = -1.418 p > 0.10) was re-vealed by Tajima D'test.
Phylogenetic analyses
The same two evolutionary sister clades that consti-tute different phylogroups were identified by maximum parsimony and distance analysis. In maximum parsimony analysis, strict consensus (Figure 2) resulted in the 100 most parsimonious trees (156 steps), thereby showing a major and monophyletic clade integrated by 12 Uruguayan wild boar haplotypes. They collapsed into a basal polytomy joining all the haplotypes belonging to European wild boars, together with Landrace and Large White commercial breeds. A minor clade integrated by the Uruguayan wild boar haplotypes 9 and 10 collapsed together with a Japa-nese wild boar haplotype and the Duroc and Pietrain com-mercial breeds. All the major clades received high bootstrap values of 80%-100% in both phylogenetic analy-ses.
AMOVA analysis and geographic distribution of genetic variation
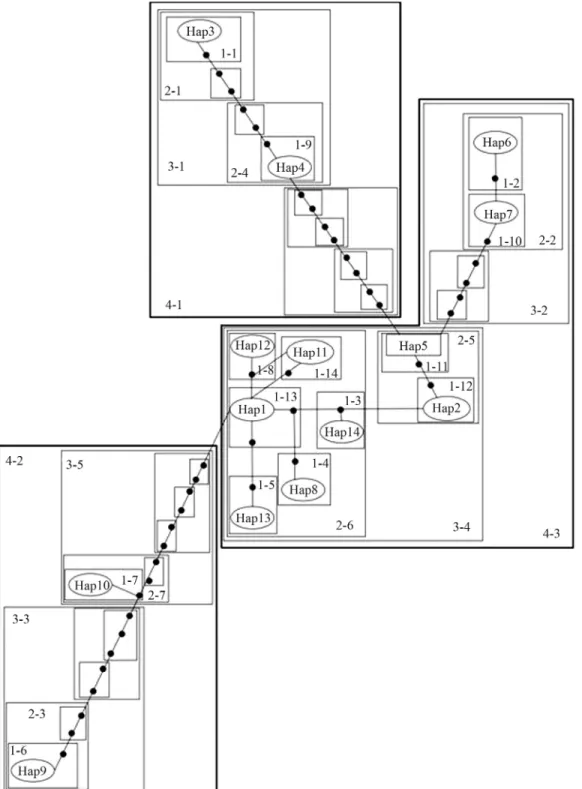
Statistical parsimony network based on thecyt bgene (Figure 3), revealed the strong genetic structuring among haplotypes of the Uruguayan wild boar showing different phylogroups. The total cladogram includes five levels of nested hierarchical clades presenting 11 maximum connec-tion steps at 95%. At a higher level of hierarchy, a major clade (4-3) of haplotypes remains connected by few mutational steps, thereby retaining a central position in the network. This major clade includes those locales in central Uruguay, in the neighborhood of the site in the Department of Colonia (Figure 1, sites I, E, H, G and F), the center of expansion throughout the central region itself, as well as the northeastern (C, Figure 1) and eastern (A, Figure 1). Haplo-type 5 relates this clade (4-3) to other more distant haplo-types that integrate clade 4-1. This haplotype corresponds to locale F (Figure 1) in the central region. Furthermore, two other genetically more distant haplotypes (9 and 10) represent a divergent clade (4-2 in Figure 3) in the eastern region, separated by ninety and ten step mutations, respec-tively, from the remainder. Finally, nested contingency analysis of almost all clade levels revealed no significant association of clades and geographic distances.
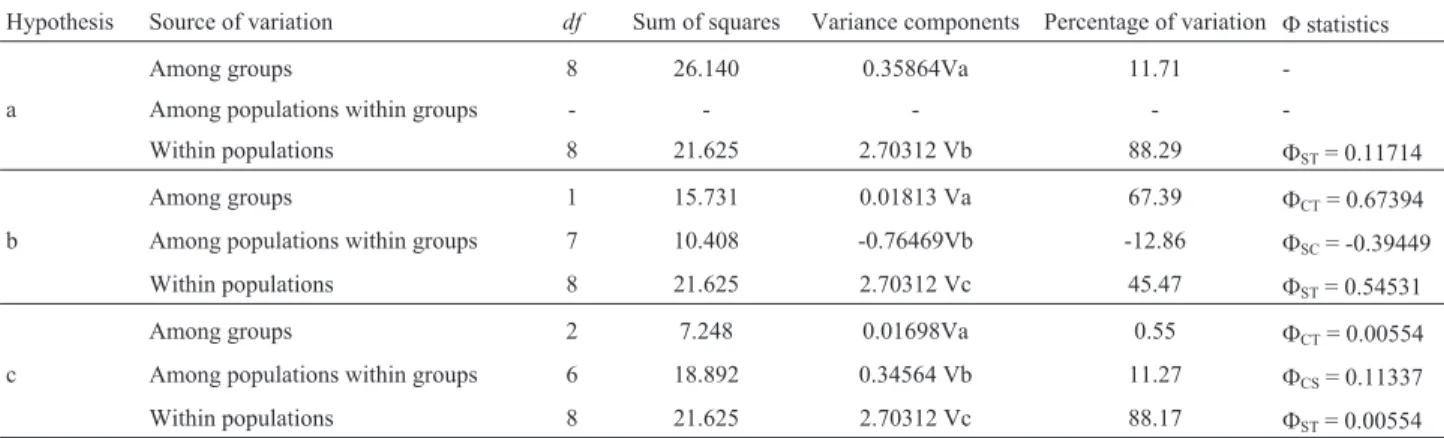
AMOVA results compiling the three retained hypoth-eses are shown in Table 2. Under the two-group hypothesis (2), most genetic variation amongcyt bhaplotypes was dis-tributed among-groups (FCT= 0. 673). All the other tested
structuring hypotheses failed to provide a more reasonable explanation for maximization of among-group hierarchical molecular variation.
Indirect estimates of pairwise FSTvalues revealed
al-most complete genetic isolation among locales, except for
Table 1- Corrected genetic distances among 14 haplotypes of the Uruguayan wild boarSus scrofa, according to the Kimura 2-P model (below the diago-nal), and Standard Deviation (SD) estimated by the bootstrap method (above the diagonal).
hap1 hap2 hap3 hap4 hap5 hap6 hap7 hap8 hap9 hap10 hap11 hap12 hap13 hap14
hap1 - 0.002 0.027 0.029 0.005 0.011 0.007 0.005 0.022 0.016 0.002 0.002 0.002 0.004
hap2 0.002 - 0.029 0.027 0.004 0.013 0.009 0.004 0.024 0.018 0.004 0.004 0.004 0.002
hap3 0.007 0.008 - 0.027 0.029 0.027 0.024 0.033 0.042 0.044 0.029 0.029 0.029 0.031
hap4 0.007 0.007 0.007 - 0.024 0.033 0.029 0.027 0.052 0.046 0.031 0.031 0.031 0.029
hap5 0.003 0.002 0.008 0.007 - 0.009 0.005 0.007 0.027 0.022 0.007 0.007 0.007 0.005
hap6 0.004 0.005 0.007 0.008 0.004 - 0.004 0.016 0.022 0.027 0.013 0.013 0.013 0.014
hap7 0.003 0.004 0.007 0.008 0.003 0.002 - 0.013 0.022 0.024 0.009 0.009 0.009 0.011
hap8 0.003 0.002 0.008 0.007 0.003 0.005 0.005 - 0.027 0.022 0.007 0.007 0.007 0.005
hap9 0.006 0.007 0.010 0.011 0.007 0.006 0.006 0.007 - 0.009 0.024 0.024 0.024 0.025
hap10 0.005 0.006 0.010 0.010 0.006 0.007 0.007 0.007 0.004 - 0.018 0.018 0.018 0.020
hap11 0.002 0.002 0.008 0.008 0.003 0.005 0.004 0.003 0.007 0.006 - 0.004 0.004 0.005
hap12 0.002 0.002 0.008 0.008 0.003 0.005 0.004 0.003 0.007 0.006 0.002 - 0.004 0.005
hap13 0.002 0.002 0.008 0.008 0.003 0.005 0.004 0.003 0.007 0.006 0.002 0.002 - 0.005
-site A, with considerable genetic exchange with the remain-der. On the other hand, all were genetically isolated from B and D.
Discussion
Mitochondrial cytochrome b variation in Uruguayan wild boar populations
Present results represent the first population genetic characterization of Uruguayan wide-ranging wild boars, when using the mitochondrial cytochrome b gene. High levels of haplotype diversity, intermediate levels of nucleo-tide diversity, and considerable population differentiation among sampled localities throughout major watercourses and catchment dams, were detected (Figure 1).
Intermediate nucleotide diversity was similar to that reported for Artiodactyla, taxa, when using mtDNA cyto-chrome b sequences in a comparative analysis of various mammalian orders and families (Nabholzet al., 2008).
According to the present study, levels of corrected se-quence divergence among Uruguayan wild boar haplo-types, although higher than in the European wild type and commercial breeds, was similar to the Japanese and Israeli. In previous studies, when considering bothcyt band the mtDNA control region, an appreciable genetic distance (1.2±0.09%) between European wild boars (Italy and
Po-land) and Asian (Israel), was found (Giuffraet al., 2000), therefore consistent with the divergence found in the Uru-guayan wild boar data set. In contrast, on analyzing mito-chondrial control region data from domestic pigs, Fang and Andersson (2006) reported low genetic divergence in all the Chinese mtDNA haplotypes (mean ± SD,
0.006± 0.001), as well as all the European (mean±SD,
0.005±0.001).
All accumulated data, plus the average si/sv ratio de-tected in thecyt bfragment, indicate that this molecular marker, besides revealing no evidence of among-site satu-ration, represents a useful tool for genetically characteriz-ing the recently introduced feral pig in Uruguay.
Figure 2- Maximum parsimony phylogenetic relationships based on the cytochrome b dataset of haplotypes of Uruguayan, European and Japanese wild boars, as well as sequences from commercial breeds ofSus scrofa.
The strict consensus resulted in 100 of the shortest most parsimonious trees (156 steps). All the trees were rooted by usingSus verrucosusand
Phacochoerus africanusas outgroups. Bootstrap values above 50% are shown on the relevant nodes.
Table 2- Analysis of molecular variance (AMOVA) in the Uruguayan wild boarSus scrofa. Hierarchical partition of genetic variation into three compo-nents: among groups (FCT), among populations within groups (FCS), and among individuals within populations (FST), disregarding either their original populations or groups. Among the tested hypotheses, three were selected: a) including all the collecting sites into just one group; b) forming two groups of populations, consisting of all the collection sitesvs.Rio Cebollatí and Lascano; c) the separation into three groups of samples pertaining to the various river basins, viz., the eastern, central-northeastern and southern. The highlighted line corresponds to values which maximal among-group differentiation.
Hypothesis Source of variation df Sum of squares Variance components Percentage of variation Fstatistics
Among groups 8 26.140 0.35864Va 11.71
-a Among populations within groups - - - -
-Within populations 8 21.625 2.70312 Vb 88.29 FST= 0.11714
Among groups 1 15.731 0.01813 Va 67.39 FCT= 0.67394
b Among populations within groups 7 10.408 -0.76469Vb -12.86 FSC= -0.39449
Within populations 8 21.625 2.70312 Vc 45.47 FST= 0.54531
Among groups 2 7.248 0.01698Va 0.55 FCT= 0.00554
c Among populations within groups 6 18.892 0.34564 Vb 11.27 FCS= 0.11337
Population structuring in Uruguayan wild boar populations
Phylogenetic analysis (Figure 2) revealed the exis-tence of two different phylogroups among the Uruguayan wild boar haplotypes. The major of the two comprises all those, with the exception of 9 and 10, pertaining to the dif-ferent localities in souththern, central and northeastern Uruguay. This clade collapsed into a basal polytomy with all the sequences from European wild boars, and Landrace and Large White domestic pigs. The minor phylogroup, comprised of haplotypes 9 and 10, joins the sequences from Pietrain and Duroc domestic pigs, as well as the Japanese wild boar. Generally speaking, the statistical parsimony network (Figure 3) showed the same genealogical history, although here the major phylogroup is divided into two clades, 4-1 (haplotypes 3 and 4) and 4-3 (this including the remaining haplotypes of the group). Consequently, clade 4-1 corresponds to a minor derivative monophyletic clade (integrated by haplotypes 3 and 4) in the phylogenetic tree (Figure 2). On the other hand, the minor phylogroup in phylogenetic reconstruction (Figure 2) was consistent with clade 4-2 in the statistical parsimony network (Figure 3).
The present analysis supports the hypothesis of two different deliberate introduction events of distantly related genetic lineages in the Uruguayan wild boar populations. The distribution of the major clade is consistent with the historical introduction of the European wild boar into the Colonia Department, and its dispersal throughout localities in southern, central and northeastern Uruguay, by way of the principal basins and watercourse of the Rio Santa Lucía andthe Río Negro. The second introduction, occurred in southeastern Uruguay near the Cebollatí river in the Merin lagoon basin, the border between Uruguay and the Brazil-ian state Rio Grande do Sul, may have been a deliberate introduction since southern Brazil. Further analysis, includ-ing samples from these neighbourinclud-ing localities, could pos-sibly clarify the issue.
Moreover, two major hypotheses would explain the association of the Uruguayan wild boar with others popula-tions of different origins, as well as with different strains of domestic pigs, i.e.,the existence of ancestral polymor-phisms and/or multiple introgressive hybridization events, as possible, although not mutually exclusive, scenarios. These scenarios are consistent with the level of genetic variation accumulated in the Uruguayan wild boar popula-tions. The evidence of ancestral polymorphism has been a plausible hypothesis since 1920, when the first introduction of wild boars of unknown origin was reported (Herrero and Fernández de Luco, 2003). In this case, various types of Eu-ropean wild boars would be involved, as can be inferred on examining taxa association in the major clade (Figure 2). The presence of lung parasites of the genusMetastrongylus
sp., quite common in European wild boars, is notable in the Uruguayan wild boar and could give support to this possi-ble origin. Nevertheless, it is difficult to explain the
associ-ation with the Japanese wild boar, Duroc and Pietrain se-quences in the minor clade, through the lack of additional information regarding neighbouring south Brazilian wild boar populations.
The hypothesis of hybridization and introgression is well supported in phenotypical characterization among cur-rent Uruguayan wild boar populations (Herrero and Fer-nández de Luco, 2003). These authors proposed their emergence from cross-breeding between wild boars and domestic pigs, hence the wide diversity in phenotypes, with a predominance of characteristics from the former. Conse-quently, some individuals have white hair on the feet, the underside of the neck, tarsus and carpus, drooping ears and jet black or red tails, whereas others present outstanding and fast growth, great intrapopulation morphological vari-ability and considerable accumulation of subcutaneous fat (Herrero and Fernández de Luco, 2003).
According to Lee (2002), the inter- or intraspecific hybridization of an invasive population with native or non-native populations would alleviate the loss of additive ge-netic variance during founder events, and thus generate novel genotypes. Numerous studies have documented the positive effects of hybridization on invisibility, such as faster growth, greater size and increased aggression. All these characteristics were encountered in Uruguayan wild boar populations (Herrero and Fernández de Luco, 2003). Lee (2002) also proposed successful invasion to be a proba-ble result of advantageous selection among numerous hy-brid combinations.
According to Avise (2000), high haplotype and low nucleotide diversities infer rapid population growth from an ancestral population with small Ne. Current results con-cerning mtDNA polymorphism parameters could conform to this interpretation. Moreover, Frankham (2005) postu-lated that certain invasive species possess elevated genetic diversity and the enhanced ability to evolve when invading novel localities. All present population genetic data pointed out that hybridization between introduced wild boars and domestic pigs could be a plausible explanation of the inva-sive potential of these cross-bred populations.
The levels of differentiation found are consistent with existing knowledge of the regional distribution and biology of the Italian wild boar (Vernesiet al., 2003). There was also a certain similarity with the population structure of feral pigs in southwestern Australia (Hamptonet al., 2004), whereby dispersal rates between, but not within, the inferred feral pig
populations were relatively low. According to the relatively small home range of feral pigs in this region (Choquenotet al., 1996), a high level of genetic structuring was not unex-pected even between populations that were only 25 km apart. A similar dispersal pattern was encountered in neigh-bouring wild boar localities (A vs. B and D) which,
though only around 60 km apart, remained genetically isolated. Further population genetics analysis, using nu-clear markers (i.e.microsatellites, SNPs), could be a means of clarifying aspects of social organization, dispersal and possible asymmetric gene flow among populations in the Uruguayan wild boar. Even so, recent studies on wild boar from Tuscany (Italy) did not reveal that the predicted matri-linearity in wild boar social units. In this study, aggrega-tions of unrelated adult females were detected, thereby indicating a low degree of within-group relatedness (Iaco-linaet al., 2009).
Population genetics analysis in Uruguayan wild boars and management strategies
Present population genetics has contributed to the strategic management of Uruguayan wild boar populations. Considering both the high levels of differentiation and the normally low migration rates among localities in these pop-ulations, management strategies would be more effective if each population were to be considered as a single manage-ment unit. A similarmodus operandihas already been pro-posed for other feral pig populations (Hampton et al., 2004). The failure to recognize these units could result in the inevitable recurrent invasion of controlled areas. On the other hand, recurrence from neighbouring pig populations would be relatively slow, due to the low migration rate be-tween discrete or adjacent localities.
Acknowledgments
We wish to thank M. Acosta and N. de los Santos for kindly providing Uruguayan wild boar specimens. The au-thors are also grateful to the Japanese government for the donation of equipment to the Sección Genética Evolutiva in Facultad de Ciencias, Montevideo, Uruguay.
References
Alves E, Ovilo C, Rodríguez MC and Siló L (2003) Mitochondrial DNA sequence variation and phylogenetic relationships among Iberian pigs and other domestic and wild pigs popu-lations. Anim Genet 34:319-324.
Avise JC (2000) Phylogeography: The History and Formation of Species. Harvard University Press, Cambridge, 447 pp. Bradley DG, MacHugh DE, Cunningham P and Loftus RT (1996)
Mitochondrial diversity and the origins of African and Euro-pean cattle. Proc Natl Acad Sci USA 93:5131-5.
Caley P and Hone J (2004) Disease transmission between and within species, and the implications for disease control. J Appl Ecol 41:94-104.
Choquenot D, McIlroy J and Korn T (1996) Managing Vertebrate Pests: Feral Pigs. Australian Publishing Service, Canberra, 163 pp.
Clement M, Posada D and Crandall KA (2000) TCS: A computer program to estimate gene genealogies. Mol Ecol 9:1657-1659.
Decreto 463/1982 del Poder Ejecutivo del 15/12/1982. Declara plaga nacional al jabalí europeo y autoriza su libre caza en todo el territorio nacional. Diario Oficial 21388-500-A. Dexter N (2003) Stochastic models of foot and mouth disease in
feral pigs in the. Australian semi-arid rangelands. J Appl Ecol 40:293-306.
Edwards GP, Pople AR, Saalfeld K and Caley P (2004) Intro-duced mammals in Australian rangelands: Future threats and the role of monitoring programmes in management strate-gies. Austral Ecol 29:40-50.
Excoffier L, Smouse PE and Quattro JM (1992) Analysis of mo-lecular variance inferred from metric distances among DNA haplotypes: Application to human mitochondrial DNA re-striction data. Genetics 131:479-491.
Fang M and Andersson L (2006) Mitochondrial diversity in Euro-pean and Chinese pigs is consistent with population expan-sions that occurred prior to domestication. Proc R Soc Lond B Biol Sci 273:1803-1810.
Frankham R (2005) Resolving the genetic paradox in invasive species. Heredity 94:385.
Giuffra E, Kijas JMH, Amarger LV, Carlborg O, Jeon JT and Andersson L (2000) The origin of the domestic pig: Inde-pendent domestication and subsequent introgression. Genet-ics 154:1785-1791.
Hampton JO, Spencer PBS, Alpers DL, Twigg LE, Woolnough AP, Doust J, Higgs T and Pluske J (2004) Molecular tech-niques, wildlife management and the importance of genetic population structure and dispersal: A case study with feral pigs. J Appl Ecol 41:735-743.
Hasegawa M, Kishino H and Yano T (1985) Dating of the hu-man-ape splitting by a molecular clock of mitochondrial DNA. J Mol Evol 22:160-174.
Herrero J and Fernández de Luco D (2003) Wild boars (Sus scrofa L.) in Uruguay: Scavengers or predators? Mammalia 67:485-491.
Iacolina L, Scandura M, Bongi P and Apollonio M (2009) Non kin associations in wild boar social units. J Mammal 90:666-674.
Kimura M (1980) A simple method for estimating evolutionary rate of base substitutions through comparative studies of nu-cleotide sequences. J Mol Evol 16:111-120.
Kimura M and Crow JF (1964) The number of alleles that can be maintained in a finite population. Genetics 49:725-738. Kumar S, Tamura K and Nei M (2004) MEGA3: Integrated
soft-ware for molecular evolutionary genetics analysis and se-quence alignment. Brief Bioinform 5:150-163.
Lee CE (2002) Evolutionary genetics of invasive species. Trends Ecol Evol 17:386-391.
Luikart G, Gielly L, Excoffier L, Vigne JD, Bouvet J and Taberlet P (2001) Multiple maternal origins and weak phylogeo-graphic structure in domestic goats. Proc Natl Acad Sci USA 98:5927-5932.
Miller SA, Dikes DD and Polesky HF (1988) A simple salting out procedure for extracting DNA for human nucleated cells. Nucleic Acids Res 16:215.
Nabholz B, Mauffrey JF, Bazin E, Galtier N and Glemin S (2008) Determination of mitochondrial genetic diversity in mam-mals. Genetics 178:351-361.
Rozas J, Sánchez-Delbarrio JC, Messeguer X and Rozas R (2003) DnaSP, DNA polymorphism analyses by the coalescent and other methods. Bioinformatics 19:2496-2497.
Saitou N and Nei M (1987) The neighbour-joining method: A new method for reconstructing phylogenetic trees. Mol Biol Evol 4:406-425.
Schneider S, Roessli D and Excoffier L (2000) Arlequin: A soft-ware for population genetics data analysis. University of Geneva, Switzerland.
Slatkin M (1991) Inbreeding coefficients and coalescence times. Genet Res 58:167-175.
Swofford DL (1998) PAUP* (Phylogenetic Analysis Using Parsi-mony). v. 4. Sinauer, Sunderland.
Tajima F (1989) Statistical method for testing the neutral mutation hypothesis by DNA polymorphism. Genetics 123:585-595. Taylor AC, Cowan PE, Fricke BL and Cooper DW (2000) Genetic
analysis of the mating system of the brushtail possum (Trichosurus vulpecular) in New Zealand farmland. Mol Ecol 9:869-879.
Templeton AR, Crandall KA and Sing CF (1992) A cladistic anal-ysis of phenotypic associations with haplotypes inferred from restriction endonuclease mapping and DNA sequence data. III. Cladogram estimation. Genetics 132:619-633. Templeton AR, Routman E and Phillips CA (1995) Separating
population structure from population history: A cladistic analysis of the geographical distribution of mitochondrial DNA haplotypes in the Tiger Salamander, Ambystoma tigrinurn.Genetics 140:767-782.
Thompson JD, Gibson TJ, Plewniak F, Jeanmougin F and Higgins DG (1997) The CLUSTAL_X windows interface: Flexible
strategies for multiple sequence alignment aided by quality analysis tools. Nucleic Acids Res 25:4876.
Vernesi C, Crestanello B, Pecchioli E, Tartari D, Carnelli D, Hauffe H and Bertorelle G (2003) The genetic impact of de-mographic decline and reintroduction in the wild boar (Sus scrofa): A microsatellite analysis. Mol Ecol 12:585-595. Wright S (1951) The genetical structure of populations. Ann
Eu-genics 15:323-354.
Internet Resources
Posada D and Templeton AR (2008) Inference Key for the Nested Haplotype Tree Analysis of Geographical Distance, http://darwin.uvigo.es/software/geodis.html (December, 2008).
Supplementary Material
The following online material is available for this ar-ticle:
Table S1 - List of specimen and haplotypes from cytochrome b sequences.
This material is available as part of the online article from http//scielo.br/gmb.
Associate Editor: João S. Morgante