Microsatellite analysis of a sample of Uruguayan Creole bulls (
Bos taurus
)
Eileen Armstrong
1, Alicia Postiglioni
1, Amparo Martínez
2, Gonzalo Rincón
1and José Luis Vega-Pla
31
Facultad de Veterinaria, Laboratorio de Análisis Genéticos en Animales Domésticos, Area Genética,
Montevideo, Uruguay.
2
Universidad de Córdoba, Facultad de Veterinaria, Departamento de Genética, Córdoba, España.
3Servicio de Cría Caballar y Remonta, Laboratorio de Genética Molecular, Córdoba, España.
Abstract
The Uruguayan Creole cattle genetic reserve consists of a herd of about 600 animals (bulls, cows and calves) lo-cated in an indigenous habitat of 650 hectares. In a previous study, a random sample from this herd showed high heterozygosity andaHardy-Weinberg equilibrium for markers of major genes related to milk production. To study its genetic diversity we genotyped a sample of bulls (N = 19 out of 23 for the whole herd) using the PCR reaction with a set of 17 microsatellite markers. Between two and seven different alleles were identified per microsatellite in a total of 73 alleles. The expected mean heterozygosity (He) per locus was between 0.465 and 0.801, except for microsatellite HEL13 which gave a He value of 0.288. The expected mean heterozygosity was 0.623 and the polymorphic informa-tion content (PIC) was between 0.266 for HEL13 and 0.794 for CSSM66. The genetic diversity found in polymorphic markers in the breeding bulls of this Creole cattle population supports previous genetic analyses using major produc-tion genes and indicate that further studies should be carried out on this populaproduc-tion to provide data of interest to cattle production.
Key words:Uruguayan Creole cattle, genetic diversity, microsatellites.
Received: March 11, 2005; Accepted: August 26, 2005.
Introduction
Creole cattle were introduced into America in 1493 by the Spanish and Portuguese conquerors, these cattle be-ing considered the product of multiple admixtures of Ibe-rian and other European cattle. The favorable environment into which the cattle were introduced promoted their repro-duction and they soon spread through the entire Central and South American continent. Their adaptation to different en-vironments allowed the expression of a high level of ge-netic variability but currently only few semi-wild Creole cattle populations remain in South America, examples be-ing the Patagonian Creole cattle of Argentina and the Pan-taneiro cattle of Brazil (Primo, 1992). Such semi-wild cattle populations are important because they may be a source of hidden alleles which have potential use in breed-ing programs, a major reason for locatbreed-ing and conservbreed-ing such herds (Rendoet al., 2004).
The first introduction of cattle into Uruguay was car-ried out by Hernando Arias de Saavedra at the beginning of the seventeenth century, and later by the Jesuit Missions of
Alto Uruguay. By the end of the nineteenth century many commercial cattle breeds were introduced, including Hol-stein-Friesian, Hereford and Aberdeen Angus, with the aim of improving cattle production and the Uruguayan econ-omy. These introductions reduced the huge population of Creole cattle to small and sparse subpopulations through-out the country and there is now just a single semi-wild population of about 600 head in southeastern Uruguay in an area of about 650 hectares of native woods, ridges and wetlands. In fact, the population of this herd had reached 1000 animals in recent years but had to be adjusted to a more limited area. Arredondo (1958) documented the cre-ation of the populcre-ation about 70 years ago from a founda-tion stock consisting of 35 Creole bulls, cows and calves brought from different locations with similar environ-ments.
Genomic studies using random amplified polymor-phic DNA (RAPD) on samples of Creole, Hereford and Uruguayan Holstein-Friesian cattle showed particular ge-netic distances in terms of band sharing frequencies (Hereford Creole: 0.77; Holstein Creole: 0.78; Here(Hereford -Holstein; 0.81). In spite of possible genetic introgression events from commercial breeds in the past, band sharing frequencies were higher among commercial breeds but
www.sbg.org.br
Send correspondence to Alicia Postiglioni. Facultad de Veterinaria, Laboratorio de Análisis Genéticos en Animales Domésticos, Area Genética, Avda. A. Lasplaces 1550, 11600 Uruguay. E-mails: [email protected]; [email protected].
lower between commercial breeds and Creole cattle, sug-gesting that the Creole population has developed mainly in reproductive isolation (Rincónet al., 2000).
Preliminary research on a random sample of cattle from the Uruguayan Creole cattle genetic reserve using the CYP21 and BM2113 polymorphic microsatellites and diallelic sequences of interest to dairy production showed genetic equilibrium and high expected heterozygosity (He = 0.800) (Postiglioni,et al., 2002). In the present study of the same population we analyzed only breeding bulls with a set of 17 microsatellites included in the list recom-mended by the Food and Agricultural Organization (FAO) for genetic diversity studies in domestic animals that justify their conservation as a sustainable genetic resource (ww.fao.org/DAD-IS; www.ri.bbsrc.ac.uk). In this popula-tion there are around 600 individuals but only 23 breeding males, so in such a small population it is important to ana-lyze the diversity of the males as a single category because they contribute half of the genetic variability of future gen-erations.
Material and Methods
Blood samples and markers analyzed
The population of Uruguayan Creole cattle of San Miguel National Park consists of 23 bulls and about 445 cows and 105 calves of both sexes. Genomic DNA was ex-tracted from blood samples of 19 bulls by the phenol-chloroform technique (John et al., 1991). The genomic DNA is stored in the genetic bank of the Genetic Labora-tory of Facultad de Veterinaria, Uruguay.
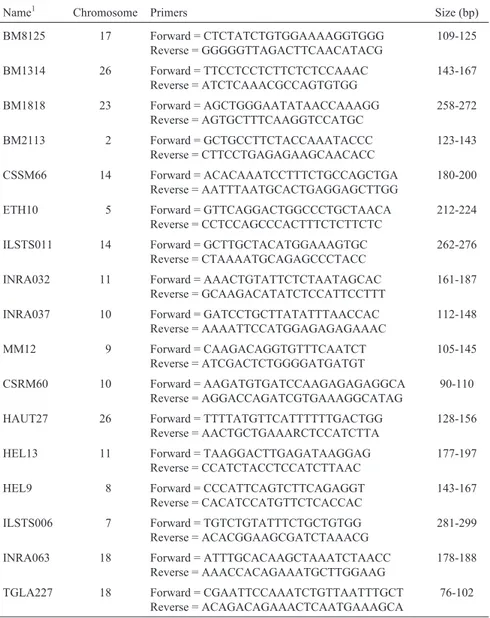
The 17 microsatellites analyzed were all dinucleo-tidic (Table 1) selected based on the following criteria: in-clusion in the microsatellite list proposed by the FAO/ IDAD (Initiative for Domestic Animal Diversity) program and/or the European Union Cattle Diversity Data Base of the bovine diversity project (ww.fao.org/DAD-IS; www.ri. bbsrc.ac.uk); present a high level of polymorphism; are widely used in the bibliography to allow comparative stud-ies with other breeds; are relatively easy to work with and can be genotyped by multiplex reactions; are evenly-distributed throughout bovine genome.
Microsatellite genotyping
The PCR genotyping of the 17 microsatellite sequen-ces was performed in a final volume of 20µL: 50 ngµL-1 genomic DNA, 10X PCR buffer, 2.5 mM MgCl2, 2.5 mM
dNTPs, 0.15µM primers and 1 UµL-1of Taq polymerase. Amplification was carried out in three multiplex reactions (M1, M2 and M3) using different fluorochromes for simi-lar-sized microsatellites: M1 = BM1314, CSSM66, ILSTS011, INRA37 and ETH10; M2 = BM1818, BM2113, BM8125, INRA32 and MM12; and M3 = HAUT27, HEL13, HEL9, CSRM60, ILSTS006, INRA63 and TGLA227. Amplification was carried out in a PTC 100
thermocycler (MJ Research Inc, USA) using an amplifica-tion protocol consisting of denaturalizaamplifica-tion at 95 °C for 30 s, followed by 35 cycles of 95 °C for 30 s, 55 °C for 45 s and 72 °C for 30 s, with a final extension at 72 °C for 30 min. The amplified fragments were separated on 6% polyacrylamide gel electrophoresis in an ABI377XL auto-matic sequencer and the gels read using the GENESCAN ANALYSIS v3.2.1 software, the GENOTYPER v2.5 pro-gram being used to assign an allele to each detected peak or band (both softwares and sequencer are from Applied Biosystems, Forster city Ca. USA). Allele size was stan-dardized using reference samples distributed by ISAG (In-ternational Society of Animal Genetics) for comparison tests.
Statistical analysis
Allele and genotype frequencies of the 17 micro-satellite loci were calculated using GENEPOP v3.1c (up-dated version of GENEPOP v1.2 described in Raymond and Rousset, 1995) and GENETIX v4.02 (Belkhiret al., 1998), this last program also being used to calculate the ex-pected heterozygosity (He), observed heterozygosity (Ho) and expected unbiased heterozygosity (Heu) according to
the formula developed by Nei (1973) and Nei and Roy-choudhury (1974). The polymorphic information content (PIC) index for each marker was calculated according to Botsteinet al. (1980).
Results and Discussion
Of the 169 alleles described for the markers used (http://www.marc.usda.gov/genome/genome.html) 73 al-leles were detected in our sample of bulls. The most poly-morphic microsatellites were CSSM66 and TGLA227 with seven alleles, while the least polymorphic was BM8125 with two alleles (Table 2). The level of polymorphism de-tected in each microsatellite was similar to that stated in the literature (q.v.Table 1). In a study of six native Spanish breeds, Martin-Burrielet al. (1998) also found TGLA227 to be the most polymorphic marker.
Regarding measures of genetic diversity (Table 3), the marker with the highest unbiased heterozygosity was CSSM66, followed by HEL9, TGLA227 and BM2113 while the marker with the lowest unbiased heterozygosity was HEL13, followed by BM8125. With the exception of these last two markers, all the microsatellites showed levels of expected unbiased heterozygosity higher than 0.500 (Ta-ble 3). Ta(Ta-ble 3 also shows the mean heterozygosity for the total sample, the fact that there is a difference between the expected (He) and observed (Ho) heterozygosity suggest-ing a tendency towards heterozygote deficiency.
study, the highest PIC values were obtained for those mark-ers with a high number of alleles (e.g.BM2113, CSSM66 and TGLA227) or which showed a more homogeneous al-lele frequency distribution even when the number of alal-leles detected were low (e.g. ILSTS011, INRA32 and ILSTS006) and for those alleles presenting both of these characteristics (e.g.HEL9).
Our study shows that the microsatellite markers with highest heterozygosity and PIC values were BM2113, CSSM66, HEL9 and TGLA227, which should be included in future genetic diversity studies of this and other cattle populations.
The average diversity levels detected were high (He = 0.623; Heu= 0.644; Ho = 0.584; mean PIC = 0.589;
mean number of alleles per locus: 4.294). If the sample is representative of the population, the observed values may
be related to the demographic history of the reserve. To support this idea, a larger sample of the population that in-cludes other age-sex categories should be analyzed.
Uruguayan Creole cattle developed from the admix-ture of many breeds in a process that generates high levels of genetic diversity (Kantanenet al., 2000). Random mat-ing over four centuries appears to have contributed to main-tain a high level of diversity in the population studied, aided by the fact that this population was created from 35 Creole cattle that came from different parts of Uruguay, the fusion of small previously isolated populations being known to re-sult in increased heterozygosity due to a reduction in the frequency of homozygotes (Hartl, 1988).
The heterozygosity detected in this study was similar to that found previously in this population (Rincónet al., 2000; Postiglioniet al., 2002). Our results for Uruguayan
Table 1- Description of the 17 molecular markers analyzed.
Name1 Chromosome Primers Size (bp)
BM8125 17 Forward = CTCTATCTGTGGAAAAGGTGGG Reverse = GGGGGTTAGACTTCAACATACG
109-125
BM1314 26 Forward = TTCCTCCTCTTCTCTCCAAAC Reverse = ATCTCAAACGCCAGTGTGG
143-167
BM1818 23 Forward = AGCTGGGAATATAACCAAAGG Reverse = AGTGCTTTCAAGGTCCATGC
258-272
BM2113 2 Forward = GCTGCCTTCTACCAAATACCC Reverse = CTTCCTGAGAGAAGCAACACC
123-143
CSSM66 14 Forward = ACACAAATCCTTTCTGCCAGCTGA Reverse = AATTTAATGCACTGAGGAGCTTGG
180-200
ETH10 5 Forward = GTTCAGGACTGGCCCTGCTAACA Reverse = CCTCCAGCCCACTTTCTCTTCTC
212-224
ILSTS011 14 Forward = GCTTGCTACATGGAAAGTGC Reverse = CTAAAATGCAGAGCCCTACC
262-276
INRA032 11 Forward = AAACTGTATTCTCTAATAGCAC Reverse = GCAAGACATATCTCCATTCCTTT
161-187
INRA037 10 Forward = GATCCTGCTTATATTTAACCAC Reverse = AAAATTCCATGGAGAGAGAAAC
112-148
MM12 9 Forward = CAAGACAGGTGTTTCAATCT Reverse = ATCGACTCTGGGGATGATGT
105-145
CSRM60 10 Forward = AAGATGTGATCCAAGAGAGAGGCA Reverse = AGGACCAGATCGTGAAAGGCATAG
90-110
HAUT27 26 Forward = TTTTATGTTCATTTTTTGACTGG Reverse = AACTGCTGAAARCTCCATCTTA
128-156
HEL13 11 Forward = TAAGGACTTGAGATAAGGAG Reverse = CCATCTACCTCCATCTTAAC
177-197
HEL9 8 Forward = CCCATTCAGTCTTCAGAGGT Reverse = CACATCCATGTTCTCACCAC
143-167
ILSTS006 7 Forward = TGTCTGTATTTCTGCTGTGG Reverse = ACACGGAAGCGATCTAAACG
281-299
INRA063 18 Forward = ATTTGCACAAGCTAAATCTAACC Reverse = AAACCACAGAAATGCTTGGAAG
178-188
TGLA227 18 Forward = CGAATTCCAAATCTGTTAATTTGCT Reverse = ACAGACAGAAACTCAATGAAAGCA
76-102
1
Creole cattle are similar to those from other American Creole and Iberian cattle breeds studied with microsatellite markers from the same FAO and ISAG references lists. For example, Zamorano et al. (1998a) studied Argentinean Creole cattle from Patagonia and found that the expected heterozygosity per locus was between 0.46 and 0.72 while in a different study the same workers (Zamoranoet al., 1998b) found an expected heterozygosity of 0.60 for the
Andalusian breed `Berrenda en Negro’, a proposed ances-tral breed of American Creole cattle. In an analysis of six Spanish native breeds, Martín-Burrielet al. (1998) found an average expected heterozygosity between 0.56 and 0.68, depending on the breed. In addition, Rendoet al. (2004) found an expected heterozygosity of between 0.69 and 0.76 in four Western Pyrenean cattle breeds, while a study by Mateuset al. (2004) of 15 Portuguese cattle breeds found
Table 2- Marker name, alleles detected (in base pairs) and their frequencies.
Marker name and number of alleles (bp)
Frequency Marker name and number of alleles (bp)
Frequency Marker name and number of alleles (bp)
Frequency
BM8125 BM1314 BM1818
116 0.6316 155 0.0294 260 0.2857
122 0.3684 157 0.4118 262 0.1071
159 0.4412 264 0.5357
161 0.1176 268 0.0714
BM2113 CSSM66 ETH10
126 0.3611 179 0.0294 213 0.0938
128 0.0556 181 0.2059 217 0.4375
134 0.1111 183 0.0882 219 0.4688
136 0.1389 187 0.3235
138 0.2778 189 0.1471
140 0.0556 195 0.0882
197 0.1176
ILSTS011 INRA32 INRA37
264 0.1000 180 0.2727 114 0.1176
268 0.4000 182 0.2727 126 0.0882
270 0.3000 184 0.4545 128 0.0294
272 0.2000 132 0.3824
136 0.3824
MM12 CSRM60 HAUT27
115 0.1053 93 0.5526 140 0.0417
119 0.2632 97 0.1579 144 0.0417
131 0.6316 99 0.0526 148 0.6250
103 0.1842 150 0.1667
105 0.0526 154 0.1250
HEL13 HEL9 ILSTS006
184 0.0417 151 0.2368 289 0.5000
188 0.1250 159 0.2368 291 0.1071
192 0.8333 161 0.1579 295 0.0714
163 0.1579 297 0.3214
165 0.2105
INRA063 TGLA227
173 0.3529 85 0.1053
175 0.0882 89 0.3158
181 0.5588 91 0.0526
93 0.3421
95 0.1316
97 0.0263
an average expected heterozygosity of between 0.63 and 0.74.
However, the heterozygosity found in our sample of Uruguayan Creole bulls is considerably higher in compari-son to that found in studies on commercial breeds that used similar microsatellites. For example, Hansliket al. (2000) found an average expected heterozygosity of 0.43 in the Holstein-Friesian population of the United States and of 0.48 in the original Netherlands population, while MacHugh et al. (1994) detected average heterozygosity levels of between 0.40 and 0.49 in six European commer-cial breeds (Aberdeen Angus, Charolais, Holstein-Friesian, Hereford, Jersey and Simmental) using a set of 12 micro-satellite markers. These studies show that highly selected commercial breeds are much less diverse and more inbred than local breeds, what reinforces the importance of local breeds as reserves of genetic diversity for a sustainable ag-riculture.
Microsatellites give more exact and unbiased estima-tions of populational genetic diversity than other molecular markers with less polymorphism (Kantanenet al., 2000; Lirónet al. 2002). Our present analysis contributes to the genetic characterization and conservation management strategies of the Uruguayan Creole cattle population.
In conclusion, the sample of Uruguayan Creole breeding bulls in the genetic reserve showed high levels of genetic diversity. Since the bulls studied represent the male parents of future generations, it should be possible to main-tain an adequate level of genetic diversity in the reserve for
the next few years. Future population viability analysis (Lacy, 1993) will help determine if this number of males is appropriate for sustaining the development of the reserve. Further analysis of other age-sex categories and of the re-serve as a whole will reveal the diversity and genetic struc-ture of the population and will yield the necessary data for achieving characterization and conservation goals.
Acknowledgments
The authors thank to Sra. Iris Hernández for her tech-nical assistance, Dr. MV. Marcela Silveira and personal of Servicio de Parques del Ejército (SEPAE) for their work and sample collection and Dr. Juan Vicente Delgado of CYTED (Ciencia y Tecnología para el Desarrollo) for par-tial financial support of the automatic genotyping system. This work was also supported by grants from PEDECIBA (Programa de Desarrollo de las Ciencias Básicas), CSIC (Universidad de la República) and CIDEC (Facultad de Veterinaria).
References
Arredondo, H (1958) Santa Teresa y San Miguel. La restauración de las fortalezas. La formación de sus parques. Imprenta “El Siglo Ilustrado”, Montevideo. Biblioteca Nacional, Monte-video, Uruguay.
Barendse W, Vaiman D, Kemp SJ, Sugimoto Y, Armitage SM, Williams JL, Sun HS, Eggen A, Agaba M, Aleyasin SA, Band M, Bishop MD, Buitkamp J, Byrne K, Collins F, Coo-per L, Coppettiers W, Denys B, Drinkwater RD, Easterday
Table 3- Marker name, number of alleles, heterozygosity and polymorphic information content (PIC) of theamarkers studied.
Heterozygosity
Marker name Number of alleles Expected (He) Expected unbiased (Heu) Observed (Ho) PIC
BM8125 2 0.465 0.478 0.316 0.357
BM1314 4 0.621 0.640 0.647 0.549
BM1818 4 0.615 0.638 0.500 0.585
BM2113 6 0.755 0.776 0.778 0.750
CSSM66 7 0.801 0.825 1.000 0.794
ETH10 3 0.580 0.599 0.563 0.493
ILSTS011 4 0.700 0.737 0.500 0.661
INRA32 3 0.645 0.675 0.727 0.603
INRA37 5 0.685 0.706 0.706 0.642
MM12 3 0.521 0.535 0.526 0.464
CSRM60 5 0.630 0.647 0.632 0.615
HAUT27 5 0.563 0.587 0.417 0.539
HEL13 3 0.288 0.301 0.333 0.266
HEL9 5 0.794 0.815 0.737 0.781
ILSTS006 4 0.630 0.653 0.286 0.623
INRA63 3 0.555 0.572 0.412 0.549
TGLA227 7 0.751 0.771 0.842 0.743
K, Elduque C, Ennis S, Erhardt G, Ferretti L, Flavin N, Gao Q, Georges M, Gurung R, Harlizius B, Hawkins G, Hetzel J, Hirano T, Hulme D, Jorgensen C, Kessler M, Kirkpatrick BW, Konfortov B, Kostia S, Kuhn C, Lenstra JA, Leveziel H, Lewin HA, Leyhe B, Lil L, Burriel IM, McGraw RA, Miller JR, Moody DE, Moore SS, Nakane S, Nijman IJ, Olsaker I, Pomp D, Rando A, Ron M, Shalom A, Teale AJ, Thieven U, Urquhart BGD, Vage DI, VandeWeghe A, Varvio S, Velmala R, Vikki J, Weikard R, Woodside C, Womack JE, Zanotti M and Zaragoza P (1997) A me-dium-density genetic linkage map of the bovine genome. Mamm Genome 8:21-28.
Belkhir K, Borsa P, Goudet J, Chikhi L and Bonhomme F (1998) GENETIX, logiciel sous WindowsTM pour la génétique des populations. Laboratoire Génome et Populations, CNRS UPR 9060, Université de Montpellier II, Montpellier, Fran-ce.
http://www.univ-montp2.fr/~genetix/genetix/genetix.htm.
Botstein D, White RL, Skolnick M and Davis RW (1980) Con-struction of a genetic linkage map in man using restriction fragment length polymorphisms. Am J Hum Genet 32:314-331.
Food and Agriculture Organization (FAO) (1999), Domestic Ani-mal Diversity Information System (DAD-IS); http//www. fao.org/dad-is
Hanslik S, Harr B, Brem G and Schlötterer C (2000) Micro-satellite analysis reveals substantial genetic differentiation between contemporary New World and Old World Hol-stein-Friesian populations. Anim Genet 31:31-38.
Hartl DL (1988) A Primer of Population Genetics. 2nd edition. Sinauer Associates Inc., Sunderland, Massachusetts, 305 pp.
John S, Weitzner G, Rozen R and Scriver C (1991) A rapid proce-dure for extracting genomic DNA from leukocytes. Nucleic Acids Res 19:408.
Kantanen J, Olsaker I, Holm LE, Lien S, Vilkki J, Brusgaard K, Eythorsdottir E, Danell B and Adalsteinsson S (2000) Ge-netic diversity and population structure of 20 North Euro-pean cattle breeds. J Hered 91:446-457.
Kappes SM, Keele JW, Stone RT, McGraw RA, Sonstegard TS, Smith TPL, Lopez-Corrales NL and Beattie CW (1997) A second-generation linkage map of the bovine genome. Ge-nome Res 7:235-249.
Lacy RC (1993) Population viability analysis. In: Kreeger T (ed) VORTEX Users Manual. AStochastic Simulation of the Ex-tinction Process. Captive Breeding Specialist Group of the IUCN Species Survival Comission. Chicago, USA, 96 pp.
Lirón JP, Ripoli MV, De Luca JC, Peral-García P and Giovam-battista G (2002) Análisis of genetic diversity and popula-tion structure in Argentine and Bolivian Creole cattle using
five loci related to milk production. Genet Mol Biol 25:413-419.
Mac Hugh DE, Loftus RT, Bradley DG, Sharp PM and Cunnin-gham P (1994) Microsatellite DNA variation within and among European cattle breeds. Proc R Soc Lond 256:25-31. Martín-Burriel I, García-Muro E and Zaragoza P (1998) Genetic
diversity analysis of six Spanish native cattle breeds usind microsatellites. Anim Genet 30:177-182.
Mateus JC, Eding H, Penedo MCT and Rangel-Figueiredo MT (2004) Contributions of Portuguese cattle breeds to genetic diversity using marker-estimated kinships. Anim Genet 35:305-313.
Mommens GW and Coppieters A (1994) Dinucleotide repeat polymorphism at the bovine MM12E6 and MM8D3 loci. Anim Genet 25:368.
Moore SS and Byrne K (1994) Characterization of 65 bovine microsatellites. Mamm Genome 5:84-90.
Nei M (1973) Analysis of gene diversity in subdivided popula-tions. Proc Natl Acad Sci USA 70:3321-3323.
Nei M and Roychoudhury AK (1974) Sampling variances of heterozygosity and genetic distance. Genetics 76:379-390. Postiglioni A, Rincón G, Kelly L, Llambí S, Fernandez G,
D’An-gelo M, Gagliardi G, Trujillo J, de Bethencourt M, Guevara K, Castellano A and Arruga MV (2002) Biodiversidad gené-tica en bovinos Criollos del Uruguay. Análisis con marca-dores moleculares. Archivos de Zootecnia 51:195-202. Primo AT (1992) El ganado bovino ibérico en las Américas: 500
años después. Archivos de Zootecnia 41:421-432.
Raymond M and Rousset F (1995) GENEPOP (version 1.2): Pop-ulation genetics software for exact tests and ecumenicism. J Hered 86:248-249.
Rendo F, Iriondo M, Jugo BM, Aguirre A, Mazón LI, Vicario A, Gómez M and Estonba A (2004) Analysis of the genetic structure of endangered bovine breeds from the Western Pyrenees using DNA microsatellite markers. Biochem Genet 42:99-108.
Rincón G, D’Angelo M, Gagliardi R, Kelly L, Llambí S and Postiglioni A (2000) Genomic polymorphism in Uruguayan Creole cattle using RAPD and microsatellite markers. Res Vet Sci 69:171-174.
Solinas Toldo S and Fries R (1993) Physically mapped, cosmid-derived microsatellite markers as anchor loci on bovine chromosomes. Mamm Genome 4:720-727.
Zamorano MJ, Género ER, Rodero A, Vega Pla JL and Rumiano FJ (1998a) Caracterización genética del ganado bovino Criollo Argentino utilizando microsatélites. Archivos de Zootecnia 47:273-277.
Zamorano MJ, Ruiter J, Rodero A and Vega Pla JL (1998b) Análisis genético de marcadores microsatélites en dos po-blaciones de la raza bovina Berrenda en Negro. Archivos de Zootecnia 47:195-200.