Wild-Type and Tg-SwDI Mice
James L. Searcy1*, Thierry Le Bihan2,3, Natalia Salvadores1, James McCulloch4,5, Karen Horsburgh1,5* 1Centre for Neuroregeneration, University of Edinburgh, Edinburgh, United Kingdom,2SynthSys – Synthetic & Systems Biology, University of Edinburgh, Edinburgh, United Kingdom,3Institute of Structural and Molecular Biology, University of Edinburgh, Edinburgh, United Kingdom,4Centre for Cognitive and Neural Systems, University of Edinburgh, Edinburgh, United Kingdom,5Centre for Cognitive Ageing and Cognitive Epidemiology, University of Edinburgh, Edinburgh, United Kingdom
Abstract
The structural integrity of cerebral vessels is compromised during ageing. Abnormal amyloid (Ab) deposition in the vasculature can accelerate age-related pathologies. The cerebrovascular response associated with ageing and microvascular Abdeposition was defined using quantitative label-free shotgun proteomic analysis. Over 650 proteins were quantified in vessel-enriched fractions from the brains of 3 and 9 month-old wild-type (WT) and Tg-SwDI mice. Sixty-five proteins were significantly increased in older WT animals and included several basement membrane proteins (nidogen-1, basement membrane-specific heparan sulfate proteoglycan core protein, laminin subunit gamma-1 precursor and collagen alpha-2(IV) chain preproprotein). Twenty-four proteins were increased and twenty-one decreased in older Tg-SwDI mice. Of these, increases in Apolipoprotein E (APOE) and high temperature requirement serine protease-1 (HTRA1) and decreases in spliceosome and RNA-binding proteins were the most prominent. Only six shared proteins were altered in both 9-month old WT and Tg-SwDI animals. The age-related proteomic response in the cerebrovasculature was distinctly different in the presence of microvascular Abdeposition. Proteins found differentially expressed within the WT and Tg-SwDI animals give greater insight to the mechanisms behind age-related cerebrovascular dysfunction and pathologies and may provide novel therapeutic targets.
Citation:Searcy JL, Le Bihan T, Salvadores N, McCulloch J, Horsburgh K (2014) Impact of Age on the Cerebrovascular Proteomes of Wild-Type and Tg-SwDI Mice. PLoS ONE 9(2): e89970. doi:10.1371/journal.pone.0089970
Editor:Ken Arai, Massachusetts General Hospital/Harvard Medical School, United States of America
ReceivedNovember 12, 2013;AcceptedJanuary 23, 2014;PublishedFebruary 26, 2014
Copyright:ß2014 Searcy et al. This is an open-access article distributed under the terms of the Creative Commons Attribution License, which permits unrestricted use, distribution, and reproduction in any medium, provided the original author and source are credited.
Funding: The authors would like to acknowledge funding from the Alzheimer Society (http://www.alzheimers.org.uk/site/scripts/documents_info. php?documentID = 1742) and Alzheimer’s Research UK (http://www.alzheimersresearchuk.org/project-detail/10026/Linking-Alzheimers-and-vascular-disease/). The research is also performed under the aegis of the Centre for Cognitive Aging and Cognitive Epidemiology (part of the Lifelong Health and Wellbeing initiative of UK Research Councils). TLB is funded by SynthSys which is a Centre for Integrative Systems Biology (CISB) funded by BBSRC (http://www.bbsrc.ac.uk/funding) and EPSRC (http://www.epsrc.ac.uk/research/Pages/research.aspx); reference BB/D019621/1. NS is funded by a doctoral fellowship from AXA Research Fund (http://www.axa-research.org/). The funders had no role in study design, data collection and analysis, decision to publish, or preparation of the manuscript.
Competing Interests:The authors have declared that no competing interests exist.
* E-mail: Luke.Searcy@ed.ac.uk (LS); Karen.Horsburgh@ed.ac.uk (KH)
Introduction
The structural integrity of the cerebrovasculature is altered during ageing. These changes can be accelerated by vascular pathologies, most notably cerebral amyloid angiopathy (CAA) [1], [2], [3], [4], [5], [6], [7]. Ageing alone can lead to vessels supplying deep white matter to become tortuous. Thickening of the veins and venules is also commonly observed along with increased thickening of the basement membrane [1]; [8]. A decline in vascular density, specifically capillary loss, has been observed in both the elderly and aged animal models [9], [10] along with increases in arteriole and capillary diameter [11]. Many of these same age-related pathologies are recapitulated in brains with CAA, which is relatively common in the elderly population, presenting in 10–40% of the non-demented individuals over the age of 60 [12]. CAA can be categorized into two types identified pathologically by the accumulation of Abin leptomeningeal and cortical vessels including capillaries (Type 1) or with the exception of capillaries (Type 2) [13], [14]. CAA can lead to the loss of smooth muscle cells and thickening of the vessel walls, which in turn causes the blood vessel to become compromised, leading to intracerebral hemorrhage [15].
The presence of Ableads to very different protein changes that are independent of age. This includes the modulation of proteins that are involved in movement, aggregation and degradation of Ab. APOE is a protein that is intimately involved in all of these processes [16]: the expression of the APOE4 allele leads to a propensity for increased Abaggregation in sporadic AD [17] and increased risk of Abdeposition in capillaries [13]. APOE plays a direct role in Abefflux across the blood brain barrier to circulating plasma [18], [19], and its overexpression promotes Abproteolysis via enzymes such as neprilysin and insulin degrading enzyme [20]. Overexpression of neprilysin and insulin degrading enzyme decrease Ab levels in transgenic amyloid precursor protein (APP) mouse models and improve cognition [21].
of Ab. This latter accumulation of Abis potentially attributed to properties of the mutant Abpreventing normal clearance [24].
As the Ab accumulates over time, it associates closely with microvessels, (seen in Type 1 CAA) and is primarily fibrillar in nature [23], [25]. This microvascular deposition is closely associated with an increased inflammatory response [23]. These alterations observed in the Tg-SwDI, resulting from advancing age and accumulating Ab, should be underpinned by changes in various proteins, including those associated with the neurovascular unit and the blood brain barrier [7], [26], [27], [28], [29] yet the scope of these changes are not fully understood.
To better understand how cerebral vessels globally respond to both age and accumulating Ab, we have used a quantitative label-free proteomics approach to investigate the proteomic signatures of vessel-enriched fractions from the brains of WT and Tg-SwDI mice at 3 and 9 months of age. Our vascular-focused approach has revealed distinctly different protein expression patterns as a result of age in the presence of microvascular Abaccumulation.
Materials and Methods
Ethics Statement
All procedures were authorized under the Home Office approved project license number 60/3722. This license was approved by the University of Edinburgh’s Ethical Review Committee and the Home Office and adhered to regulations specified in the Animals (Scientific Procedures) Act (1986).
Animals
Tg-SwDI mice were obtained from Jackson Laboratories (Bar Harbour, MA). These mice were generated and previously described [23] on a C57Bl/6J background. Homozygous Tg-SwDI mice were bred and maintained. C57Bl/6J (WT) mice were obtained from Jackson laboratories through their UK distributor Charles River.
Vessel Enrichment
Vessels were enriched using a protocol based on 2 sources [30], [31]. Hemibrains were homogenized in 1 mL of ice-cold PBS using a loose fit dounce homogenizer using 15 strokes. Homog-enates were transferred to a 15 mL falcon tube and centrifuged for 10 minutes at 2506g. The pellet was re-suspended in 17.5% Ficoll solution (Sigma) and centrifuged for 25 minutes at 3,2006g to
collect the pellet (vessel containing S1 fraction), which was retained on ice. The supernatant was centrifuged again for 25 minutes at 32006g to collect a second pellet and the pellets from both spins
were combined in 1 mL of 1% BSA-PBS and re-suspended. The suspension was centrifuged for 10 minutes at 20006g. The pellet was subsequently washed in 1 mL of ice-cold PBS before being flash-frozen on dry ice and later stored at 270uC until further processing.
Immunoblots
S1 fractions obtained from hemibrains of 3 month-old WT mice (n = 3) for vessel enrichment confirmation were homogenized in a lysis buffer of 9 M Urea/4% CHAPS with Complete Protease Inhibitor Cocktail (Roche, Manheim, Germany). Protein levels were determined using a Pierce BCA protein assay kit (Thermo Scientific, Cramlington, Northumberland, UK). Proteins were separated by SDS–PAGE and transferred onto nitrocellulose membranes.
S1 fractions obtained from hemibrains of 3, 12 and 17 month-old Tg-SwDI mice (n = 4/group) for APOE and HTRA1 confirmation were homogenized in a sucrose buffer with Complete
Protease Inhibitor Cocktail (Roche, Manheim, Germany). Protein levels were determined as above and proteins were separated by SDS–PAGE and transferred onto PVDF membranes (Bio-Rad, Germany).
Immunoblotting was performed using the Odyssey Infrared Imaging System (LiCor Biosciences, Lincoln, NE, USA). Mem-branes were blocked in Odyssey blocking buffer (diluted 1:1 with phosphate-buffered saline) and washed in phosphate-buffered saline–TweenH (phosphate-buffered saline with 0.1% Tween). Primary antibodies were detected using fluorescently labelled secondary antibodies (LiCor Biosciences). Proteins were visualized by scanning antibody-labelled blots in the Odyssey Imager under the appropriate channel. Antibodies for immunoblotting were as follows: Platelet endothelial cell adhesion molecule (PECAM), smooth muscle actin (SMA), glial fibrillary acid protein (GFAP) (AbCam, Cambridge, UK), Occludin (Invitrogen, Camarillo, CA, USA).
Cerebral Vessel AbLevels
Total Ab was extracted from independent S1 fractions taken from independent cohorts of 3, 12 and 17 month-old Tg-SwDI mice (n = 4/group) using a homogenisation buffer of the following constituents: 5 M guanidine and 50 mM Tris/HCL and mixed for 3–4 hours at RT and later stored at220uC. The solution was diluted 1:10 in ice-cold reaction buffer of the following constitu-ents: 0.2 g/L KCL, 0.2 g/L KH2PO4, 8 g/L NaCl, 1.15 g/L Na2HPO4, 5% BSA, 0.03% Tween 20 and 1X protease inhibitor cocktail (Calbiochem). The solution was centrifuged at 16,0006g for 20 minutes at 4uC. Protein levels were quantified with Pierce BCA Protein Assay Kit (Thermo Scientific). Ab1-40 levels were measured using the Invitrogen Human Ultrasensitive ELISA kit (Life Technologies, Paisley, UK) following the manufacturer’s instructions.
LC-MS Analysis of Vessel-enriched Fractions
All chemicals were purchased from Sigma-Aldrich (UK) unless otherwise stated. Acetonitrile and water for LC-MS/MS and sample preparation were HPLC quality (Fisher, UK). Formic acid was Suprapure 98–100% (Merck, Darmstadt, Germany) and trifluoroacetic acid was 99% purity sequencing grade. Trypsin and Lys-C (modified, sequencing grade) were purchased from Roche Diagnostics (West Sussex, UK). All HPLC-MS connector fittings were from Upchurch Scientific or Valco (Hichrom and RESTEK, UK).
100mg of protein extract from the vessel-enriched fractions from 3 and 9 month-old, Tg-SwDI and WT mice (n = 7–8/group) was re-suspended in 45mL of 8 M urea, 2.5mL of 200 mM DTT and 5mL of 1 M ammonium bicarbonate. The samples were reduced at room temperature for 30 minutes, and then 2.5mL of 500 mM iodoacetamide was added. 0.5mg of Lys-C was added and digested overnight in 6 M urea followed by dilution to 2 M urea and overnight digestion with 2mg of trypsin.
Capillary-HPLC –MSMS data were collected on an online system consisting of a micropump (1200 binary HPLC system, Agilent, Edinburgh, UK) coupled to a hybrid LTQ-Orbitrap XL instrument (Thermo-Fisher, Loughborough, UK). HPLC-MS methods have been described previously [32]. Peptides were reconstituted in 10mL of loading buffer before injection and 8mL was loaded. The peptide mixture was separated using a 140 min gradient form 0% to 100% Buffer B (Buffer A: 2.5% acetonitrile 0.1% formic acid and buffer B 90% acetonitrile, 0.025% trifluoracetic acid, and 0.1% formic acid).
resolution followed by 5 MS/MS scans in the linear ion trap on the most abundant ions and dynamic excluded for 120 seconds.
Protein Identification and Quantification
Conversions from RAW to MGF files were performed as described previously [32], [33]. MS/MS data were searched using MASCOT Versions 2.3 (Matrix Science Ltd., London, UK) against a mouse plus contaminant database downloaded from
NCBI with 30,061 sequences (From 12 January 2011) and amended with human APP with the Swedish, Dutch and Iowa mutations due to the transgenic nature of the mouse model. Variable methionine oxidation, STY phosphorylation, protein N-terminal acetylation, and fixed cysteine carbamidomethylation were used in all searches. Precursor mass tolerance was set to 7 ppm and MS/MS tolerance to 0.4 amu. LC-MS label-free protein Figure 1. Vessel fractions are enriched in vascular-associated proteins.S1 fractions were enriched in proteins associated with various cellular compartments of cerebral vessels as demonstrated by increased levels of Occludin, PECAM, SMA and GFAP. a-tubulin showed similar expression across all blots. (A–D) Levels of selected proteins (relative to respectivea-tubulin levels) were all significantly enriched in the S1 fraction compared to whole brain samples (n = 3/gp; p,0.001; t-test). WB = whole brain fraction; S1 = vessel-enriched fraction.
abundance data derived from MS-speak data were calculated using Progenesis software.
Regarding the label free quantification, the total number of Features (i.e. intensity signal at a given retention time and m/z) was reduced to MS/MS peaks with charge of 2, 3, or 4+and we only kept the five most intense MS/MS spectra per ‘‘Feature’’. The subset of multi-charged ions (2+, 3+ and 4+) was extracted from each LC-MS run and the ions intensities summed for normalization. Protein quantification was performed as follows; for a specific protein, the associated unique peptide ions were summed to generate an abundance value. The final list of measured protein abundances were transformed using an ArcSinH function (as the method of detection can generate a significant amount of near zero measurement for which a log transform is not ideal). The within group means were calculated to determine the fold change and the transformed data was then used to calculate the p-values. Differentially expressed proteins were considered most meaningful under the following conditions: Only proteins detected by two or more peptides and p,0.01 associated with the protein change. Gene Ontology Analysis
Proteins found to be significantly different at p,0.01 within the WT and Tg-SwDI cohorts were uploaded to WebGestalt Gene Set Analysis Toolkit version 2 (http://bioinfo.vanderbilt.edu/ webgestalt, Vanderbilt University) for enrichment analysis based on gene ontology [34], [35]. Cut-off criteria included a p,0.01 adjusted with hypergeometric statistical analysis using Benjamini & Hochberg multiple test adjustment with a minimum molecule cut-off of 2.
KEGG Pathway Analysis
For pathway analysis, the p-value threshold was set at p,0.05 to strengthen network analysis. Proteins found to be significantly different at p,0.05 within the WT and Tg-SwDI cohorts were uploaded to WebGestalt Gene Set Analysis Toolkit version 2 for enrichment analysis based on the Kyoto Encyclopedia of Genes and Genomes (KEGG) pathway maps using the same criteria above.
Immunohistochemistry
At 3 and 9 months of age, Tg-SwDI and WT mice were deeply anaesthetised with 5% isoflurane and transcardially perfused with 20 ml 0.9% heparinized phosphate buffered saline followed by 20 ml of 4% paraformaldehyde in 0.1% phosphate buffer. Brains were removed and post-fixed in 4% PFA over-night and paraffin embedded.
Coronal tissue sections from each respective cohort were deparaffinized using standard procedures. Briefly, sections were incubated at 60uC for 30 minutes, followed by further dewaxing in xylene. Slides were then placed sequentially in 100%, 90% and finally 70% alcohol before being rinsed in running water. Sections were processed for antigen retrieval by being incubated in 10 mM citric acid for 10 minutes at 100uC in a pressurized retrieval machine. For APOE immunostaining sections were blocked with normal donkey serum and incubated sequentially with goat polyclonal APOE (Calbiochem) along with mouse monoclonal b-dystroglycan (Leica Microsystems) followed by Alexa Flour488H -labelled mouse monoclonal 6E10 (Covance) overnight at 4uC. APOE andb-dystroglycan were visualized with Cy3-labelled and Cy5-labelled secondary antibodies respectively. For HTRA1 immunostaining sections were blocked with normal goat serum and incubated sequentially with rabbit polyclonal HTRA1 (Abcam) along with mouse monoclonal b-dystroglycan (Leica Microsystems), followed by Alexa Flour488H-labelled mouse monoclonal 6E10 (Covance) overnight at 4uC. HTRA1 and b-dystroglycan were visualized with Alexa Flour 546 and 646 respectively. Sections were analyzed using a laser scanning confocal microscope (Leica SP5). All images were acquired with a 406oil-immersion objective within the thalamus. Image analysis was carried out using NIH image J 1.47d software.
Statistical Analysis
Data were analysed using student’s t-test or one-way ANOVA where experimental design exceeded 2 comparisons. For the LC-MS data significance was set at p,0.01. For all other analyses significance was set at p,0.05.
Table 1.Proteins significantly increased in older wild-type mice (9 months) relative to young wild-type mice (3 months).
Description - 9 month Wt vs 3 month WT Accession p-value Fold Change
basement membrane-specific heparan sulfate proteoglycan core protein gi_183979966 0.000007 2.68
myelin-associated oligodendrocyte basic protein isoform b gi_86355503 0.00001 2.35
collagen alpha-2(IV) chain preproprotein gi_226437587 0.00003 2.83
tubulointerstitial nephritis antigen-like precursor gi_270132817 0.00004 2.88
laminin subunit gamma-1 precursor gi_153791270 0.0001 2.55
laminin subunit beta-2 precursor gi_31982223 0.0002 2.42
glycerol-3-phosphate dehydrogenase 1-like protein gi_257467604 0.0003 1.82
histone H1.4 gi_13430890 0.0003 2.31
nidogen-1 precursor gi_171543883 0.0003 2.12
agrin gi_42490751 0.0003 2.00
myelin-oligodendrocyte glycoprotein gi_113199771 0.0004 1.90
histone H2A type 2-A gi_20799907 0.0006 1.92
claudin-11 gi_6679186 0.001 1.74
synaptic vesicle membrane protein VAT-1 homolog gi_33859662 0.001 1.59
myelin basic protein isoform 1 gi_69885032 0.001 1.48
moesin gi_70778915 0.001 1.61
fibrinogen gamma chain precursor gi_19527078 0.001 8.77
3-ketoacyl-CoA thiolase, mitochondrial gi_29126205 0.001 1.51
receptor expression-enhancing protein 5 gi_161016826 0.001 1.48
vimentin gi_31982755 0.001 1.66
myelin proteolipid protein gi_23956058 0.002 1.83
cysteine and glycine-rich protein 1 gi_6681069 0.002 1.56
solute carrier family 2, facilitated glucose transporter member 1 gi_165377226 0.002 1.51
nidogen-2 precursor gi_84370361 0.002 2.23
D-3-phosphoglycerate dehydrogenase gi_52353955 0.002 1.55
coronin-2B gi_148528987 0.002 1.81
peroxiredoxin-6 gi_6671549 0.003 1.33
glycerol-3-phosphate dehydrogenase, mitochondrial precursor gi_224922803 0.003 1.57
peptidyl-prolyl cis-trans isomerase FKBP1A gi_6679803 0.003 1.63
voltage-dependent anion-selective channel protein 3 isoform 2 gi_6755967 0.003 1.54
microtubule-associated protein 1A isoform 1 gi_124244033 0.003 1.61
voltage-dependent anion-selective channel protein 2 gi_6755965 0.003 1.61
tubulin beta-2C chain gi_22165384 0.003 1.63
myosin-11 isoform 1 gi_241982716 0.003 2.12
CD9 antigen gi_6680894 0.003 2.18
succinyl-CoA ligase [GDP-forming] subunit alpha, mitochondrial precursor gi_255958286 0.003 1.94
multidrug resistance protein 3 gi_153791547 0.003 1.48
acyl-CoA-binding protein isoform 2 gi_6681137 0.004 1.72
mesotrypsin gi_6755891 0.004 1.80
alpha-internexin gi_148539957 0.004 1.49
contactin-associated protein 1 precursor gi_116063560 0.004 1.52
dihydropteridine reductase gi_21312520 0.004 1.56
histone H1.0 gi_31560697 0.004 1.83
aldehyde dehydrogenase, mitochondrial precursor gi_6753036 0.004 1.56
histone H1.2 gi_9845257 0.005 1.78
band 3 anion transport protein gi_6755560 0.005 2.44
profilin-2 gi_9506971 0.005 1.51
peroxiredoxin-2 gi_148747558 0.006 1.45
guanine nucleotide-binding protein G(i) subunit alpha-2 gi_41054806 0.006 1.41
Results
Vessel Enrichment: S1 Fractions are Enriched in Vessel-associated Proteins
Vascular enrichment was conducted using modifications of previously published protocols [30], [31]. To verify that there was vascular enrichment, S1 fractions from 3 month-old WT mice (n = 3) were compared to whole brain (WB) fractions and the levels of four cerebrovascular-associated proteins were measured. These proteins were selected due to their critical importance in multiple cellular compartments of cerebral vessels; a marker of vascular smooth muscle (SMA); a marker of endothelial tight junctions (occludin), an endothelial marker (PECAM) and a marker of astrocytes (GFAP). The data demonstrated that S1 fractions were enriched by 3–12 fold [Occludin (7 fold), PECAM (11 fold), SMA (12 fold), GFAP (3 fold)] (Figure 1).
Temporal Increase in Vascular Ab1-40
The levels of Ab1-40 were measured since this is the most prominent Ab species in the cerebrovasculature of Tg-SwDI animals [23], whose negative charge in its mutant form contributes to its increased pathogenicity [36], [37] and its reduced clearance due to its lower affinity to LRP [38]. As predicted, the mean levels of Ab1-40 (pg/mg of total tissue 6 S.E.M) were significantly higher in vessel fractions from the 12 and 17 month-old Tg-SwDI mice (220.866.29 and 226619.22 respectively) compared to the 3 month-old mice (10.72610.72; p,0.0001; one-way ANOVA). Proteomic Analysis of Vessel Fractions
1024 proteins were identified within the S1 fractions from young and older WT and Tg-SwDI mice. 654 were quantified by at least 2 peptides across all groups (a list of all proteins quantified by 2 peptides can be found in Table S1). The proteomic workflow along with a summary of results is presented (Figure 2).
65 proteins were significantly different (p,0.01) between the 3 month-old WT and 9 month-old WT mice. All of these proteins were up-regulated (Table 1).
45 proteins were found to be significantly different (p,0.01) between the 3 month-old Tg-SwDI and 9 month-old Tg-SwDI mice. 24 proteins were up-regulated and 21 were down-regulated (Table 2).
Of those proteins that were significantly different within the cohorts, only 6 proteins overlapped between the WT and Tg-SwDI cohorts. This indicates differential responses to age within the WT and Tg-SwDI cohorts (Tables 1&2).
KEGG Pathway Analysis
Proteins found to be significantly different (p,0.05) between the 3 month-old and 9 month-old WT animals (178 proteins) along with those significantly different (p,0.05) between the 3 month-old Tg-SwDI and 9 month-month-old Tg-SwDI animals (154 proteins) were uploaded to the WebGestalt Gene Set Analysis Toolkit version 2 for cohort-specific KEGG pathway analysis.
KEGG pathway analysis revealed similar pathways being represented within the WT and Tg-SwDI cohorts. The top biological processes for both cohorts included: metabolic pathways and several neurodegenerative related pathways:Alzheimer’s disease, Parkinson’s disease and Huntington disease (See figure 3). Both 9 month-old WT and 9 month-old Tg-SwDI animals showed up-regulation of proteins represented by the oxidative phosphorylation category as well as thegap junctioncategory. Closer inspection of the proteins contained within certain categories reveal a divergence in the proteins being modulated within the respective cohorts, with only about a third of the proteins being shared withinthe metabolic pathways and oxidative phosphorylation categories. Other categories (e.g.gap junction) show much more convergence.
Age Effects on the WT Vascular Proteome
In WT animals, age led to a marked up-regulation of proteins associated with the basement membrane based on gene ontology (cellular compartment; Figure S1), particularly nidogen-1, base-ment membrane-specific heparan sulfate proteoglycan core protein, laminin subunit gamma-1 precursor and collagen alpha-2(IV) chain preproprotein (Figure 4).
Table 1.Cont.
Description - 9 month Wt vs 3 month WT Accession p-value Fold Change
myelin-associated glycoprotein gi_6754614 0.006 1.50
carbonic anhydrase 2 gi_157951596 0.006 1.74
choline transporter-like protein 1 isoform A gi_227499980 0.007 1.83
60S ribosomal protein L13 gi_33186863 0.007 2.12
hemoglobin subunit beta-1 gi_31982300 0.007 3.97
potassium voltage-gated channel subfamily A member 2 gi_157012015 0.008 1.48
cytochrome c, somatic gi_6681095 0.009 2.16
cytochrome b-c1 complex subunit 8 gi_21539585 0.009 1.41
microtubule-associated protein 6 isoform 1 gi_113204613 0.009 1.54
prohibitin-2 gi_126723336 0.009 1.38
plectin isoform 1d gi_254675251 0.009 1.43
hemoglobin alpha, adult chain 2 gi_145301549 0.009 4.09
tubulin beta-5 chain gi_7106439 0.010 1.53
MOSC domain-containing protein 2, mitochondrial precursor gi_19526848 0.010 1.52
tubulin beta-4 chain gi_31981939 0.010 1.56
Table 2.Proteins significantly increased (positive fold change) and decreased (negative fold change) in older Tg-SwDI mice (9 months) relative to young Tg-SwDI mice (3 months).
Description - 9 month Tg-SwDI vs 3 month Tg-SwDI Accession p-value Fold Change
apolipoprotein E precursor gi_163644329 0.000003 3.86
serine protease HTRA1 precursor gi_229093139 0.000003 6.26
heterogeneous nuclear ribonucleoproteins A2/B1 isoform 2 gi_32880197 0.00003 23.96
heterogeneous nuclear ribonucleoprotein A1 isoform a gi_6754220 0.0001 22.96
heterogeneous nuclear ribonucleoprotein U-like protein 2 gi_124487099 0.0001 23.82
heterogeneous nuclear ribonucleoprotein D0 isoform a gi_116256512 0.0002 23.49
heterogeneous nuclear ribonucleoprotein K gi_13384620 0.0003 23.09
heterogeneous nuclear ribonucleoproteins C1/C2 isoform 1 gi_8393544 0.0003 22.95
heterogeneous nuclear ribonucleoprotein L gi_183980004 0.0003 22.87
CD9 antigen gi_6680894 0.001 2.44
myelin-associated oligodendrocyte basic protein isoform b gi_86355503 0.001 2.24
alpha-crystallin B chain gi_6753530 0.001 2.68
protein kinase C & casein kinase substrate in neurons protein 1 isoform 1 gi_6754974 0.001 2.23
heterogeneous nuclear ribonucleoprotein H gi_10946928 0.001 22.84
CUGBP Elav-like family member 2 isoform 6 gi_124286791 0.001 23.25
alcohol dehydrogenase [NADP+] gi_10946870 0.001 1.84
TAR DNA-binding protein 43 isoform 1 gi_21704096 0.001 22.44
myelin expression factor 2 isoform 1 gi_244790087 0.001 22.57
gap junction alpha-1 protein gi_6753992 0.002 2.19
V-type proton ATPase subunit G 2 gi_12963559 0.002 2.06
serine/arginine-rich splicing factor 7 isoform 1 gi_22122585 0.002 21.67
lupus La protein homolog gi_6678143 0.002 22.32
intercellular adhesion molecule 5 precursor gi_159110562 0.002 2.47
poly(rC)-binding protein 2 isoform 1 gi_157041229 0.003 23.05
matrin-3 gi_25141233 0.003 22.08
heterogeneous nuclear ribonucleoprotein U gi_160333923 0.003 22.13
profilin-1 gi_6755040 0.004 2.20
polypyrimidine tract-binding protein 2 gi_9507003 0.004 23.13
mitochondrial glutamate carrier 2 gi_124486670 0.004 1.96
protein bassoon gi_124487407 0.005 1.90
glial fibrillary acidic protein isoform 2 gi_84000448 0.005 1.85
clathrin light chain A isoform a gi_122939192 0.005 1.66
D-3-phosphoglycerate dehydrogenase gi_52353955 0.005 1.74
heterogeneous nuclear ribonucleoprotein H2 gi_9845253 0.006 22.51
peroxiredoxin-6 gi_6671549 0.006 1.42
vesicle-associated membrane protein-associated protein A gi_94721328 0.007 1.71
vesicle-associated membrane protein-associated protein B gi_31543940 0.007 2.04
KH domain-contain., RNA-binding, signal transduction-assoc. protein 1 gi_110626031 0.007 23.80
proline-rich transmembrane protein 2 gi_156523248 0.008 1.74
heterogeneous nuclear ribonucleoprotein G gi_83699420 0.008 21.80
heterogeneous nuclear ribonucleoprotein R gi_33859724 0.008 22.22
3-ketoacyl-CoA thiolase, mitochondrial gi_29126205 0.009 1.74
heterogeneous nuclear ribonucleoprotein A/B isoform 2 gi_6754222 0.009 22.32
PREDICTED: ras GTPase-activating protein SynGAP gi_309263645 0.009 1.80
myc box-dependent-interacting protein 1 isoform 1 gi_6753050 0.010 1.57
potassium voltage-gated channel subfamily A member 2 gi_157012015 0.010 1.99
Age also led to the up-regulation of several white matter-associated proteins in WT animals (and to a lesser extent in Tg-SwDI animals, including myelin-associated oligodendrocyte basic protein, myelin-oligodendrocyte glycoprotein, myelin proteolipid protein, myelin associated glycoprotein, contactin-associated protein-1 precursor and myelin basic protein isoform 1 (Figure S2).
Age Effects on the Tg-SwDI Vascular Proteome
HTRA1 and APOE were markedly increased in the 9 month-old as compared to 3 month-month-old Tg-SwDI animals (*p,0.0001) (Figure 5A, B). There were no differences detected between 3 month and 9 month-old WT mice. Serine protease HTRA1 was the most up-regulated protein within the Tg cohort (fold
change = 6.26) followed by APOE (fold change = 3. 86). To confirm that these alterations in APOE and HTRA1 were a robust finding and increasing with age, the levels of these proteins were measured by Western blot in separate cohorts to those in which LC-MS was conducted at ages 3, 12 and 17 months (Tg-SwDI n = 4/grp). Immunoblot analysis confirmed a age-depen-dent increase in HTRA1 (*p,0.05; **p,0.01) (Figure 5C) and in APOE levels (p = 0.096) in vascular fractions (Figure 5D). How-ever, there was no correlation between Ab1-40 levels and HTRA1 or APOE levels in the same vessel fractions (Figure 5E, F).
Age led to the extensive down-regulation of several proteins associated with thespliceosome(note figure 3) and RNA processing in the Tg-SwDI animals based on gene ontology (biological Figure 3. KEGG pathway analysis suggests similar patterns of expression.The Kyoto Encyclopedia of Gene and Genomes (KEGG) pathway analysis resulted in similar lists of modulated pathways representing proteins found to be significantly within the different cohorts (p,0.05; t-test). Venn diagrams show divergences in the proteins that make up those pathways. Both WT and Tg-SwDI animals show changes in (A)metabolic pathways, specifically (B)oxidative phosphorylation, though only a third of the modulated proteins represented by the KEGG pathways are shared. The (C) gap junction pathway share many more proteins between WT and Tg-SwDI cohorts.
process; Figure S3). These include several members of the heterogeneous nuclear ribonucleoprotein family of proteins (Figure 6).
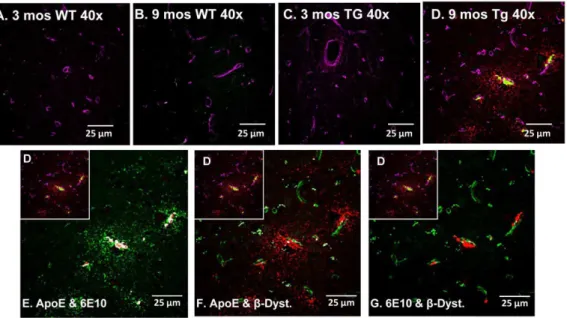
APOE Localizes to Cerebral Vessels and Accumulated Ab Tissue from independent cohorts of 3 old WT, 9 month-old WT, 3 month-month-old Tg-SwDI and 9 month-month-old Tg-SwDI mice were immunolabelled with antibodies tob-dystroglycan, Aband APOE. APOE immunolabelling was mostly observed in 9 month-old Tg-SwDI animals (Figure 7A–D). APOE co-localized to both accumulated Ab and cerebral vessels, particularly those vessels proximate to Abdeposits within the thalamus.
HTRA1 is Located Proximately to Ab-laden Vessels in the Thalamus
Tissue from independent cohorts of 3 old WT, 9 month-old WT, 3 month-month-old Tg-SwDI and 9 month-month-old Tg-SwDI mice (as above) were immunolabelled with antibodies tob-dystroglycan, Aband HTRA1. HTRA1 immunolabelling was mostly observed in 9 month-old WT and Tg-SwDI sections and appeared to be expressed cytoplasmically (Figure8 A–D). Only in 9 month-old Tg-SwDI mice was HTRA1 found to be located proximately to Ab-laden vessels (Figure 8E–J) within the thalamus and appeared extracellular.
Discussion
Brain ageing leads to alterations in the protein components of the cerebrovascular milieu, which can lead to changes in vascular integrity and decreased functioning of the NVU and the BBB [6], [7], [8]. Pathological insults such as CAA can accelerate these changes, [39] [40], [41]. Quantitative proteomics allowed an
in-depth and global investigation of the protein profiles of the cerebrovascular milieu of WT and Tg-SwDI animals at distinctly different ages. We were able to identify proteins that might be contributing to these age-dependent changes by looking specifi-cally at vascular enriched fractions. These vascular fractions were enriched in proteins associated with cerebral vessels (PECAM, occludin, SMA, GFAP, ABCB1A, nidogen, claudin 11 and AQP4, Table S1) using techniques similar to those used under physiolog-ical conditions [31] and in genetphysiolog-ically altered models with cerebral haemorrhage propensity [42].
The number of proteins that were changed between the 3 and 9 month-old WT animals (n = 65) and the 3 and 9 month-old Tg-SwDI animals (n = 45) were substantial in number, yet the protein lists generated from the two cohorts had very little overlap, suggesting that age affected the vascular proteomic profile of the WT and Tg-SwDI animals in very different ways. We hypothe-sized that age would have a differential effect on the cerebrovas-cular proteome in the presence of microvascerebrovas-cular Ab.
KEGG pathway analysis suggested that many of the pathways enriched by significantly modulated proteins were in fact very similar between the WT and Tg-SwDI cohorts. Further scrutiny of these revealed minimal overlap of the proteins the categorical terms represented, again confirming differential regulation of protein expression within the two cohorts. Examples of this include two of the most significantly enriched pathways for both WT and Tg-SwDI cohorts: metabolic pathways and oxidative phosphorylation indicating changes in multiple mitochondrial proteins. Only 30% of those mitochondrial proteins that were found to be differentially modulated with the cohorts overlapped.
Despite the lack of overlap, modulations of mitochondrial proteins are of great importance to age-related vascular changes. The cerebrovasculature endothelium is highly enriched in Figure 4. Age effects on the WT vascular proteome.4 selected basement membrane proteins were significantly up-regulated in 9 month-old WT animals by at least 2 fold (Mean abundance6S.E.M.; ***p,0.001; t-test). No significant difference was observed in the Tg-SwDI animals for these same proteins.
mitochondria due to the high energy demands required for neurovascular coupling [43] as well as for the multitude of ATP-dependent transporters at the BBB required for bidirectional transport of molecules to the brain [6]. Mitochondrial dysfunction is associated with both brain ageing and accumulating Aband is closely linked to increases in oxidative stress [44], [45], [46], [47]. Such modulations like those observed in the older WT and Tg-SwDI animals suggest that the age does lead to changes in the
expression of certain mitochondrial proteins, especially those that make up the electron transport chain.
Basement membrane thickening due to increases in proteins such as collagen has been observed with age and AD [8], [48], [49]. Of the 65 proteins up-regulated in 9 month-old WT animals, 10% are intimately linked to the basement membrane (nidogen-1, nidogen-2, laminin subunit gamma-1 precursor, collagen alpha-2(1V) chain preproprotein, laminin subunit beta-2 precursor, Figure 5. Age effects on the Tg-SwDI vascular proteome.(A) Serine protease HTRA1 and (B) Apolipoprotein E were significantly different between 3 month-old and 9 month-old Tg-SwDI animals (Mean abundance6S.E.M; ***p,0.0001; t-test), whereas no differences were detected between the WT animals of the same age. Serine protease HTRA1 was the most up-regulated protein within the Tg cohort (fold change = 6.26) followed by APOE (fold change = 3. 86). In separate cohorts to those used for LC-MS, immunoblot analysis of 3, 12 and 17 month-old Tg-SwDI animals (n = 4/grp, representative blots shown below respective cohort) confirmed an age-dependent increase in (C) HTRA1 (Mean relative intensity6S.E.M; *p,0.05; **p,0.01, one-way ANOVA, Bonferroni post-test) and in (D) APOE levels (Mean relative intensity6S.E.M; p = 0.097, one-way ANOVA). No correlation could be made between Ab1-40 levels and (E) HTRA1 or (F) APOE levels in the same vessel fractions.
basement membrane specific heparin sulphate proteoglycan core protein, agrin). At 9 months of age the mice are not aged by convention, yet there is still evidence of a temporal increase in key basement membrane proteins over a 6 month period. This increase is not seen in the Tg-SwDI mice. Instead, comparison of these protein levels across all 4 groups indicates the abundance of these same proteins is typically greater in 3 month-old Tg-SwDI
animals as compared to 3 month-old WT animals (Figure 4) and remained stable as the animals aged and Abaccumulated.
In the present study, alterations in protein signatures were studied in vascular-enriched fractions which allows for the identification of proteins in cellular compartments in close association with the vasculature. Notably white matter-associated proteins were identified and found to be altered in older WT and Figure 6. Age effects on the Tg-SwDI vascular proteome.Multiple heterogeneous nuclear ribonucleoproteins were down-regulated in 9 month-old Tg-SwDI animals (Mean abundance6S.E.M; ***p,.001; **p,0.01; t-test) compared to younger animals. No significant difference was observed in the WT cohort.
Figure 7. Increases in APOE levels are specific to 9 mos Tg-SwDI mice.Tissue sections representative of independent 3 and 9 month-old WT (A&B) and 3 and 9 month-old Tg-SwDI (C&D) animals were triple-labelled with APOE (red), 6E10 (green) andb-dystroglycan (magenta) and analysed with a laser scanning confocal microscope within the thalamus (4006). Immunohistochemical analysis of the four different cohorts show APOE and Abpresent only in the (D) 9 month Tg-SwDI animals. APOE co-localized (shown in white) with both (E) 6E10-labelled Aband (F)b -dystroglycan-labelled cerebral vessels. (G) Abis closely associated with cerebral vessels.
doi:10.1371/journal.pone.0089970.g007
Figure 8. HTRA is located proximately to Ab-laden vessels in the thalamus of 9 mos Tg-SwDI mice.Tissue sections representative of independent 3 and 9 month-old WT (A&B) and 3 and 9 month-old Tg-SwDI (C&D) animals were triple-labelled with HTRA1 (red), 6E10 (green) andb -dystroglycan (magenta) and analysed with a laser scanning confocal microscope (4006). Immunohistochemical analysis of the four different cohorts show HTRA1 closely associated with Ab-laden vessels [white arrow, (D)] within the thalamus of 9 month-old Tg-SwDI mice (E–J) and appeared extracellular.
TgSWDI mice as compared to the respective younger cohorts. This included the significant up-regulation of myelin-oligodendro-cyte glycoprotein, myelin proteolipid protein, myelin associated glycoprotein, contactin-associated protein-1 precursor and myelin basic protein isoform 1 in older WT mice. Only myelin-associated oligodendrocyte basic protein, the third most prevalent protein in myelin [50] was found to be significantly up-regulated in both older WT and Tg-SwDI mice. Furthermore, in older Tg-SwDI mice, a down-regulation in myelin expression factor 2 isoform 1, a suppressor of MBP expression [51] was observed, which was not seen in the older WT mice. This is an indication that these white matter-associated proteins are differentially altered in older WT mice as compared to those found to be altered in the older TgSWDI mice.
The integrity of white matter has been reported to be compromised in ageing and in models of amyloidosis [52], [53], [54]. Whilst studies have previously shown alterations in myelin proteins with ageing the results are conflicting with some studies showing a reduction in specific proteins like myelin basic protein [55] and others finding the up-regulation or complete lack of change in proteins such as 29,39 cyclic nucleotide 39 -phosphodi-esterase or proteolipid protein respectively [56]. Furthermore the spatial organisation of proteins on myelinated axons, such as those found within paranodal regions, may be altered and can respond dynamically to various challenges including cerebral hypoperfu-sion and amyloid plaques [57], [58], [59]. In the present study we found a marked up-regulation of a greater number of myelin-associated proteins in older WT mice compared to TgSWDI. These differences are likely due to whn and how these changes are measured and suggest complex regulatory control of myelin protein expression. One of the most up-regulated proteins within the 9 month-old Tg-SwDI animals was APOE. APOE is known to bind to Aband is involved in its deposition and transcystosis across the blood brain barrier via its interaction with LDL-related protein (LRP) [60], [61]. APOE expression has been manipulated in various ways within the Tg-SwDI mouse model; though very little data exists showing how the endogenous mouse APOE acts naturally within the model. Expression of human APOE in the Tg-SwDI mouse leads to a very different pattern of Ab deposition than does endogenous APOE, such that human APOE reduces microvascular accumulation of Ab [62]. Furthermore, when APOE is blocked from interacting with Abin Tg-SwDI mice, a reduction in vascular fibrillar amyloid is observed [63]. We show that the APOE co-localizes to Abdeposits closely associated with cerebral vessels. Perivascular drainage of Abis thought to play a critical role in the clearance of Ab[64] and APOE has been shown to co-localize to perivascular spaces as well as with astrocytic endfeet in transgenic mouse models of amyloidosis [65]. Recent work undertaken using specific antibodies to APOE suggests that APOE might compete with clearance mechanisms for Ab at the BBB, and suggests potential novel targets for therapeutic intervention to reduce amyloidosis [66], [67].
We have also found a significant increase in the HTRA1 within the vascular fractions of the Tg-SwDI mice at 9 months of age. HTRA1 is a member of the trypsin family of serine proteases that has properties similar to many heat shock proteins and typically acts to prevent the aggregation of misfolded proteins [68]. It is known to inhibit Tgfbsignalling [69] and missense mutations are associated with cerebral autosomal recessive arteriopathy with subcortical infarcts and leukoencephalopathy [70]. HTRA1 cleaves multiple extracellular matrix (ECM) proteins including fibronectin, collagen and aggrecan, which in turn could lead to ECM remodelling [71]. HTRA1 has also been shown to degrade proteins aggregates such as tau [72] and has been shown
previously to associate with Ab, and specifically vascular Ab [73]. Further, when HTRA1 is inhibited in astrocyte cultures that secrete Ab1–40, there is a dose-dependent increase in the level of Ab1-40, the major Ab species observed in CAA [73]. The presence of HTRA1 in the vessels may indicate a potential alternative clearance method of Ab or its involvement in ECM remodelling around the blood vessels in reaction to accumulating Ab.
Tg-SwDI animals also showed a very significant down-regulation of proteins associated with RNA binding, processing and transport [e.g. spliceosome proteins, heterogeneous nuclear ribonucleoproteins (HNRNPs), TAR DNA-binding protein-43 (TDP-43)] at 9 months of age compared to 3 months of age. The spliceosome is required for proper protein synthesis, as it is involved in the formation of functional mRNA through excision of introns and splicing of exons [74], [75]. Heterogeneous nuclear ribonucleoproteins are involved in RNA binding and processing [76], [77]. A large number of RNA-binding proteins have prion-like domains (e.g. HNRNPA1, HNRNPAB, HNRNPA2B1, TDP-43 [78]), some of these, such as TDP-TDP-43, have been implicated as major disease proteins in neurodegenerative diseases such as amyotrophic lateral sclerosis and frontotemporal lobar degenera-tion and as secondary features of diseases like Alzheimer’s disease and Parkinson’s disease [79].
Age has distinctly different effects on the proteomic profiles of cerebral vessels from WT and Tg-SwDI animals. This is likely due to the transgenic nature of the Tg-SwDI animals, which leads to the vascular accumulation of Ab1-40. These differential effects include changes in proteins from various cellular compartments and with diverse cellular functions. Further investigation of these proteins is warranted and may give greater insight to the mechanisms behind age-related cerebrovascular dysfunction and pathologies as well as provide novel therapeutic targets.
Supporting Information
Figure S1 Gene ontology analysis of proteins found to be significantly different at p,0.01 within the WT cohort were uploaded to WebGestalt Gene Set Analysis Toolkit version 2.
(TIF)
Figure S2 A number of white matter-associated pro-teins are significantly up-regulated in 9 month-old WT and Tg-SwDI animals (**p,0.01; t-test). See Table 2 for full list.
(TIF)
Figure S3 Gene ontology analysis of proteins found to be significantly different at p,0.01 within the Tg-SwDI cohort were uploaded to WebGestalt Gene Set Analysis Toolkit version 2.
(TIF)
Table S1 Global list of all proteins quantified by at least two peptides.
(XLS)
Table S2 Gene ontology analysis of proteins found to be significantly different at p,0.01 within the WT cohort were uploaded to WebGestalt Gene Set Analysis Toolkit version 2.
(HTML)
cohort were uploaded to WebGestalt Gene Set Analysis Toolkit version 2.
(HTML)
Acknowledgments
The technical support provided by Mrs Fiona Scott is gratefully acknowledged.
Author Contributions
Conceived and designed the experiments: JLS KH TLB JM. Performed the experiments: JLS TLB NS. Analyzed the data: JLS KH JM. Contributed reagents/materials/analysis tools: KH JM TLB. Wrote the paper: JLS JM KH.
References
1. Kalaria RN (1996) Cerebral vessels in ageing and Alzheimer’s disease. Pharmacol Ther 72: 193–214. http://dx.doi.org/10.1016/S0163-7258(96)00116-7.
2. Verbeek MM, de Waal RM, Schipper JJ, Van Nostrand WE (1997) Rapid degeneration of cultured human brain pericytes by amyloid beta protein. J Neurochem 68: 1135–1141. http://dx.doi.org/10.1046/j.1471-4159.1997. 68031135.x.
3. Groschel K, Terborg C, Schnaudigel S, Ringer T, Riecker A, et al. (2007) Effects of physiological aging and cerebrovascular risk factors on the hemodynamic response to brain activation: a functional transcranial Doppler study. Eur J Neurol 14: 125–131. http://dx.doi.org/10.1111/j.1468-1331.2006. 01563.x.
4. Toda N (2012) Age-related changes in endothelial function and blood flow regulation. Pharmacol Ther 133: 159–176. http://dx.doi.org/10.1016/j. pharmthera.2011.10.004.
5. Shin HK, Jones PB, Garcia-Alloza M, Borrelli L, Greenberg SM, et al. (2007) Age dependent cerebrovascular dysfunction in a transgenic mouse model of cerebral amyloid angiopathy. Brain 130: 2310–2319. http://dx.doi.org/10. 1093/brain/awm156.
6. Zlokovic BV (2011) Neurovascular pathways to neurodegeneration in Alzhei-mer’s disease and other disorders. Nat Rev Neurosci 12: 723–738. http://dx.doi. org/10.1038/nrn3114.
7. Del Zoppo GJ (2012) Aging and the neurovascular unit. Ann N Y Acad Sci 1268: 127–133. http://dx.doi.org/10.1111/j.1749-6632.2012.06686.x. 8. Brown WR, Thore CR (2011) Review: cerebral microvascular pathology in
ageing and neurodegeneration. Neuropathol Appl Neurobiol 37: 56–74. http:// dx.doi.org/10.1111/j.1365-2990.2010.01139.x.
9. Jucker M, Battig K, Meier-Ruge W (1990) Effects of aging and vincamine derivatives on pericapillary microenvironment: stereological characterization of the cerebral capillary network. Neurobiol Aging 11: 39–46. http://dx.doi.org/ 10.1016/0197-4580(90)90060-D.
10. Riddle DR, Sonntag WE, Lichtenwalner RJ (2003) Microvascular plasticity in aging. Ageing Res Rev 2: 149–168. http://dx.doi.org/10.1016/S1568-1637(02)00064-8.
11. Bell MA, Ball MJ (1981) Morphometric comparison of hippocampal microvasculature in ageing and demented people: diameters and densities. Acta Neuropathol 53: 299–318. http://dx.doi.org/10.1007/BF00690371. 12. Biffi A, Greenberg SM (2011) Cerebral amyloid angiopathy: a systematic review.
J Clin Neurol 7: 1–9. http://dx.doi.org/10.3988/jcn.2011.7.1.1.
13. Thal DR, Ghebremedhin E, Rub U, Yamaguchi H, Del Tredici K, et al. (2002) Two types of sporadic cerebral amyloid angiopathy. J Neuropathol Exp Neurol 61: 282–293.
14. Auriel E, Greenberg SM (2012) The pathophysiology and clinical presentation of cerebral amyloid angiopathy. Curr Atheroscler Rep 14: 343–350. http://dx. doi.org/10.1007/s11883-012-0254-z.
15. Viswanathan A, Greenberg SM (2011) Cerebral amyloid angiopathy in the elderly. Ann Neurol 70: 871–880. http://dx.doi.org/10.1002/ana.22516. 16. Kim J, Basak JM, Holtzman DM (2009) The role of apolipoprotein E in
Alzheimer’s disease. Neuron 63: 287–303. http://dx.doi.org/10.1016/j.neuron. 2009.06.026.
17. Rebeck GW, Reiter JS, Strickland DK, Hyman BT (1993) Apolipoprotein E in sporadic Alzheimer’s disease: allelic variation and receptor interactions. Neuron 11: 575–580. http://dx.doi.org/10.1016/0896-6273(93)90070-8.
18. Suon S, Zhao J, Villarreal SA, Anumula N, Liu M, et al. (2010) Systemic treatment with liver X receptor agonists raises apolipoprotein E, cholesterol, and amyloid-beta peptides in the cerebral spinal fluid of rats. Mol Neurodegener 5: 44. http://dx.doi.org/10.1186/1750-1326-5-44.
19. Castellano JM, Deane R, Gottesdiener AJ, Verghese PB, Stewart FR, et al. (2012) Low-density lipoprotein receptor overexpression enhances the rate of brain-to-blood Abeta clearance in a mouse model of beta-amyloidosis. Proc Natl Acad Sci U S A 109: 15502–15507.http://dx.doi.org/10.1073/pnas. 1206446109.
20. Jiang Q, Lee CY, Mandrekar S, Wilkinson B, Cramer P, et al. (2008) ApoE promotes the proteolytic degradation of Abeta. Neuron 58: 681–693.http://dx. doi.org/10.1016/j.neuron.2008.04.010.
21. Miners JS, Barua N, Kehoe PG, Gill S, Love S (2011) Abeta-degrading enzymes: potential for treatment of Alzheimer disease. J Neuropathol Exp Neurol 70: 944–959. http://dx.doi.org/10.1097/NEN.0b013e3182345e46.
22. Haass C, Lemere CA, Capell A, Citron M, Seubert P, et al. (1995) The Swedish mutation causes early-onset Alzheimer’s disease by beta-secretase cleavage within the secretory pathway. Nat Med 1: 1291–1296.
23. Davis J, Xu F, Deane R, Romanov G, Previti ML, et al. (2004) Early-onset and robust cerebral microvascular accumulation of amyloid beta-protein in transgenic mice expressing low levels of a vasculotropic Dutch/Iowa mutant form of amyloid beta-protein precursor. J Biol Chem 279: 20296–20306. http:// dx.doi.org/10.1074/jbc.M312946200.
24. Davis J, Xu F, Miao J, Previti ML, Romanov G, et al. (2006) Deficient cerebral clearance of vasculotropic mutant Dutch/Iowa Double A beta in human A betaPP transgenic mice. Neurobiol Aging 27: 946–954.
25. Miao J, Vitek MP, Xu F, Previti ML, Davis J, et al. (2005) Reducing cerebral microvascular amyloid-beta protein deposition diminishes regional neuroin-flammation in vasculotropic mutant amyloid precursor protein transgenic mice. J Neurosci 25: 6271–6277. http://dx.doi.org/10.1523/JNEUROSCI.1306-05. 2005.
26. Zlokovic BV (2008) The blood-brain barrier in health and chronic neurode-generative disorders. Neuron 57: 178–201. http://dx.doi.org/10.1016/j.neuron. 2008.01.003.
27. Bell RD, Zlokovic BV (2009) Neurovascular mechanisms and blood-brain barrier disorder in Alzheimer’s disease. Acta Neuropathol 118: 103–113. http:// dx.doi.org/10.1007/s00401-009-0522-3.
28. Wilcock DM, Vitek MP, Colton CA (2009) Vascular amyloid alters astrocytic water and potassium channels in mouse models and humans with Alzheimer’s disease. Neuroscience 159: 1055–1069. http://dx.doi.org/10.1016/j. neuroscience.2009.01.023.
29. Hartz AM, Bauer B, Soldner EL, Wolf A, Boy S, et al. (2012) Amyloid-beta contributes to blood-brain barrier leakage in transgenic human amyloid precursor protein mice and in humans with cerebral amyloid angiopathy. Stroke 43: 514–523. http://dx.doi.org/10.1161/STROKEAHA.111.627562. 30. Yousif S, Marie-Claire C, Roux F, Scherrmann JM, Decleves X (2007)
Expression of drug transporters at the blood-brain barrier using an optimized isolated rat brain microvessel strategy. Brain Res 1134: 1–11. http://dx.doi.org/ 10.1016/j.brainres.2006.11.089.
31. Chun HB, Scott M, Niessen S, Hoover H, Baird A, et al. (2011) The proteome of mouse brain microvessel membranes and basal lamina. J Cereb Blood Flow Metab 31: 2267–2281. http://dx.doi.org/10.1038/jcbfm.2011.104.
32. Le Bihan T, Grima R, Martin S, Forster T, Le Bihan Y (2010) Quantitative analysis of low-abundance peptides in HeLa cell cytoplasm by targeted liquid chromatography/mass spectrometry and stable isotope dilution: emphasising the distinction between peptide detection and peptide identification. Rapid Commun Mass Spectrom 24: 1093–1104. http://dx.doi.org/10.1002/rcm. 4487.
33. James R, Searcy JL, Le Bihan T, Martin SF, Gliddon CM, et al. (2012) Proteomic analysis of mitochondria in APOE transgenic mice and in response to an ischemic challenge. J Cereb Blood Flow Metab 32: 164–176. http://dx.doi. org/10.1038/jcbfm.2011.120.
34. Zhang B, Kirov S, Snoddy J (2005) WebGestalt: an integrated system for exploring gene sets in various biological contexts. Nucleic Acids Res 33: W741– 748. http://dx.doi.org/10.1093/nar/gki475.
35. Wang J, Duncan D, Shi Z, Zhang B (2013) WEB-based GEne SeT AnaLysis Toolkit (WebGestalt): update 2013. Nucleic Acids Res 41: W77–83. http://dx. doi.org/10.1093/nar/gkt439.
36. Davis J, Van Nostrand WE (1996) Enhanced pathologic properties of Dutch-type mutant amyloid beta-protein. Proc Natl Acad Sci U S A 93: 2996–3000. http://dx.doi.org/10.1073/pnas.93.7.2996.
37. Van Nostrand WE, Melchor JP, Cho HS, Greenberg SM, Rebeck GW (2001) Pathogenic effects of D23N Iowa mutant amyloid beta -protein. J Biol Chem 276: 32860–32866. http://dx.doi.org/10.1074/jbc.M104135200.
38. Deane R, Wu Z, Sagare A, Davis J, Du Yan S, et al. (2004) LRP/amyloid beta-peptide interaction mediates differential brain efflux of Abeta isoforms. Neuron 43: 333–344. http://dx.doi.org/10.1016/j.neuron.2004.07.017.
39. Christie R, Yamada M, Moskowitz M, Hyman B (2001) Structural and functional disruption of vascular smooth muscle cells in a transgenic mouse model of amyloid angiopathy. Am J Pathol 158: 1065–1071. http://dx.doi.org/ 10.1016/S0002-9440(10)64053-9.
40. Carrano A, Hoozemans JJ, van der Vies SM, Rozemuller AJ, van Horssen J, et al. (2011) Amyloid Beta induces oxidative stress-mediated blood-brain barrier changes in capillary amyloid angiopathy. Antioxid Redox Signal 15: 1167–1178. http://dx.doi.org/10.1089/ars.2011.3895.
42. Bergerat A, Decano J, Wu CJ, Choi H, Nesvizhskii AI, et al. (2011) Prestroke proteomic changes in cerebral microvessels in stroke-prone, transgenic[hCETP]-Hyperlipidemic, Dahl salt-sensitive hypertensive rats. Mol Med 17: 588–598. 43. Oldendorf WH, Cornford ME, Brown WJ (1977) The large apparent work
capability of the blood-brain barrier: a study of the mitochondrial content of capillary endothelial cells in brain and other tissues of the rat. Ann Neurol 1: 409–417. http://dx.doi.org/10.1002/ana.410010502.
44. Smith MA, Rottkamp CA, Nunomura A, Raina AK, Perry G (2000) Oxidative stress in Alzheimer’s disease. Biochim Biophys Acta 1502: 139–144. http://dx. doi.org/10.1016/S0925-4439(00)00040-5.
45. Balaban RS, Nemoto S, Finkel T (2005) Mitochondria, oxidants, and aging. Cell 120: 483–495. http://dx.doi.org/10.1016/j.cell.2005.02.001.
46. Moreira PI, Honda K, Liu Q, Santos MS, Oliveira CR, et al. (2005) Oxidative stress: the old enemy in Alzheimer’s disease pathophysiology. Curr Alzheimer Res 2: 403–408. http://dx.doi.org/10.2174/156720505774330537. 47. Swerdlow RH, Burns JM, Khan SM (2010) The Alzheimer’s disease
mitochondrial cascade hypothesis. J Alzheimers Dis 20 Suppl 2: S265–279. http://dx.doi.org/10.3233/JAD-2010-100339.
48. Kalaria RN, Pax AB (1995) Increased collagen content of cerebral microvessels in Alzheimer’s disease. Brain Res 705: 349–352. http://dx.doi.org/10.1016/ 0006-8993(95)01250-8.
49. Farkas E, de Vos RA, Donka G, Jansen Steur EN, Mihaly A, et al. (2006) Age-related microvascular degeneration in the human cerebral periventricular white matter. Acta Neuropathol 111: 150–157 http://dx.doi.org/10.1007/s00401-005-0007-y.
50. Montague P, McCallion AS, Davies RW, Griffiths IR (2006) Myelin-associated oligodendrocytic basic protein: a family of abundant CNS myelin proteins in search of a function. Dev Neurosci 28: 479–487. http://dx.doi.org/10.1159/ 000095110.
51. Haas S, Steplewski A, Siracusa LD, Amini S, Khalili K (1995) Identification of a sequence-specific single-stranded DNA binding protein that suppresses tran-scription of the mouse myelin basic protein gene. J Biol Chem 270: 12503– 12510. http://dx.doi.org/10.1074/jbc.270.21.12503.
52. Tang Y, Nyengaard JR, Pakkenberg B, Gundersen HJ (1997) Age-induced white matter changes in the human brain: a stereological investigation. Neurobiol Aging 18: 609–615. http://dx.doi.org/10.1016/S0197-4580(97)00155-3. 53. Bartzokis G (2004) Age-related myelin breakdown: a developmental model of
cognitive decline and Alzheimer’s disease. Neurobiol Aging 25: 5–18; author reply 49–62. http://dx.doi.org/10.1016/j.neurobiolaging.2003.03.001. 54. Desai MK, Sudol KL, Janelsins MC, Mastrangel MA, Frazer ME, et al. (2009)
Triple-Transgenic Alzheimer’s Disease Mice Exhibit Region-Specific Abnor-malities in Brain Myelination Patterns Prior to Appearance of Amyloid and Tau Pathology. Glia 57: 54–65. http://dx.doi.org/10.1002/glia.20734.
55. Wang DS, Bennett DA, Mufson EJ, Mattila P, Cochran E, et al. (2004) Contribution of changes in ubiquitin and myelin basic protein to age-related cognitive decline. Neurosci Res 48: 93–100. http://dx.doi.org/ S0168010203002876.
56. Sloane JA, Hinman JD, Lubonia M, Hollander W, Abraham CR (2003) Age-dependent myelin degeneration and proteolysis of oligodendrocyte proteins is associated with the activation of calpain-1 in the rhesus monkey. J Neurochem 84: 157–168. http://dx.doi.org/10.1046/j.1471-4159.2003.01541.x. 57. Hinman JD, Peters A, Cabral H, Rosene DL, Hollander W, et al. (2006)
Age-related molecular reorganization at the node of Ranvier. J Comp Neurol 495: 351–362. http://dx.doi.org/10.1002/cne.20886.
58. Reimer MM, McQueen J, Searcy L, Scullion G, Zonta B, et al. (2011) Rapid disruption of axon-glial integrity in response to mild cerebral hypoperfusion. J Neurosci 31: 18185–18194. http://dx.doi.org/10.1523/JNEUROSCI.4936-11.201.
59. Behrendt G, Baer K, Buffo A, Curtis MA, Faull RL, et al. (2013) Dynamic changes in myelin aberrations and oligodendrocyte generation in chronic amyloidosis in mice and men. Glia 61: 273–286. http://dx.doi.org/10.1002/ glia.22432.
60. Zlokovic BV (2004) Clearing amyloid through the blood-brain barrier. J Neurochem 89: 807–811.http://dx.doi.org/10.1111/j.1471-4159.2004. 02385.x.
61. Sadowski MJ, Pankiewicz J, Scholtzova H, Mehta PD, Prelli F, et al. (2006) Blocking the apolipoprotein E/amyloid-beta interaction as a potential therapeutic approach for Alzheimer’s disease. Proc Natl Acad Sci U S A 103: 18787–18792. http://dx.doi.org/10.1073/pnas.0604011103.
62. Xu F, Vitek MP, Colton CA, Previti ML, Gharkholonarehe N, et al. (2008) Human apolipoprotein E redistributes fibrillar amyloid deposition in Tg-SwDI mice. J Neurosci 28: 5312–5320. http://dx.doi.org/10.1523/JNEUROSCI. 1042-08.2008.
63. Yang J, Ji Y, Mehta P, Bates KA, Sun Y, et al. (2011) Blocking the apolipoprotein E/amyloid-beta interaction reduces fibrillar vascular amyloid deposition and cerebral microhemorrhages in TgSwDI mice. J Alzheimers Dis 24: 269–285. http://dx.doi.org/10.3233/JAD-2011-101401.
64. Weller RO, Massey A, Newman TA, Hutchings M, Kuo YM, et al. (1998) Cerebral amyloid angiopathy: amyloid beta accumulates in putative interstitial fluid drainage pathways in Alzheimer’s disease. Am J Pathol 153: 725–733. http://dx.doi.org/10.1016/S0002-9440(10)65616-7.
65. Thal DR, Larionov S, Abramowski D, Wiederhold KH, Van Dooren T, et al. (2007) Occurrence and co-localization of amyloid beta-protein and apolipopro-tein E in perivascular drainage channels of wild-type and APP-transgenic mice. Neurobiol Aging 28: 1221–1230. http://dx.doi.org/10.1016/j.neurobiolaging. 2006.05.029.
66. Kim J, Eltorai AE, Jiang H, Liao F, Verghese PB, et al. (2012) Anti-apoE immunotherapy inhibits amyloid accumulation in a transgenic mouse model of Abeta amyloidosis. J Exp Med 209: 2149–2156. http://dx.doi.org/10.1084/ jem.20121274.
67. Verghese PB, Castellano JM, Garai K, Wang Y, Jiang H, et al. (2013) ApoE influences amyloid-beta (Abeta) clearance despite minimal apoE/Abeta association in physiological conditions. Proc Natl Acad Sci U S A 110: E1807–1816. http://dx.doi.org/10.1073/pnas.1220484110.
68. Clausen T, Southan C, Ehrmann M (2002) The HtrA family of proteases: implications for protein composition and cell fate. Mol Cell 10: 443–455. http:// dx.doi.org/10.1016/S1097-2765(02)00658-5.
69. Oka C, Tsujimoto R, Kajikawa M, Koshiba-Takeuchi K, Ina J, et al. (2004) HtrA1 serine protease inhibits signaling mediated by Tgfbeta family proteins. Development 131: 1041–1053. http://dx.doi.org/10.1242/dev.00999. 70. Hara K, Shiga A, Fukutake T, Nozaki H, Miyashita A, et al. (2009) Association
of HTRA1 mutations and familial ischemic cerebral small-vessel disease. N Engl J Med 360: 1729–1739. http://dx.doi.org/10.1056/NEJMoa0801560. 71. Clausen T, Kaiser M, Huber R, Ehrmann M (2011) HTRA proteases: regulated
proteolysis in protein quality control. Nat Rev Mol Cell Biol 12: 152–162. http://dx.doi.org/10.1038/nrm306.
72. Tennstaedt A, Popsel S, Truebestein L, Hauske P, Brockmann A, et al. (2012) Human high temperature requirement serine protease A1 (HTRA1) degrades tau protein aggregates. J Biol Chem 287: 20931–20941. http://dx.doi.org/10. 1074/jbc.M111.316232.
73. Grau S, Richards PJ, Kerr B, Hughes C, Caterson B, et al. (2006) The role of human HtrA1 in arthritic disease. J Biol Chem 281: 6124–6129. http://dx.doi. org/10.1074/jbc.M500361200.
74. Hoskins AA, Moore MJ (2012) The spliceosome: a flexible, reversible macromolecular machine. Trends Biochem Sci 37: 179–188. http://dx.doi. org/10.1016/j.tibs.2012.02.009.
75. Padgett RA (2012) New connections between splicing and human disease. Trends Genet 28: 147–154. http://dx.doi.org/10.1016/j.tig.2012.01.001. 76. Weighardt F, Biamonti G, Riva S (1996) The roles of heterogeneous nuclear
ribonucleoproteins (hnRNP) in RNA metabolism. Bioessays 18: 747–756. http://dx.doi.org/10.1002/bies.950180910.
77. Chaudhury A, Chander P, Howe PH (2010) Heterogeneous nuclear ribonu-cleoproteins (hnRNPs) in cellular processes: Focus on hnRNP E1’s multifunc-tional regulatory roles. RNA 16: 1449–1462. http://dx.doi.org/10.1261/rna. 2254110.
78. King OD, Gitler AD, Shorter J (2012) The tip of the iceberg: RNA-binding proteins with prion-like domains in neurodegenerative disease. Brain Res 1462: 61–80. http://dx.doi.org/10.1016/j.brainres.2012.01.016.