Control in CD4
+
T-Cells from HIV-1-Infected Individuals
Margalida Rotger1., Kristen K. Dang2., Jacques Fellay2., Erin L. Heinzen2
, Sheng Feng2,3, Patrick Descombes4, Kevin V. Shianna2, Dongliang Ge2, Huldrych F. Gu¨nthard5, David B. Goldstein2*, Amalio Telenti1*, The Swiss HIV Cohort Study and the Center for HIV/AIDS Vaccine Immunology"
1Institute of Microbiology, University Hospital and University of Lausanne, Lausanne, Switzerland,2Institute for Genome Sciences & Policy, Duke University, Durham, North Carolina, United States of America,3Department of Biostatistics and Bioinformatics, Duke University, Durham, North Carolina, United States of America,4Genomics Platform, University of Geneva, Geneva, Switzerland,5Division of Infectious Diseases, University Hospital Zurich, University of Zurich, Zurich, Switzerland
Abstract
There is great interindividual variability in HIV-1 viral setpoint after seroconversion, some of which is known to be due to genetic differences among infected individuals. Here, our focus is on determining, genome-wide, the contribution of variable gene expression to viral control, and to relate it to genomic DNA polymorphism. RNA was extracted from purified CD4+T-cells from 137 HIV-1 seroconverters, 16 elite controllers, and 3 healthy blood donors. Expression levels of more than 48,000 mRNA transcripts were assessed by the Human-6 v3 Expression BeadChips (Illumina). Genome-wide SNP data was generated from genomic DNA using the HumanHap550 Genotyping BeadChip (Illumina). We observed two distinct profiles with 260 genes differentially expressed depending on HIV-1 viral load. There was significant upregulation of expression of interferon stimulated genes with increasing viral load, including genes of the intrinsic antiretroviral defense. Upon successful antiretroviral treatment, the transcriptome profile of previously viremic individuals reverted to a pattern comparable to that of elite controllers and of uninfected individuals. Genome-wide evaluation ofcis-acting SNPs identified genetic variants modulating expression of 190 genes. Those were compared to the genes whose expression was found associated with viral load: expression of one interferon stimulated gene, OAS1, was found to be regulated by a SNP (rs3177979, p = 4.9E-12); however, we could not detect an independent association of the SNP with viral setpoint. Thus, this study represents an attempt to integrate genome-wide SNP signals with genome-wide expression profiles in the search for biological correlates of HIV-1 control. It underscores the paradox of the association between increasing levels of viral load and greater expression of antiviral defense pathways. It also shows that elite controllers do not have a fully distinctive mRNA expression pattern in CD4+T cells. Overall, changes in global RNA expression reflect responses to viral replication rather than a mechanism that might explain viral control.
Citation:Rotger M, Dang KK, Fellay J, Heinzen EL, Feng S, et al. (2010) Genome-Wide mRNA Expression Correlates of Viral Control in CD4+T-Cells from
HIV-1-Infected Individuals. PLoS Pathog 6(2): e1000781. doi:10.1371/journal.ppat.1000781
Editor:Michael Emerman, Fred Hutchinson Cancer Research Center, United States of America ReceivedJune 2, 2009;AcceptedJanuary 20, 2010;PublishedFebruary 26, 2010
Copyright:ß2010 Rotger et al. This is an open-access article distributed under the terms of the Creative Commons Attribution License, which permits unrestricted use, distribution, and reproduction in any medium, provided the original author and source are credited.
Funding:This work is supported by the Swiss National Science Foundation grants no. 3100-110012, and by the NIAID Center for HIV/AIDS Vaccine Immunology (CHAVI) grant AI067854. The Swiss HIV Cohort Study (SHCS) is supported by the Swiss National Science Foundation (grant no. 33CSC0-108787) and the SHCS research foundation. The funders had no role in study design, data collection and analysis, decision to publish, or preparation of the manuscript.
Competing Interests:The authors have declared that no competing interests exist. * E-mail: [email protected] (DBG); [email protected] (AT)
.These authors contributed equally to this work.
"Membership of the The Swiss HIV Cohort Study is provided in the Acknowledgments.
Introduction
There has been a recent effort to identify the genomic determinants of susceptibility to HIV-1 infection, control of viral replication, and disease progression [1]. Genetic analyses have identified over the years a number of validated variants in candidate genes, while a recent genome-wide association study [2] highlighted the dominant role of variants in the MHC region in the control of viral setpoint (the steady state of viral replication after infection) and disease progression. Other genome-wide studies [3–5] confirmed the variants identified in the first genome-wide analysis. These variants collectively explain up to about 13% of the variation in viral setpoint, indicating that other biological determinants of control have yet to be identified. Here our focus is on determining the contribution of variable gene expression to viral control, and to relate it to genomic DNA polymorphism.
There have been a number of transcriptome studies in HIV-1 target cells (CD4+T cells, monocytes/macrophages), non-targets such as NK cells and B cells, and of dendritic cells and total peripheral blood mononuclear cells (PBMCs) (reviewed in [6], and recent publications [7–11]). These studies provide insight into gene expression changes associated with virus replication and persis-tence. Studies are limited by the number of genes interrogated, or by the number of individuals investigated. These limits notwith-standing, microarray data have yielded novel mechanisms of HIV-mediated pathogenesis. Transcriptome analyses of cell lines transfected with individual viral proteins or mutant viruses have also been reported (reviewed in [6]).
with viral setpoint. Integrating gene expression data with results from genome-wide association studies may help prioritize fine-mapping efforts and provide shortcuts to disease biology [12]. Therefore, the goals of the study are the description of the expression program associated with HIV-1in vivo, the identifica-tion of mRNAs that are differentially expressed in individuals that present effective control of viral replication, and the search forcis -acting variation in differentially expressed genes. Expression polymorphism due to single nucleotide polymorphisms (SNPs) that influence mRNA levels has received increasing attention for the understanding of phenotypes in health and disease (reviewed in [12]). Genome-wide screens, most generally done in cell lines, have established the relevance of cis-acting SNPs in expression polymorphism [13]. However, little is known regarding expression polymorphism and HIV-1 disease.
In order to have power to detect correlations, we have considered a large sample set of purified CD4+T cells from individuals with known date of infection and carefully determined viral load results. Transcription analysis was done at the time of viral setpoint, so that samples are representative of the steady-state replication for a given individual, and across the full range of viral setpoint in an infected population. For a large subset of participants, we also established the transcription profile after initiation of antiretroviral therapy (ART) to assess the modulation of expression upon effective control of viremia. Thus, this study represents a first attempt at assessing, genome-wide, the genotype-to-transcriptome-to-clinical phenotype associations in HIV-1 disease.
Results
Transcriptome profile and viral setpoint analysis
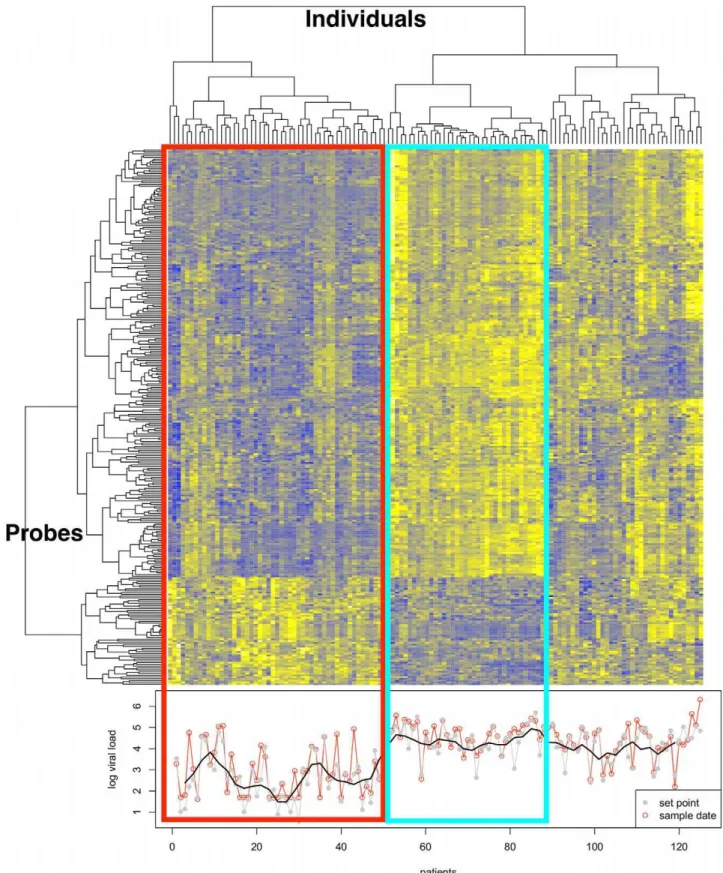
We identified 298 hybridization probes that were significantly correlated with viral load (FDR-adjusted p-value,0.01). This resulted in a list of 260 genes, since multiple probes are used for some of the genes. The majority of these (n = 209) were positively associated with viral setpoint, while a smaller group (n = 51) was negatively associated (Supplementary Table S1). We used (unsupervised) clustering to group the expression profiles of the samples for these 260 genes, and found that they showed distinct behavior in individuals with effective virus control (reflected in low viral setpoint) as compared with individuals showing poor control of viral replication (Figure 1). In an analysis that considered viral load at the precise date of transcriptome analysis instead of
setpoint, the results were comparable, implying that the expression profile is representative for the period of analysis (three months to three years after seroconversion),Figure 1. The analysis included various parameters as covariates (clinical center, gender, age, CD4 T cell viability and laboratory date, and microarray chip batch -sentrix ID). The CD4 T cell value at the time of sampling was found to be closely correlated with viral setpoint (Pearson’s correlation of 20.5 and a p-value = 1.195e-10), which made difficult to separate their effects on the data. The 149 genes that are shared between analysis using CD4 T cell count, and the analysis using viral setpoint are indicated in Supplementary Table S1.
The main gene clusters exhibiting a positive correlation with viral setpoint (i.e., increasing gene expression with increasing viral load), as defined by STRING, DAVID and IPA, were the interferon pathway, the proteasome, and cell cycle genes (Figure 2 and Supplementary Table S2, S3). Conversely, among genes that exhibited a negative correlation with viral setpoint ( Supple-mentary Table S1B), no pathway enrichment was identified. A separate analysis that used a gene-by-gene modeling approach resulted in a list of significant genes that was shorter (44 genes) but highly concordant with the output of the empirical Bayes analysis described above (Supplementary Table S4): we therefore used the empirical Bayes results for subsequent analyses. Because the CD4+T cell composition may vary depending on the degree of viral replication [7], we re-analyzed the data controlling forCD25
expression (encoding IL2RA as marker of activation), orCD62L,
CD40L, CD11a, andCD27 (markers that distinguish naive from memory CD4+ T cells). Although several additional significant genes were found using each of the above markers as covariates, the overall expression profile did not vary significantly (see for example data from analysis adjusted byCD25inSupplementary Table S5). These analyses indicate the existence of a clear expression program associated with high viral load, but fail to identify definite gene networks associated with viral control.
Analysis of genes of the interferon response pathways We observed a linear association between increasing expression of interferon signaling and interferon-stimulated genes (ISGs) and increasing viral setpoint. We compiled a list of 40 genes implicated in the interferon response [14] (Supplementary Table S6). Seventeen genes were significantly associated with viral setpoint after FDR adjustment at the 0.01 level, and 12 were associated at a p-value of 0.05. These 29 genes comprise most of the signaling and ISGs, but notably exclude the interferon genes themselves and the interferon receptors (Figure 3). This analysis points to a de-regulated interferon response that associates with an ineffective antiviral response.
Analysis of genes associated with HIV-1 life cycle and pathogenesis
We similarly examined in detail a list of selected genes reported to be involved in HIV-1 life cycle or pathogenesis (see Methods for explanation of candidate selection) [15]. Of this list, 138 genes were matched to probes, with four having a FDR-adjusted significant association with viral setpoint, p-value,0.01:TRIM22,
IRF7, RANBP1, and APOBEC3G. An additional 12 genes had FDR-adjusted p-values ,0.05, and a further 26 had nominal p-values ,0.05 (Supplementary Table S7). Genes of the intrinsic cellular defense against retroviruses (TRIM5a, TRIM22, TRIM19/PML, APOBEC3G, APOBEC3F, APOBEC3H, PPIA/ Cyclophilin A,BST2/Tetherin) were all upregulated with increasing viral load, which is consistent with their general dependence on the interferon pathways. A number of chemokines and chemokine Author Summary
Figure 1. Transcriptome analysis in CD4+T cells from HIV-infected untreated individuals.Gene clusters are presented on the left. In total, 260 genes are differentially expressed (at adjusted p,0.01) in association with viral load in CD4+T cells duringin vivoHIV-1 infection. Patient clusters are presented at the top for untreated individuals. Clustering was performed on the Spearman correlation coefficient. The phenotype is presented at the bottom, as log10 viral setpoint in gray, and log10 viral load at time of sample collection in red. A smooth of the setpoint viral load values is depicted by the black line. The red rectangle surrounds a cluster of individuals characterized by low viral load (mean Log10 viral setpoint = 2.6), and including several ‘‘elite controllers’’ – individuals that spontaneous control viral replication in the absence of treatment. The blue rectangle identifies a cluster of individuals with high viral setpoint (mean Log10 viral setpoint = 4.4). The remaining clusters illustrate the heterogeneity of transcription profile across the range of viral load values.
receptors were also positively modulated with increasing viremia. We also identified differentially expressed genes that are present in both the current analysis and studies that used siRNA or shRNA to identify HIV-1 dependency factors [16–19] (Supplementary Table S8).
Changes in transcriptome profile after treatment The significant association of a number of genes and pathways with viral setpoint was further assessed by observing the changes in transcriptional profile in CD4+T cells after viral suppression. We found statistical support for differential expression of 247 probes (FDR-adjusted p-value ,0.01) between treated and untreated-noncontroller individuals. The list of genes involved had an
extensive overlap with the list of genes associated with viral setpoint in the transcriptome analysis above (Supplementary Table S9). The list also shares 97 genes with the recent study by Li et al. [20] on changes in the lymph node transcriptome profile upon initiation of ART. This analysis indicates that successful treatment appears able to recapitulate the cellular state of a well-controlled individual, since we did not find support for any probes being differently expressed between successfully treated and untreated-controller individuals.
Comparison with uninfected individuals
To compare the treated and untreated individuals with uninfected individuals, we clustered the expression profiles from
Figure 2. Predicted interaction networks of genes differentially expressed during HIV-1 infection.Differentially expressed genes are
depicted: links have been predicted using STRING (http://string.embl.de/). Predicted interactions are depicted according to the type of available evidence. The interactions (see color labels) include direct (physical) and indirect (functional) associations; they are derived from four sources: genomic context, high-throughput experiments, conserved coexpression, and previous knowledge from literature.
samples from a selected group of individuals, including elite controllers (viral load,50 copies/ml), samples from successfully treated individuals and their paired untreated samples, and from the three uninfected individuals (measured in triplicate, one triplicate failed analysis). For this, we restricted analysis to the 260 genes found to be differently expressed by viral setpoint. As shown in Figure 4, both the successfully treated and uninfected individuals tended to cluster with the controllers individuals. Two of the individuals from healthy donors were most tightly grouped with several of the untreated individuals that have the lowest level of virus at setpoint (i.e. the elite controllers), while one uninfected individual showed a profile that is less extreme, but still most similar to the viral control profile. Treated individuals also preferentially grouped with the viral control pattern, although the majority showed a mid-range expression level and a smaller fraction grouped with elite controllers and uninfected individuals. A bootstrapping analysis showed support (p-value 0.06) for the
consistency of the top-level groupings with one group containing all the uninfected individuals and the majority of the treated and elite controller individuals, while the other group contained mostly non-controller individuals. This indicates that the expression levels of individuals with the best viral control closely resemble those of uninfected individuals.
Screen forcis-acting SNPs regulating transcript expression levels
Among a total of 1.3 million association tests comparing 399,626 gene-centric SNPs (some SNPs were within 100 kb of multiple transcripts) with 28,828 individual probes measuring a total of 18,059 unique transcripts, we detected 782 study-wide significant associations (SNP-probe associations) below the thresh-old p-value of 3.861028. Stepwise linear regression was used to prune out redundant associations of SNPs with a particular probe. This step resulted in evidence for cis-regulation of 208 unique
Figure 3. Differential expression of genes of the interferon response.Representative genes of the interferon response pathway are shown in
panel A. From grey to red, increasing differential expression with increasing viral setpoint. Selected genes are shown in panel B. While genes associated with interferon receptors, such asTYK2, are not differentially expressed, signaling molecules suchSTAT1and interferon-stimulated genes such asMX1andTAP1are significantly upregulated with increasing viral load.
probes, 157 of which were regulated by multiple SNPs in high linkage disequilibrium between SNPs included in the analysis (51 signals of unique SNPs with a transcript, and 731 signals arising from the regulation of 157 transcripts by multiple non-unique SNPs). These 208 associations included 193 SNPs that modulate 190 genes in CD4+T cells, with the overlap occurring because of probe cross-hybridization, and also several probes detecting the same gene (Supplementary Table S10).
This list of study-wide significant associations was compared to the list of genes whose expression was found associated with viral load at setpoint. Among genes under differential expression during HIV-1 infection, several showed evidence for cis-regulation (Supplementary Table S11) but only one, involving the interferon stimulated OAS1, reached study-wide significance.
OAS1was found to be regulated by an intronic SNP (rs3177979)
located near exon 6 (Supplementary Figure S1). Lower expression was associated with the rs3177979 GG genotype. The association was detectable in treated and untreated individuals; however the expression level was lower in samples from treated individuals. The association of this SNP withOAS1
transcript expression is also detectable in PBMCs collected from uninfected controls [21].
We did not observe an association ofOAS1rs3177979 with viral setpoint in the study (untreated) population. However, given the potential interest of genetic polymorphism in OAS1, we also assessed the association between rs3177979 and HIV-1 outcomes in a large population of 2362 individuals [5]. The association p-values were 0.05 for an association of theOAS1SNP and viral setpoint and 0.09 for HIV-1 disease progression, but differences were subtle: mean HIV-1 load was 4.11 log10 viral copies/ml for
Figure 4. Transcriptome analysis in CD4+T cells from HIV-infected individuals before and after viral suppression.Analysis was
restricted to the 260 genes found to be differently expressed by viral setpoint. Gene clusters are presented on the left. Patient clusters are presented at the top. In red, transcriptome profile before viral suppression, and in yellow, transcriptome profile after viral suppression with effective treatment in 37 individuals with pre- and post-treatment initiation samples. In blue, transcriptome profile of 16 elite controllers. In black, transcriptome profile from 3 HIV-negative healthy controls (8 samples).
the AA genotype, 4.07 for AG, and 4.01 for GG. Because rs3177979 is in linkage disequilibrium with rs10774671, a SNP associated with a splicing variant ([22] andText S1) reported to have greater activity against West Nile virus [23], we re-genotyped the population for this putative functional SNP, without finding any stronger association: we have therefore no definitive evidence of an association ofcis-acting genetic variation inOAS1with HIV-1 viral control or disease progression.
One additional gene,RANBP1, encoding a Ran GTPase-binding protein that interferes with Rev-mediated expression of HIV-1 [24], presented both increased expression at higher setpoint, and acis -acting SNP (rs2008591) that modulates its expression ( Supple-mentary Table S11). We assessed the association between rs2008591 and viral setpoint and disease progression in the large population of 2362 individuals [5]. Here, rs2008591 did not associate with viral setpoint (p = 0.45) or disease progression (p = 0.35). Overall, these analyses identified a significant number ofcis-acting genetic variants influencing gene expression in CD4+T cells; however, expression polymorphism, genome-wide or among genes that are modulated during HIV-1 infection, did not contribute in a significant fashion to viral control.
Discussion
This study represents the largest effort to date to characterize the mRNA expression profile in CD4+ T cells in vivoin HIV-1 infected individuals. The study population, only including individuals with known date of seroconversion or elite controllers, represents the complete range of viral load control: from undetectable viral load to sustained high levels of viral replication. The study also analyzed changes in transcriptome upon successful antiretroviral therapy. In addition, we searched for cis-acting variants – SNPs that would possibly associate with the observed differences in gene expression in the course of HIV-1 infection. Overall, changes in RNA expression reflect responses to viral replication rather than a mechanism that might explain control of viral replication. As such, the reactive transcriptome profile we observed shares common responses with other viral infections, eg. to dengue virus [25–28] (Supplementary Table S12).
In vivo HIV-1 infection results in a distinctive mRNA transcriptome profile in CD4+T cells that involves 260 genes in an analysis that differentiates individuals with high and those with low viral setpoint. Under conditions of high viral load, there is a distinct upregulation of the interferon pathways, cell cycle and the ubiquitin-proteasome degradation machinery. The study confirms and extends previous analyses ofin vitroinfection of T cell lines, or of CD4+T cellsin vivothat were performed on a limited number of individuals [7–10,29,30].
This study underscores that the observed increase in transcrip-tion of ISGs is not associated with a better control of viremia [7]. This contrasts with the reported efficacy and possible therapeutic role of interferon (IFN-a, IFN-a2b) suggested by results from in vitro studies, while exogenous administration of interferon in clinical trials led to doubts about its efficacy in the clinical setting (reviewed in [31]). Our observations lend support to the hypothesis that interferon activation plays a deleterious role in retroviral pathogenesis, as proposed by many recent reports (reviewed in [31]). Elevated ISG expression is associated with disease progression in pathogenic SIV infection of non-human primates [32–35], while the type I interferon response subsided after peak viral load during non-pathogenic infection [36,37]. Sedaghat et al. [7] compared the transcriptional programs of in vivo-activated CD4+T cells from untreated HIV-positive individuals with those of activated CD4+ T cells from HIV-negative individuals. From
this study, they concluded that CD4+ T cells from infected individuals are in a hyperproliferative state that is modulated by type I interferons, and that this would lead, during chronic infection, to CD4+ T-cell preferential differentiation and deple-tion. Imbeault et al. [10] suggested that interferon could lead to a sustained increase in p53 mRNA levels and therefore to a higher susceptibility of CD4+T cells to pro-apoptotic signals. Herbeuval and Shearer [31] proposed that interferon, through binding to its receptor on primary CD4+ T cells would result in membrane expression of the TNF-Related Apoptosis-Inducing Ligand, TRAIL, death molecule leading to the selective death of HIV-exposed CD4+T cells. More recently, Sato et al. [38] showed that type I interferon induce proliferation and exhaustion in hemato-poietic stem cells; chronic and excessive type I interferon signaling may cause hematopoietic stem cells reduction. Overall, interferon response appears a poorly effective antiretroviral mechanism, and may actually contribute to HIV-1 disease [7,39].
Among genes previously associated with HIV-1 pathogenesis, the analysis identified a number of significant associations, in particular for genes of the intrinsic cellular defense against retroviruses. Many of these respond to interferon, and thus have the same profile of increased expression with increasing viral load as ISG. Thus, these genes appear ineffective both by their poor specificity against HIV-1 and by the apparent limited response of HIV-1 to increasing titration of the transcripts. We also analysed genes issued from four genome-wide siRNA/shRNA screens [16–19]. Fifteen genes that were associated with decreased cellular permissiveness to infection after silencing, were upregulated with increasing viremiain vivoin the current study. They deserve further inspection for a role in HIV-1 pathogenesis. Although the scope of the present work was not to complete a meta-analytical study of all available genome-wide transcriptome studies and siRNA screens [40], we are aware of the interest to progressively integrate large scale datasets [41].
the present study, none of the candidatecis-acting SNPs, or SNPs in the implicated genes was associated with differences in viral setpoint in a genome-wide association analysis. These results do not contradict current evidence of mechanisms of viral control through differences in expression levels of particular genes, most notably CCR5 [42]. Rather, the analysis indicates that polymor-phisms in genes implicated in the differential expression programs do not represent a strong source of variation at the population level.
There are a number of technical and conceptual limits to the study. The study failed to identify a transcriptome profile characteristic of elite controllers. This may be attributed to the large scale approach, as the current technology covers a total of 25,440 annotated human genes. While this allows for pathway or network analyses, it may fail in the identification of subtle expression changes, in particular at the level of the individual gene. On one hand, the analysis would require greater study power (ie, additional elite controllers) to compensate the penalty of correction for multiple testing. On the other hand, the precision of several of analyses described earlier in this section could be improved through the added resolution of new technology such as RNA-Seq [31], or the targeted multiplexed measurement of gene expression in selected pathways [43]. High-throughput deep sequencing results in a superior dynamic range, and allows quantitative analysis of coding and non-coding region transcripts, such as small RNAs. It should also be pointed out that the use of cryopreserved cells may result in changes in the transcriptome and in transcript stability. However, this allowed the investigation of a large number of samples from seroconverting individuals in batch analyses. We argue that the internal consistency of the results and the general agreement across studies supports the robust nature of the transcription profiles that were generated.
In conclusion, while this study suggests that the generalized upregulation of ISG, an important component of viral defense, does not lead to consistently improved viral control throughout the course of infection, it does not implicate any specific gene expression network in viral control. There are several possible explanations for these observations. First, the most important cellular populations for determining control may be effector cells such as CD8+T cells or NK cells whose expression patterns have not been evaluated here. Second, the key expression patterns that determine eventual control may be only detectable early in infection and thus largely missed in studies focusing on cells taken during the setpoint period. These possibilities argue strongly that the next phase of expression work in the study of HIV-1 control must focus on large scale analysis of isolated populations of effector cells taken from individuals as early in the course of infection as possible and in a standardized fashion. We believe the approach taken here provides a general template for such studies.
Materials and Methods
Ethics statement
Study participants were followed in the Swiss HIV Cohort Study (www.shcs.ch). The Genetics Project of the Swiss HIV Cohort Study was approved by the ethics committees of all participating centers, and the permission for genomic work was approved by the Institutional Review Board/Ethics Committee of the University Hospital of Lausanne. Participants gave written, informed consent for genetic testing.
Participants
198 HIV-1 infected individuals from the Swiss HIV Cohort study with a known date of seroconversion (n = 182), or elite
controllers (n = 16) were included in the study. Seroconversion was defined on the basis of a documented positive test and date and a documented negative test less than two years before the first positive test. The viral setpoint was calculated for each participant by using a median of 4 (range 2 to 8) plasma HIV-1 RNA determinations obtained in the absence of antiretroviral treatment between 3 months and 3 years after seroconversion, as previously described [2]. See Text S1 for the detail definition of viral setpoint and of elite controllers. When available, HIV-1 infected participants contributed samples during stable viral setpoint before and under effective ART (median [IQR] from treatment initiation to sample collection was 1297 (434–2730) days). In addition three healthy blood donors provided three control samples used as biological replicas. Quality control steps at the level of cellular viability, RNA integrity, microarray and hybridization quality, and data analysis led to a final number of 190 samples from 153 participants and 8 samples from 3 healthy controls (68% of valid samples, 78% of successful recruitment). The demographic characteristics of the patients and the flow chart of enrollment and sample validation is presented in Text S1. Representative examples of QC checks are presented in Supplementary Figure S2.
Cell isolation and RNA extraction
CD4+ T cells were positively selected from frozen PBMCs (median time [IQR] of cryopreservation was 616 [333–1448] days) using magnetically labeled CD4 microbeads and subsequent column purification according to the manufacturer’s protocol (Miltenyi Biotec). CD4+T cell purity, verified by flow cytometry, was 95.6% (86.4–98.1%) [median (range)]. CD4+T cell viability was assessed by the trypan blue dye exclusion method using the Vi-CELL (Beckman Coulter). Total RNA was extracted from purified CD4+ T cells using mirVana miRNA isolation kit (Ambion) according to the manufacturer’s protocol for total RNA extraction. RNA amount was estimated by spectrophotom-etry using the Nanodrop 1000 (Thermo Fisher). RNA quality was determined by Agilent RNA 6000 pico kit on an Agilent 2100 Bioanalyzer. We used cryopreserved samples because of the interest to analyse a large population of seroconverting individuals during the precise window of stable viral setpoint. Samples were collected between 1995 and 2007, and investigated in 2008. The median (range) of CD4+ T cell viability for samples that were successfully analysed was 78.5% (IQR 70.5–85.3). Viability was minimally dependent on time of cryopreservation, and more dependent on collection center. These covariates were included in the analyses (see below).
Transcriptome analysis and genome-wide genotyping 200 ng of total RNA was amplified and labeled using the Illumina TotalPrep RNA Amplification kit (Ambion). cRNA quality was assessed by capillary electrophoresis on Agilent 2100 Bioanalyzer. Expression levels of over 48,000 mRNA transcripts were assessed by the Human-6 v3 Expression BeadChips (Illumina). Hybridization was carried out according to the manufacturer’s instructions. Genome-wide SNP data had been generated from genomic DNA using the HumanHap550 Geno-typing BeadChip (Illumina) with 555,352 SNPs [2].
Selection of candidate genes for subanalysis
org). For the three large siRNA screens, that resulted in over 600 candidates, we restricted analysis to (i) genes identified in at least two of three screens, or to (ii) genes with SNPs that reached a nominal significant p value in a recent genome-wide association study of determinants of susceptibility to HIV-1 [2].
Data pre-processing
Bead summary data was output from Illumina’s BeadStudio software without background correction, as this has previously been shown to have detrimental effects [50]. Data pre-processing, including a variance-stabilizing transformation [51] and robust-spline normalization were applied as implemented in the lumi package [52] of R. Four outlier samples identified based on aberrant expression of control probes and aberrant median-interquartile range values compared to other samples were removed.
Differential expression analysis
We applied an empirical Bayes analysis approach within a linear mixed-model framework to identify associations between variation in gene expression and in viral setpoint. The Empirical Bayes approach has been developed to model the variation profiles of all genes and use that information as prior knowledge to better estimate the variance of each gene expression [53–55]. In addition, we used a more conservative gene-by-gene modeling approach for result comparison with the empirical Bayes approach. We controlled for variation caused by gender, age, CD4+T cell viability, location of sample collection, and laboratory batch effects. Effect of chip batch was modeled as a random effect; all others were fixed or continuous. All samples from untreated individuals were tested for association of expression with viral setpoint. We used a false discovery rate (FDR) method [56] to control for multiple testing. Probes selected for further analysis had an FDR-adjusted p-value,0.01. A separate analysis compared expression in samples from treated and untreated individuals, using a similar mixed-model approach as above, but also incorporating viral load as a factor in the analysis.
We tested for effect of treatment by separately comparing samples from treated individuals to each of the untreated groups, using the limma (linear models for microarray data) package in R with FDR adjustment as above. This analysis explicitly excluded samples from the same individuals because the statistical approach did not allow control for both the correlation between paired samples and the strong correlation (batch) effect of chip. To compare samples from treated and untreated individuals with samples from uninfected controls, we clustered the expression profiles for a selected group of individuals. We performed 1000 replicate clusterings on the Pearson correlation coefficient, using the ‘‘ward’’ clustering method as implemented in the pvclust package in R.
Pathway and network analyses
The Search Tool for the Retrieval of Interacting Genes/ Proteins (STRING) (http://string.embl.de/) was used to identify known and predicted interactions (derived from four sources: genomic context, high-throughput experiments, co-expression, and previous knowledge). DAVID Bioinformatic resources (http://david.abcc.ncifcrf.gov/) using the annotation sources GOTERM-BP (biological process), and GOTERM-MF (molecu-lar function) identified functional categories [57]. Ingenuity Pathway Analysis 7.0 (IPA) (http://www.ingenuity.com/) was used for the analysis of pathway enrichment. Analysis was limited to genes significantly associated with viral load (FDR p-value,0.01).
Screen forcis-acting SNPs regulating transcript expression levels in HIV-infected CD4+T cells
Normalized expression data was exported for all untreated, HIV-1 infected individuals (n = 125). Only probes that tar-geted fully annotated genes were included in the analysis. A principal components analysis was run to assess batch effects. The cis-screen consisted of a scan for common SNPs, within 100 kb of the defined gene start and stop positions, for effects on transcript expression levels. The analysis was limited to SNPs with a minor allele frequency greater than 0.04, requiring at least ten alleles to be present to detect associations with a low false positive rate. This analysis was performed using a standard linear regression, incorporating age, gender, and 11 eigenstrat axes to correct for population stratification. In total, there were 1,330,529 tests run, therefore using a Bonferroni correction, a p,3.861028 was used to declare a statistically significant association.
Microarray data accession number
All microarray results have been deposited in the Gene Expression Omnibus database (GSE18233).
Supporting Information
Figure S1 OAS1was found to be regulated by an intronic SNP (rs3177979) located near exon 6.
Found at: doi:10.1371/journal.ppat.1000781.s001 (7.16 MB TIF)
Figure S2 Quality control. Outlier samples were identified based on aberrant expression of control probes and aberrant median-interquartile range values.
Found at: doi:10.1371/journal.ppat.1000781.s002 (0.34 MB TIF)
Table S1 Genes differentially expressed (at adjusted p#0.01) according to the empirical Bayes approach. (A) 209 genes that are upregulated at high viral load. (B) 51 genes that are downregulated at high viral load.
Found at: doi:10.1371/journal.ppat.1000781.s003 (0.06 MB XLS)
Table S2 Enrichment of biological process and molecular function determined using DAVID. (A) Enrichment for the 209 genes that are upregulated at high viral load. (B) Enrichment for the 51 genes that are downregulated at high viral load.
Found at: doi:10.1371/journal.ppat.1000781.s004 (0.04 MB XLS)
Table S3 Pathway enrichment for the 260 differentially expressed genes according to Ingenuity.
Found at: doi:10.1371/journal.ppat.1000781.s005 (0.02 MB XLS)
Table S4 Genes differentially expressed (at adjusted p#0.01) according to the more conservative gene-by-gene modeling approach.
Found at: doi:10.1371/journal.ppat.1000781.s006 (0.02 MB XLS)
Table S5 Genes differentially expressed when analysis is adjusted by expression ofCD25as covariate.
Found at: doi:10.1371/journal.ppat.1000781.s007 (0.08 MB XLS)
Table S6 List of interferon regulated genes.
Found at: doi:10.1371/journal.ppat.1000781.s008 (0.03 MB XLS)
Table S7 Analysis of expression profile of genes associated with HIV life cycle and pathogenesis.
Found at: doi:10.1371/journal.ppat.1000781.s009 (0.04 MB XLS)
Table S8 Genes identified in the current study that have been previously reported in genome-wide siRNA screens.
Table S9 Overlapping genes associated with difference in viral setpoint and associated with changes in transcriptome profile after treatment.
Found at: doi:10.1371/journal.ppat.1000781.s011 (0.04 MB XLS)
Table S10 Study-wide significant SNP-probe associations. Found at: doi:10.1371/journal.ppat.1000781.s012 (0.32 MB XLS)
Table S11 Genes showingcis-regulation (eQTLs) in CD4 T cells among 260 genes with expression associated with viral set point. Found at: doi:10.1371/journal.ppat.1000781.s013 (0.03 MB XLS)
Table S12 Genes identified in the current study that have been previously reported in genome-wide studies in Dengue.
Found at: doi:10.1371/journal.ppat.1000781.s014 (0.03 MB XLS)
Text S1 Supplementary materials
Found at: doi:10.1371/journal.ppat.1000781.s015 (0.88 MB DOC)
Acknowledgments
We thank S. Colombo, D. Bielser and I. Durussel for coordination and technical support.
The members of the Swiss HIV Cohort Study are M. Battegay, E. Bernasconi, J. Bo¨ni, HC Bucher, Ph. Bu¨rgisser, A. Calmy, S. Cattacin, M.
Cavassini, R. Dubs, M. Egger, L. Elzi, P. Erb, M. Fischer, M. Flepp, A. Fontana, P. Francioli (President of the SHCS, Centre Hospitalier Universitaire Vaudois, CH-1011- Lausanne), H. Furrer (Chairman of the Clinical and Laboratory Committee), C. Fux, M. Gorgievski, H. Gu¨nthard (Chairman of the Scientific Board), H. Hirsch, B. Hirschel, I. Ho¨sli, Ch. Kahlert, L. Kaiser, U. Karrer, C. Kind, Th. Klimkait, B. Ledergerber, G. Martinetti, B. Martinez, N. Mu¨ller, D. Nadal, M. Opravil, F. Paccaud, G. Pantaleo, A. Rauch, S. Regenass, M. Rickenbach (Head of Data Center), C. Rudin (Chairman of the Mother & Child Substudy), P. Schmid, D. Schultze, J. Schu¨pbach, R. Speck, P. Taffe´, P. Tarr, A. Telenti, A. Trkola, P. Vernazza, R. Weber, S. Yerly.
The Center for HIV-AIDS Vaccine Immunology (CHAVI) is led by B. Haynes (Duke University, Durham NC, USA). Its Host Genetics Core is led by D. Goldstein (Duke University, Durham NC, USA). CHAVI is founded by the National Institute of Allergy and Infectious Diseases (USA).
Author Contributions
Conceived and designed the experiments: MR DBG AT. Performed the experiments: MR PD. Analyzed the data: MR KKD JF ELH DG. Contributed reagents/materials/analysis tools: SF DBG AT. Wrote the paper: MR KKD JF AT. Performed the genome-wide genotyping: JF PD KVS. Reviewed the manuscript for important intellectual content and approved of the final version: ELH SF PD KVS DG HFG. Organized the clinical cohort: MR HFG AT.
References
1. Telenti A, Goldstein DB (2006) Genomics meets HIV. Nat Rev Microbiol 4: 9–18.
2. Fellay J, Shianna KV, Ge D, Colombo S, Ledergerber B, et al. (2007) A Whole-Genome Association Study of Major Determinants for Host Control of HIV-1. Science 317: 944–947.
3. Dalmasso C, Carpentier W, Meyer L, Rouzioux C, Goujard C, et al. (2008) Distinct genetic loci control plasma HIV-RNA and cellular HIV-DNA levels in HIV-1 infection: the ANRS Genome Wide Association 01 study. PLoS ONE 3: e3907. doi:10.1371/journal.pone.0003907.
4. Limou S, Le CS, Coulonges C, Carpentier W, Dina C, et al. (2009) Genomewide Association Study of an AIDS-Nonprogression Cohort Empha-sizes the Role Played by HLA Genes (ANRS Genomewide Association Study 02). J Infect Dis 199: 419–426.
5. Fellay J, Ge D, Shianna KV, Colombo S, Ledergerber B, et al. (2009) Common Genetic Variation and the Control of HIV-1 in Humans. PLoS Genet 5: e1000791. doi:10.1371/journal.pgen.1000791.
6. Giri MS, Nebozhyn M, Showe L, Montaner LJ (2006) Microarray data on gene modulation by HIV-1 in immune cells: 2000–2006. J Leukoc Biol 80: 1031–1043.
7. Sedaghat AR, German J, Teslovich TM, Cofrancesco J Jr, Jie CC, et al. (2008) Chronic CD4+T-cell activation and depletion in human immunodeficiency virus type 1 infection: type I interferon-mediated disruption of T-cell dynamics. J Virol 82: 1870–1883.
8. Hyrcza MD, Kovacs C, Loutfy M, Halpenny R, Heisler L, et al. (2007) Distinct transcriptional profiles in ex vivo CD4+and CD8+T cells are established early in human immunodeficiency virus type 1 infection and are characterized by a chronic interferon response as well as extensive transcriptional changes in CD8+ T cells. J Virol 81: 3477–3486.
9. Chun TW, Justement JS, Lempicki RA, Yang J, Dennis G Jr, et al. (2003) Gene expression and viral prodution in latently infected, resting CD4+T cells in viremic versus aviremic HIV-infected individuals. Proc Natl Acad Sci U S A 100: 1908–1913.
10. Imbeault M, Ouellet M, Tremblay MJ (2009) Microarray study reveals that HIV-1 induces rapid type-I interferon-dependent p53 mRNA up-regulation in human primary CD4+T cells. Retrovirology 6: 5.
11. Giri MS, Nebozyhn M, Raymond A, Gekonge B, Hancock A, et al. (2009) Circulating monocytes in HIV-1-infected viremic subjects exhibit an anti-apoptosis gene signature and virus- and host-mediated anti-apoptosis resistance. J Immunol 182: 4459–4470.
12. Nica AC, Dermitzakis ET (2008) Using gene expression to investigate the genetic basis of complex disorders. Hum Mol Genet 17: R129–R134. 13. Veyrieras JB, Kudaravalli S, Kim SY, Dermitzakis ET, Gilad Y, et al. (2008)
High-resolution mapping of expression-QTLs yields insight into human gene regulation. PLoS Genet 4: e1000214. doi:10.1371/journal.pgen.1000214. 14. Bowie AG, Unterholzner L (2008) Viral evasion and subversion of
pattern-recognition receptor signalling. Nat Rev Immunol 8: 911–922.
15. Ortiz M, Guex N, Patin E, Martin O, Xenarios I, et al. (2009) Evolutionary Trajectories of Primate Genes Involved in HIV Pathogenesis. Mol Biol Evol 26: 2865–2875.
16. Brass AL, Dykxhoorn DM, Benita Y, Yan N, Engelman A, et al. (2008) Identification of host proteins required for HIV infection through a functional genomic screen. Science 319: 921–926.
17. Konig R, Zhou Y, Elleder D, Diamond TL, Bonamy GM, et al. (2008) Global analysis of host-pathogen interactions that regulate early-stage HIV-1 replica-tion. Cell 135: 49–60.
18. Zhou H, Xu M, Huang Q, Gates AT, Zhang XD, et al. (2008) Genome-scale RNAi screen for host factors required for HIV replication. Cell Host Microbe 4: 495–504.
19. Yeung ML, Houzet L, Yedavalli VS, Jeang KT (2009) A genome-wide short hairpin RNA screening of jurkat T-cells for human proteins contributing to productive HIV-1 replication. J Biol Chem 284: 19463–19473.
20. Li Q, Smith AJ, Schacker TW, Carlis JV, Duan L, et al. (2009) Microarray analysis of lymphatic tissue reveals stage-specific, gene expression signatures in HIV-1 infection. J Immunol 183: 1975–1982.
21. Heinzen EL, Ge D, Cronin KD, Maia JM, Shianna KV (2008) Tissue-specific genetic control of splicing: implications for the study of complex traits. PLoS Biol 6: e1000001. doi:10.1371/journal.pbio.1000001.
22. Bonnevie-Nielsen V, Field LL, Lu S, Zheng DJ, Li M, et al. (2005) Variation in antiviral 29,59-oligoadenylate synthetase (2959AS) enzyme activity is controlled by a single-nucleotide polymorphism at a splice-acceptor site in the OAS1 gene. Am J Hum Genet 76: 623–633.
23. Lim JK, Lisco A, McDermott DH, Huynh L, Ward JM, et al. (2009) Genetic variation in OAS1 is a risk factor for initial infection with West Nile virus in man. PLoS Pathog 5: e1000321. doi:10.1371/journal.ppat.1000321. 24. Zolotukhin AS, Felber BK (1997) Mutations in the nuclear export signal of human
ran-binding protein RanBP1 block the Rev-mediated posttranscriptional regula-tion of human immunodeficiency virus type 1. J Biol Chem 272: 11356–11360. 25. Fink J, Gu F, Ling L, Tolfvenstam T, Olfat F, et al. (2007) Host gene expression
profiling of dengue virus infection in cell lines and patients. PLoS Negl Trop Dis 1: e86. doi:10.1371/journal.pntd.0000086.
26. Long HT, Hibberd ML, Hien TT, Dung NM, Van NT, et al. (2009) Patterns of gene transcript abundance in the blood of children with severe or uncomplicated dengue highlight differences in disease evolution and host response to dengue virus infection. J Infect Dis 199: 537–546.
27. Simmons CP, Popper S, Dolocek C, Chau TN, Griffiths M, et al. (2007) Patterns of host genome-wide gene transcript abundance in the peripheral blood of patients with acute dengue hemorrhagic fever. J Infect Dis 195: 1097–1107. 28. Ubol S, Masrinoul P, Chaijaruwanich J, Kalayanarooj S, Charoensirisuthikul T,
et al. (2008) Differences in global gene expression in peripheral blood mononuclear cells indicate a significant role of the innate responses in progression of dengue fever but not dengue hemorrhagic fever. J Infect Dis 197: 1459–1467.
29. Wu JQ, Dwyer DE, Dyer WB, Yang YH, Wang B, et al. (2008) Transcriptional profiles in CD8+T cells from HIV+progressors on HAART are characterized by coordinated up-regulation of oxidative phosphorylation enzymes and interferon responses. Virology 380: 124–135.
31. Herbeuval JP, Shearer GM (2007) HIV-1 immunopathogenesis: how good interferon turns bad. Clin Immunol 123: 121–128.
32. Reinhart TA, Fallert BA, Pfeifer ME, Sanghavi S, Capuano S III, et al. (2002) Increased expression of the inflammatory chemokine CXC chemokine ligand 9/ monokine induced by interferon-gamma in lymphoid tissues of rhesus macaques during simian immunodeficiency virus infection and acquired immunodeficiency syndrome. Blood 99: 3119–3128.
33. Abel K, Alegria-Hartman MJ, Rothaeusler K, Marthas M, Miller CJ (2002) The relationship between simian immunodeficiency virus RNA levels and the mRNA levels of alpha/beta interferons (IFN-alpha/beta) and IFN-alpha/beta-inducible Mx in lymphoid tissues of rhesus macaques during acute and chronic infection. J Virol 76: 8433–8445.
34. Khatissian E, Tovey MG, Cumont MC, Monceaux V, Lebon P, et al. (1996) The relationship between the interferon alpha response and viral burden in primary SIV infection. AIDS Res Hum Retroviruses 12: 1273–1278. 35. Bosinger SE, Hosiawa KA, Cameron MJ, Persad D, Ran L, et al. (2004) Gene
expression profiling of host response in models of acute HIV infection. J Immunol 173: 6858–6863.
36. Lederer S, Favre D, Walters KA, Proll S, Kanwar B, et al. (2009) Transcriptional profiling in pathogenic and non-pathogenic SIV infections reveals significant distinctions in kinetics and tissue compartmentalization. PLoS Pathog 5: e1000296. doi:10.1371/journal.ppat.1000296.
37. Mandl JN, Barry AP, Vanderford TH, Kozyr N, Chavan R, et al. (2008) Divergent TLR7 and TLR9 signaling and type I interferon production distinguish pathogenic and nonpathogenic AIDS virus infections. Nat Med 14: 1077–1087.
38. Sato T, Onai N, Yoshihara H, Arai F, Suda T, et al. (2009) Interferon regulatory factor-1 protects quiescent hematopoietic stem cells from type I interferon-dependent exhaustion. Nat Med;doi:10.1038/nm.1973.
39. Boasso A, Shearer GM (2008) Chronic innate immune activation as a cause of HIV-1 immunopathogenesis. Clin Immunol 126: 235–242.
40. Bushman FD, Malani N, Fernandes J, D’Orso I, Cagney G, et al. (2009) Host cell factors in HIV replication: meta-analysis of genome-wide studies. PLoS Pathog 5: e1000437. doi:10.1371/journal.ppat.1000437.
41. Telenti A (2009) HIV-1 host interactions - integration of large scale datasets. F1000 Biology Reports 1: 71.
42. Martin MP, Dean M, Smith MW, Winkler C, Gerrard B, et al. (1998) Genetic acceleration of AIDS progression by a promoter variant of CCR5. Science 282: 1907–1911.
43. Geiss GK, Bumgarner RE, Birditt B, Dahl T, Dowidar N, et al. (2008) Direct multiplexed measurement of gene expression with color-coded probe pairs. Nat Biotechnol 26: 317–325.
44. Swanson CM, Malim MH (2008) SnapShot: HIV-1 proteins. Cell 133: 742, 742. 45. Goff SP (2007) Host factors exploited by retroviruses. Nat Rev Microbiol 5:
253–263.
46. Nisole S, Stoye JP, Saib A (2005) TRIM family proteins: retroviral restriction and antiviral defence. Nat Rev Microbiol 3: 799–808.
47. Harris RS, Liddament MT (2004) Retroviral restriction by APOBEC proteins. Nat Rev Immunol 4: 868–877.
48. Loeuillet C, Deutsch S, Ciuffi A, Robyr D, Taffe P, et al. (2008) In vitro whole-genome analysis identifies a susceptibility locus for HIV-1. PLoS Biol 6: e32. doi:10.1371/journal.pbio.0060032.
49. Neil SJ, Zang T, Bieniasz PD (2008) Tetherin inhibits retrovirus release and is antagonized by HIV-1 Vpu. Nature 451: 425–430.
50. Dunning MJ, Barbosa-Morais NL, Lynch AG, Tavare S, Ritchie ME (2008) Statistical issues in the analysis of Illumina data. BMC Bioinformatics 9: 85. 51. Lin SM, Du P, Huber W, Kibbe WA (2008) Model-based variance-stabilizing
transformation for Illumina microarray data. Nucleic Acids Res 36: e11. 52. Du P, Kibbe WA, Lin SM (2008) lumi: a pipeline for processing Illumina
microarray. Bioinformatics 24: 1547–1548.
53. Smyth GK (2004) Linear models and empirical bayes methods for assessing differential expression in microarray experiments. Stat Appl Genet Mol Biol 3: Article3.
54. Feng S, Wolfinger R, Chu Z, Gibson G, McGraw L (2006) Empirical Bayesian analysis of variance component models for microarray data. J Agric Biol Environ Stats 11: 197–209.
55. Lo¨nnstedt I, Speed T (2002) Replicated microarray data. Stat Sinica 12: 31–46. 56. Benjamini Y, Hochberg Y (1995) Controlling the false discovery rate: a practical
and powerful approach to multiple testing. J R Statist Soc B 57: 289. 57. Dennis G Jr, Sherman BT, Hosack DA, Yang J, Gao W, et al. (2003) DAVID: