GMDD
8, 5437–5479, 2015Sensitivity of WRF to reproduce surface wind over complex
terrain
J. J. Gómez-Navarro et al.
Title Page
Abstract Introduction
Conclusions References
Tables Figures
◭ ◮
◭ ◮
Back Close
Full Screen / Esc
Printer-friendly Version Interactive Discussion
Discussion
P
a
per
|
Discussion
P
a
per
|
Discussion
P
a
per
|
Discussion
P
a
per
|
Geosci. Model Dev. Discuss., 8, 5437–5479, 2015 www.geosci-model-dev-discuss.net/8/5437/2015/ doi:10.5194/gmdd-8-5437-2015
© Author(s) 2015. CC Attribution 3.0 License.
This discussion paper is/has been under review for the journal Geoscientific Model Development (GMD). Please refer to the corresponding final paper in GMD if available.
Sensitivity of the WRF model to PBL
parametrizations and nesting techniques:
evaluation of surface wind over complex
terrain
J. J. Gómez-Navarro1,2, C. C. Raible1,2, and S. Dierer3 1
Climate and Environmental Physics, Physics Institute, University of Bern, Sidlerstrasse 5, 3012 Bern, Switzerland
2
Oeschger Centre for Climate Change Research, Sidlerstrasse 5, 3012 Bern, Switzerland
3
Axis, Brandschenkestrasse 90, 8002 Zurich, Switzerland
Received: 13 May 2015 – Accepted: 25 June 2015 – Published: 15 July 2015
Correspondence to: J. J. Gómez-Navarro ([email protected])
GMDD
8, 5437–5479, 2015Sensitivity of WRF to reproduce surface wind over complex
terrain
J. J. Gómez-Navarro et al.
Title Page
Abstract Introduction
Conclusions References
Tables Figures
◭ ◮
◭ ◮
Back Close
Full Screen / Esc
Printer-friendly Version Interactive Discussion
Discussion
P
a
per
|
Discussion
P
a
per
|
Discussion
P
a
per
|
Discussion
P
a
per
|
Abstract
Simulating surface wind over complex terrain is a challenge in regional climate mod-elling. Therefore, this study aims at identifying a setup of the WRF model that minimizes systematic errors of surface winds in hindcast simulations. Major factors of the model configuration are tested to find a suitable setup: the horizontal resolution, the PBL
pa-5
rameterization scheme and the way WRF is nested to the driving dataset. Hence, a number of sensitivity simulations at a spatial resolution of 2 km are carried out and compared to observations. Given the importance of wind storms, the analysis is based on case studies of 24 historical wind storms that caused great economic damage in Switzerland. Each of these events is downscaled using eight different model setups,
10
but sharing the same driving dataset. The results show that the unresolved topography leads to a general overestimation of wind speed in WRF. However, this bias can be substantially reduced by using a PBL scheme that explicitly considers the effects of
non-resolved topography, which also improves the spatial structure of wind speed over Switzerland. The wind direction, although generally well reproduced, is not very
sensi-15
tive to the PBL scheme. Further sensitivity tests include four types of nesting methods: nesting only at the boundaries of the outermost domain, analysis and spectral nudg-ing, and the so-called re-forecast method, where the simulation is frequently restarted. These simulations show that restricting the freedom of the model to develop large-scale disturbances slightly increases the temporal agreement with the observations,
20
at the same time that it further reduces the overestimation of wind speed, especially for maximum wind peaks. The model skill is also evaluated in the outermost domains, where the resolution is coarser. The results demonstrate the important role of horizon-tal resolution, where the step from 6 to 2 km significantly improves model performance. In summary, the combination of a grid size of 2 km, the non-local PBL scheme modified
25
GMDD
8, 5437–5479, 2015Sensitivity of WRF to reproduce surface wind over complex
terrain
J. J. Gómez-Navarro et al.
Title Page
Abstract Introduction
Conclusions References
Tables Figures
◭ ◮
◭ ◮
Back Close
Full Screen / Esc
Printer-friendly Version Interactive Discussion
Discussion
P
a
per
|
Discussion
P
a
per
|
Discussion
P
a
per
|
Discussion
P
a
per
|
1 Introduction
Prominent features of the North Atlantic and European climate are cyclonic distur-bances, which may be intensified and lead to severe storms (von Storch and Weisse, 2008). Several severe wind storms have hit Central Europe during the last decades (Schiesser et al., 1997; Etienne et al., 2013). These events, although rare, produce
5
considerable economical cost and are listed as an important natural hazard in Eu-rope (Beniston et al., 2007). Ongoing economic and demographic growth, as well as climate change may imply even stronger impacts in the future, which has raised con-cerns among reinsurance companies, since isolated events such as storm Lothar in December 1999 caused damages of up to USD 12 billion (MunichRe, 2001). A
bet-10
ter understanding of the mechanisms leading to severe wind storms, and a reliable projection of their characteristics under climate change conditions is important to min-imize the impact of such events in contemporary and future societies (Muskulus and Jacob, 2005; Goyette, 2010). However, wind is still not as widely studied as temper-ature or precipitation (e.g. Schär et al., 2004; Kjellström et al., 2007; Rajczak et al.,
15
2013). For example in areas of complex terrain like Switzerland the main focus of high resolution simulations with respect to wind is on case studies (Goyette, 2008; Etienne et al., 2013). Recently, simulations of about 90 storms over Switzerland are combined to a storm climatology (Welker et al., 2015).
The fundamental problem regarding surface wind is its intrinsically complex nature,
20
particularly over areas of complex terrain like the Alps (Whiteman, 2000). This com-plexity precludes its realistic simulation with coarse-resolution models, but also ham-pers the extrapolation of local observations onto regular grids, which could be used for impact studies. Dynamical downscaling is a common tool that allows bridging the gap between the coarse resolution of Global Circulation Models (GCMs) or reanalysis
25
cli-GMDD
8, 5437–5479, 2015Sensitivity of WRF to reproduce surface wind over complex
terrain
J. J. Gómez-Navarro et al.
Title Page
Abstract Introduction
Conclusions References
Tables Figures
◭ ◮
◭ ◮
Back Close
Full Screen / Esc
Printer-friendly Version Interactive Discussion
Discussion
P
a
per
|
Discussion
P
a
per
|
Discussion
P
a
per
|
Discussion
P
a
per
|
mate in a limited area domain. This reduces computational costs, which in turn allows implementing simulations with higher spatial resolutions. RCMs driven by GCMs are used for a variety of applications: from climate change projections (Kjellström et al., 2007; van der Linden and Mitchell, 2009; Gómez-Navarro et al., 2010; Jerez et al., 2013; Rajczak et al., 2013; Jacob et al., 2013) to paleoclimatology (Gómez-Navarro
5
et al., 2013, and references therein). Besides, they are used in the so-called hindcast simulations, which blend the reliability of reanalysis products with the high-resolution provided by RCMs. Studies focusing specifically on wind have been one of the applica-tions of such type of simulaapplica-tions (Jiménez et al., 2010; Jerez and Trigo, 2013; Etienne et al., 2013; García-Díez et al., 2013; Menendez et al., 2014; Lorente-Plazas et al.,
10
2014a; Draxl et al., 2014).
RCMs, however, contain various sources of uncertainties, like deviations in the driv-ing dataset, numerical approximations, as well as parametrizations of the sub-grid pro-cesses. A number of studies in different locations assessed the sensitivity of the model
performance due to different model configurations. Dierer et al. (2005) studied the
de-15
pendency of wind speed on the Planetary Boundary Layer (PBL) parameterizations implemented in the model MM5 as well as the atmospheric stability in different
Euro-pean countries. More recently, García-Díez et al. (2013) focused on the role of different
PBL schemes. Other studies have investigated the role of the PBL schemes in the abil-ity of simulating surface wind of typhoons (Kwun et al., 2009), along the coast of the
20
Mediterranean Sea (Menendez et al., 2014), or in Southern Spain (Santos-Alamillos et al., 2013).
Although the studies discussed above tackle the problem of the uncertainties in the model configuration regarding wind, they do not focus on areas of complex topography. As suggested by Jiménez et al. (2008), in such areas the spatial resolution becomes
25
GMDD
8, 5437–5479, 2015Sensitivity of WRF to reproduce surface wind over complex
terrain
J. J. Gómez-Navarro et al.
Title Page
Abstract Introduction
Conclusions References
Tables Figures
◭ ◮
◭ ◮
Back Close
Full Screen / Esc
Printer-friendly Version Interactive Discussion
Discussion
P
a
per
|
Discussion
P
a
per
|
Discussion
P
a
per
|
Discussion
P
a
per
|
potentially important sensitivities of the model setup are explored, which encompass spatial resolution, PBL parameterizations and the use of nudging techniques. The sen-sitivity with respect to the driving data set is not investigated in order to concentrate on the sensitivity within the model. Geographically the study focuses on the Alpine area. Since the simulations at 2 km grid size require significant computational power, the
5
study is based on a case study approach, rather than continuous simulations. Hence, a total of 24 historical wind storms is simulated for each model setup.
The study is structured as follows: Sect. 2 presents the reanalysis product used to drive the RCM and the observational network. Section 3 describes the model setup including the different nesting options tested in this study. It further presents the set of
10
sensitivity experiments carried out. The results are discussed in Sect. 4 focusing first on the role of the PBL scheme and the nesting method applied. Then, the role of the horizontal resolution is discussed, including how errors are spatially distributed over different areas of the Alps. Finally, Sect. 5 draws main conclusions.
2 Data
15
2.1 Reanalysis dataset
The dataset providing the initial and boundary conditions for the RCM is the ERA-Interim reanalysis (Dee et al., 2011). It spans the period from 1979 to today, and is used in its highest resolution of 0.75◦×0.75◦. The ERA-Interim dataset is generated by run-ning the Integrated Forecast System model (version 2006) of the European Centre for
20
Medium-Range Weather Forecasts (ECMWF). The horizontal resolution of the model is T255 (approximately 80 km). The model has 60 vertical levels up to a pressure level of 0.1 hPa. Observational data are assimilated with a 4-dimensional variational analy-sis (4D-Var) in a 12 h analyanaly-sis window. A number of observational datasets are used ranging from satellite data to surface pressure observations and radiosonde profiles
25
obser-GMDD
8, 5437–5479, 2015Sensitivity of WRF to reproduce surface wind over complex
terrain
J. J. Gómez-Navarro et al.
Title Page
Abstract Introduction
Conclusions References
Tables Figures
◭ ◮
◭ ◮
Back Close
Full Screen / Esc
Printer-friendly Version Interactive Discussion
Discussion
P
a
per
|
Discussion
P
a
per
|
Discussion
P
a
per
|
Discussion
P
a
per
|
vations of surface wind, which is important to avoid circularity given that this study uses wind observations in the validation part, neither observations of pressure and humidity over high terrain (typically elevations higher than 1500 m).
2.2 Observational data
To evaluate the model’s ability in dynamically downscaling wind storms, a reliable set
5
of observations is required. In particular, this is the case in areas of complex terrain, where wind speed and direction can vary within distances of tens of meters. The Swiss Federal Office of Meteorology and Climatology (MeteoSwiss) provides such
observa-tions from a dense network of weather staobserva-tions. This dataset contains 10 min mean values of wind speed and direction. The model simulations are evaluated hereafter by
10
using hourly means of weather station wind measurements calculated from their 10 min mean.
Some basic data checks are carried out before using the data in the evaluation. Following an approach similar to Lorente-Plazas et al. (2014b), all series are visually inspected. Simple plausibility checks are performed, such as calculating and plotting
15
the running mean and standard deviation to search for anomalies. Stations showing spurious jumps or gaps are discarded from the analysis hereafter. The measurement heights above ground differ. Therefore, the simulated wind is linearly interpolated to the
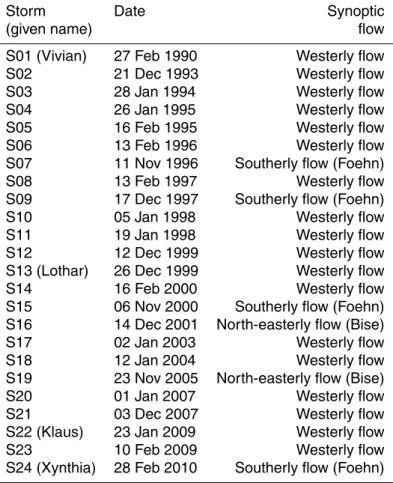
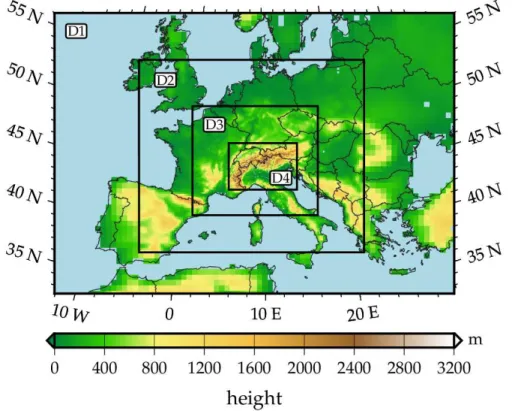
measurement height for the comparison with observations. After the quality checks, the remaining weather station network still sufficiently covers Switzerland (Fig. 1). We
con-20
sider in the analysis all the stations that recorded each individual storm. Note that this number increases with time as the observational network has been growing. Thereby, the first storm selected took place in February 1990, and was recorded by a total of 68 stations and the last storm in February 2010 was recorded by 112 stations. 65 sta-tions capture all 24 storms, 36 missed just one storm, whereas only 4 sites captured
25
GMDD
8, 5437–5479, 2015Sensitivity of WRF to reproduce surface wind over complex
terrain
J. J. Gómez-Navarro et al.
Title Page
Abstract Introduction
Conclusions References
Tables Figures
◭ ◮
◭ ◮
Back Close
Full Screen / Esc
Printer-friendly Version Interactive Discussion
Discussion
P
a
per
|
Discussion
P
a
per
|
Discussion
P
a
per
|
Discussion
P
a
per
|
different geographical and climatic conditions. Still, as suggested by Gómez-Navarro
et al. (2012), the errors and uncertainties contained in the observations shall not be ne-glected, but need to be kept in mind when using it to draw conclusions about simulation performance.
3 Model and experimental design
5
3.1 Model setup
The study is based on the Weather Research and Forecasting Model (WRF, version 3.5), aired in September 2013 (Skamarock et al., 2008). WRF is a limited area me-teorological model used for weather forecasting and climatic purposes. It employs an Eulerian mass-coordinate solver with a non-hydrostatic approach, and a terrain
follow-10
ing eta-coordinate system in the vertical. It is a state-of-the-art mesoscale model used in a variety of studies also for hindcast simulations (Kwun et al., 2009; Jiménez et al., 2010, 2012; Awan et al., 2011; García-Díez et al., 2013; Jiménez and Dudhia, 2013; Santos-Alamillos et al., 2013; Menendez et al., 2014, among others).
A first decision in regional climate modelling concerns the selection of the domain
15
to be simulated. Although this selection is susceptible of introducing uncertainties, this study employs just one domain setup, and hence the sensitivity of the performance to the model domain is not investigated here. There are a number of reasons for this. First, there is not much freedom, in the sense that the domain is primary selected according to the area of interest, in this case the Alpine area. The number of domains
20
is conditioned by the resolution of the driving data set and the final resolution of 2 km aimed in our study. So only one is used in all simulations (Fig. 2). It consists of four two-way nested domains with grid size of 54, 18, 6 and 2 km for the domains D1 to D4, respectively. All domain use a Lambert conformal projection, which conserves the spatial distances in both directions. The analysis hereafter evaluates the model skill
25
GMDD
8, 5437–5479, 2015Sensitivity of WRF to reproduce surface wind over complex
terrain
J. J. Gómez-Navarro et al.
Title Page
Abstract Introduction
Conclusions References
Tables Figures
◭ ◮
◭ ◮
Back Close
Full Screen / Esc
Printer-friendly Version Interactive Discussion
Discussion
P
a
per
|
Discussion
P
a
per
|
Discussion
P
a
per
|
Discussion
P
a
per
|
coarser domains is also investigated to assess the role of the horizontal resolution. Vertically, WRF does not allow using a varying number of levels in nested domains. Hence, the number of vertical levels has been set to 40 in every domain. This number is similar to the number in recent literature, which ranges between 30 and 46 (Miguez-Macho et al., 2004; Lo et al., 2008; Kwun et al., 2009; Jiménez and Dudhia, 2012;
5
Santos-Alamillos et al., 2013; Etienne et al., 2013). The vertical resolution ensures that several eta levels lie below the PBL height at any time. Naturally, the number of levels within the PBL varies at each grid point according to the PBL height due to different
meteorological situations. In the simulations carried out, a minimum (maximum) of 3 (7) levels vertical layers lie within the PBL at any time.
10
Another source of uncertainty is related to the choice of the physical parameteriza-tions, such as microphysics, convection, radiation and the formation of the PBL, among others (Stensrud, 2007). Since the latter is the parameterization that is most relevant for the surface winds, a number of sensitivity tests are conducted and analysed in order to find the most appropriate PBL scheme (see next section). The other
parameteriza-15
tions remain unchanged in all simulations, i.e., the Microphysics WRF Single Moment 6-class scheme (Hong and Lim, 2006), the Kain–Fritsch scheme of cumulus (Kain, 2004), which is implemented only in the two outermost domains, the Rapid and accu-rate Radiative Transfer Model (RRTM) (Mlawer et al., 1997), the short-wave radiation scheme by Dudhia (1989), and the Noah land soil model (Chen and Dudhia, 2001).
20
3.2 PBL schemes
The PBL plays a major role in simulating surface winds (Stensrud, 2007; Kwun et al., 2009; Santos-Alamillos et al., 2013; Menendez et al., 2014). Nowadays, there are many different approximations to account for the relevant subgrid processes that lead to
dif-ferent PBL formations. In this study four different schemes are implemented, which
25
capture a considerable range of different approaches possible. Similar to García-Díez
GMDD
8, 5437–5479, 2015Sensitivity of WRF to reproduce surface wind over complex
terrain
J. J. Gómez-Navarro et al.
Title Page
Abstract Introduction
Conclusions References
Tables Figures
◭ ◮
◭ ◮
Back Close
Full Screen / Esc
Printer-friendly Version Interactive Discussion
Discussion
P
a
per
|
Discussion
P
a
per
|
Discussion
P
a
per
|
Discussion
P
a
per
|
Janjic (MYJ) (Mellor and Yamada, 1982; Janjić, 2001), and the Asymmetric Convective
Model 2 (ACM2), which combines local and non-local transport depending on the at-mosphere conditions (Pleim, 2007a, b). García-Díez et al. (2013) described the diff
er-ent approaches in detail, therefore not repeated here. The fourth scheme is a subtle modification of the YSU scheme that accounts for the unresolved orography by
intro-5
ducing a correction term in the momentum equation (Jiménez and Dudhia, 2012). This scheme aims at correcting a general problem of WRF with simulating wind, namely its tendency to overestimate wind speed (Cheng and Steenburgh, 2005; Mass and Ovens, 2011; Jiménez and Dudhia, 2012). This is in particular a problem in areas of complex terrain, where topographic features not explicitly considered by the coarse resolution
10
of the model introduce further friction. This scheme is referred hereafter as YSU∗.
3.3 Nesting approach
RCMs are nested in a global dataset, which drives the simulation by providing the ini-tial and boundary conditions. Dynamical downscaling is hence mostly an iniini-tial value problem in the first days of the simulation, which evolves into a boundary value problem
15
when the initial state has been “forgotten” by the atmosphere. However, how to spec-ify the lateral boundary conditions is a mathematically ill-posed problem, since they become over-specified (Staniforth, 1997). A solution to this problem, widely adopted in state-of-the-art RCMs, consists of newtonially relaxing the driving fields in a buffer
zone around the borders of the grid (Davies, 1976). This relaxation damps small scale
20
discrepancies, but does not handle large-scales properly and generates disturbances in the large-scale circulation (Miguez-Macho et al., 2005). Several methods have been proposed to deal with this problem.
The first approach basically consists of using Newtonian relaxation at the boundaries without any correction inside the domains. This is referred hereafter as “free
simula-25
paleo-GMDD
8, 5437–5479, 2015Sensitivity of WRF to reproduce surface wind over complex
terrain
J. J. Gómez-Navarro et al.
Title Page
Abstract Introduction
Conclusions References
Tables Figures
◭ ◮
◭ ◮
Back Close
Full Screen / Esc
Printer-friendly Version Interactive Discussion
Discussion
P
a
per
|
Discussion
P
a
per
|
Discussion
P
a
per
|
Discussion
P
a
per
|
simulations. Such simulations are performed with relatively coarse GCMs, so that mod-ifications of the large-scale circulation maybe beneficial, as potential biases from the GCMs may be partly corrected by the RCMs.
In case of reanalysis data used at the boundaries, it may be desirable that the RCM simulation stays close to the large-scale situation of the driving data. A first method
5
to achieve this is the so-called reforecast simulation. The method consists of splitting a long simulation in shorter simulation periods of one to few days, running each period separately and finally merging them. This method effectively minimises the impact of
the boundaries, transforming the problem into a mostly initial-value problem. The re-forecast method is regularly applied (Jiménez and Dudhia, 2012; García-Díez et al.,
10
2013; Menendez et al., 2014, among others), and the increased skill of this method compared to continuous runs has been reported (Lo et al., 2008). A major advantage of this nesting method is its simplicity. However, it has the undesirable side effect of
producing a large number of independent simulations, each of which requiring a spin-up period that has to be discarded. In this study we test this approach by simulating
15
every single day independently, with a spin-up period of 12 h for each run.
A more sophisticated method is to force the RCM to follow the driving large-scale conditions. This is implemented by additional terms in the dynamic equations that re-strict the degrees of freedom of the simulation. This is the so-called nudging nesting, of which two versions are available. The 3-D analysis nudging introduces a Newtonian
20
relaxation term in the prognostic equations of the model, and was first introduced by Charney et al. (1969). This addition corrects some variables by an artificial tendency term based on the difference between the original state produced by the model and the
driving dataset (Lo et al., 2008). WRF provides a number of options that allow selecting which variables and vertical levels should be affected by the correction term. In the
cur-25
GMDD
8, 5437–5479, 2015Sensitivity of WRF to reproduce surface wind over complex
terrain
J. J. Gómez-Navarro et al.
Title Page
Abstract Introduction
Conclusions References
Tables Figures
◭ ◮
◭ ◮
Back Close
Full Screen / Esc
Printer-friendly Version Interactive Discussion
Discussion
P
a
per
|
Discussion
P
a
per
|
Discussion
P
a
per
|
Discussion
P
a
per
|
A variation of this method is spectral nudging, introduced by von Storch et al. (2000). In this approach the variables are Fourier-transformed prior to the nudging. Then, only selected parts of the spectrum are nudged in a similar fashion as the 3-D analysis nudging approach, i.e., by introducing a Newtonian relaxation term in the equations. In doing so, the model is forced to mimic the long waves of the driving input data,
5
which contain the large-scale pattern of the atmospheric circulation, whereas it is free to add value in the smaller scales (Miguez-Macho et al., 2005). As in the sensitivity ex-periments using 3-D analysis nudging, the simulations carried out in this study nudge horizontal wind, temperature and humidity only in the levels above the PBL, and with the same nudging factors, 3×10⁻⁴s−1. Unlike 3-D analysis nudging, this configuration
10
requires setting the number of waves to be considered in the Fourier analysis, which controls the spatial variability from the input dataset that is being preserved. This num-ber is set to 4 and 2 for the domains D1 and D2, respectively, which correspond to a wave length of about 1000 km. Due to their small size, no nudging is applied in the two innermosts domains.
15
3.4 Overview of the experiments
This section summarises the set of simulations carried out to investigate the sensitivi-ties of the different settings. Following the approach by Etienne et al. (2013), a total of
24 historical wind storms is considered (Table 1). The selected storms appear between November and February and are embedded in different synoptic scale flow conditions.
20
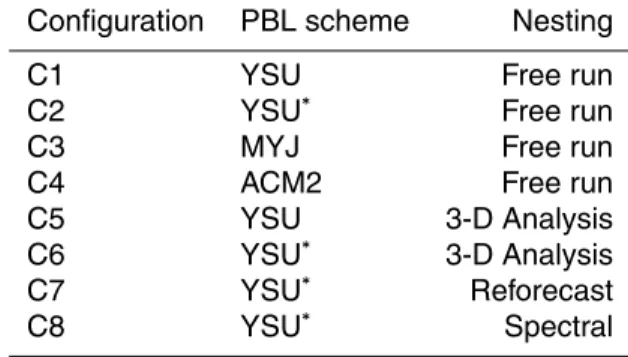
Each storm is simulated using eight different model configurations encompassing the
sensitivity due to PBL parameterization, nesting method and horizontal resolution (Ta-ble 2). Thus, a total of 192 simulations are performed. Each simulation spans 6 days with the corresponding storm in the middle of the simulation, and discarding a spin-up period of 12 h.
25
GMDD
8, 5437–5479, 2015Sensitivity of WRF to reproduce surface wind over complex
terrain
J. J. Gómez-Navarro et al.
Title Page
Abstract Introduction
Conclusions References
Tables Figures
◭ ◮
◭ ◮
Back Close
Full Screen / Esc
Printer-friendly Version Interactive Discussion
Discussion
P
a
per
|
Discussion
P
a
per
|
Discussion
P
a
per
|
Discussion
P
a
per
|
(Jiménez et al., 2010), such errors are systematic in all simulations, and do not play a significant role in the assessment of the relative model performance across model configurations.
4 Results
4.1 The role of the PBL scheme
5
To evaluate the sensitivity of the model result due to different PBL schemes, the setups
C1 to C4 are compared with each other (Table 2). The analysis concentrates on results of the innermost domain. All storms are analysed in an identical way, but for the sake of brevity most of the discussion is based on the results for storm Lothar (storm number 13 in Table 1). Still, similarities and deviating characteristics found in other storms are
10
discussed subsequent to the analysis of Lothar storm.
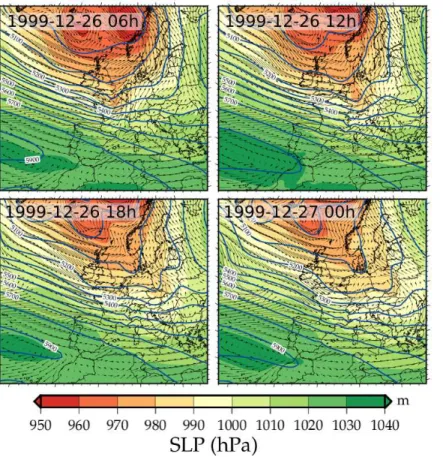
Figure 3 shows the situation during the 24 h around the most mature phase of storm Lothar. This situation was characterized by a intense upper-level zonal jet and strong baroclinicity. The storm formed over the western Atlantic and moved through the At-lantic with moderate amplitude until it reached the French AtAt-lantic coast. There, it
15
experienced an explosive growth as it travelled poleward across the upper-level jet axis (Rivière et al., 2010). The synoptic scale was dominated by a strong north–south gradient in geopotential height that produced strong large-scale winds with a western component.
The surface winds over Switzerland during storm Lothar are presented in Fig. 4
20
showing the wind speed averaged over 109 weather stations during a 6-day period. The temporal agreement of the sensitivity simulations with the observations is remark-able. The most severe winds peaked on the 26 December 12:00 UTC, but also the secondary peaks in the time series are generally well captured by all sensitivity simu-lations. Despite the good timing, an overestimation of wind speed becomes apparent.
25
GMDD
8, 5437–5479, 2015Sensitivity of WRF to reproduce surface wind over complex
terrain
J. J. Gómez-Navarro et al.
Title Page
Abstract Introduction
Conclusions References
Tables Figures
◭ ◮
◭ ◮
Back Close
Full Screen / Esc
Printer-friendly Version Interactive Discussion
Discussion
P
a
per
|
Discussion
P
a
per
|
Discussion
P
a
per
|
Discussion
P
a
per
|
studies in different locations and synoptic circulations (Cheng and Steenburgh, 2005;
Mass and Ovens, 2011; Jiménez and Dudhia, 2012). The comparison of the sensitivity simulations with different PBL schemes (configurations C1 to C4 in Fig. 4) shows that
the YSU∗ scheme (C2) substantially reduces such overestimation of wind speed. The setup showing the strongest overestimation of surface winds is the fully local scheme,
5
MYJ (C3), followed by the hybrid approach, ACM2 (C4). This suggests that the non-local approach used in both the YSU and YSU∗ schemes is more suited to reproduce wind speed over complex terrain confirming findings of Jiménez and Dudhia (2012).
Figure 4 provides a first glance of the model-observation comparison. Still, many details are lost by averaging over all stations, in particular the evaluation of the model
10
performance to reproduce the spatial distribution of the most severe winds. Therefore, additional statistics are performed which are presented for storm Lothar in Fig. 5. The boxplots and diamonds show the temporal and the spatial performance, respectively (Fig. 5). Thereby, the boxplots represent the distribution of 109 stations for four statisti-cal metrics that evaluate the temporal performance of the simulation: correlation, Root
15
Mean Square Error (RMSE), bias of the mean wind speed and bias of the maximum wind speed. These four metrics are included since they allow evaluating if the model generally tends to over- or under-estimate wind speed, but also if the simulation is able to mimic the temporal evolution. Note that considering the maximum wind speed is im-portant for scientific questions on extremes on wind speed. To assess the spatial skill of
20
the sensitivity simulations (illustrated by diamonds in Fig. 5) the wind speed is averaged over the 6 days of each storm simulation at each location. This is done separately for the model and the observations resulting in two spatial patterns of mean wind. Finally, the spatial correlation, spatial RMSE, and spatial biases are calculated. Note that this calculation is not meaningful for maximum wind speed (therefore omitted).
25
sta-GMDD
8, 5437–5479, 2015Sensitivity of WRF to reproduce surface wind over complex
terrain
J. J. Gómez-Navarro et al.
Title Page
Abstract Introduction
Conclusions References
Tables Figures
◭ ◮
◭ ◮
Back Close
Full Screen / Esc
Printer-friendly Version Interactive Discussion
Discussion
P
a
per
|
Discussion
P
a
per
|
Discussion
P
a
per
|
Discussion
P
a
per
|
tions. Additionally, the RMSE is lower in the sensitivity simulation with the YSU∗ (C2). The temporal correlation ranges between 0.8 and 0.2, depending on the weather sta-tion. The median value is about 0.6 in all configurations. There is a rather low variation between the sensitivity simulations in the temporal correlation, since this metric is dom-inated by the accuracy of the driving dataset, which is common to all simulations. There
5
is however a lower correlation in the C2 configuration compared to the other configura-tions. This is a consistent feature across different storms (see discussion below). The
skill of the maximum wind speed behaves very similar to the mean bias for all sensi-tivity simulations, although errors become more pronounced: the MYJ scheme exhibits a strong overestimation of the maximum wind speed that is above 10 m s−1for 50 % of
10
the locations, whereas the YSU∗ scheme simulates values closer to the observations, although with deviations above 3 m s−1in 50 % of the locations.
The spatial metrics show that the biases behave similar to the ones of the tempo-ral scale (Fig. 5). This is expected as the spatial bias is identical to the median of the temporal bias if the wind distribution is symmetric. The spatial bias again
domi-15
nates the spatial RMSE, although in this case the RMSE is significantly lower across all simulations. The sensitivity simulation with the YSU∗ scheme (C2) shows the low-est spatial RMSE, highlighting the scheme’s ability in reducing the overlow-estimation of wind speed. The overall higher spatial correlations than temporal correlations indicate that the model generally is able to simulate the spatial structure of wind independent
20
from the scheme applied. Again, the sensitivity simulation using the YSU∗ scheme is superior in this metric. Interestingly, the spatial correlation when using this scheme con-trasts with the sensitivity simulation with original YSU scheme (C1), as the latter ranks worst among all sensitivity simulations with respect to the PBL scheme. Thus, the spa-tial metrics show that the YSU∗ scheme of Jiménez and Dudhia (2012) improves the
25
surface wind simulation by taking into account unresolved orography.
GMDD
8, 5437–5479, 2015Sensitivity of WRF to reproduce surface wind over complex
terrain
J. J. Gómez-Navarro et al.
Title Page
Abstract Introduction
Conclusions References
Tables Figures
◭ ◮
◭ ◮
Back Close
Full Screen / Esc
Printer-friendly Version Interactive Discussion
Discussion
P
a
per
|
Discussion
P
a
per
|
Discussion
P
a
per
|
Discussion
P
a
per
|
situation dominates the wind rose showing primarily south-western directions at the surface. There are additional peaks in the observations in other directions, although due to the pooling process, it could be due to a systematic biases in certain stations (typically valleys, where the 2 km resolution could not be sufficient and lead to
represen-tativity errors), rather than a general change in wind direction during the life-time of the
5
storm. Regardless of the PBL scheme, the simulations of storm Lothar are able to cap-ture the main wind direction with a slight systematic bias towards southern directions. The major difference among configurations is a slightly less pronounced preferred
di-rection in the YSU∗ scheme, although it does not contribute to reduce the southern bias. Thus, the simulation of wind direction seems to be mostly insensitive to the PBL
10
scheme selected.
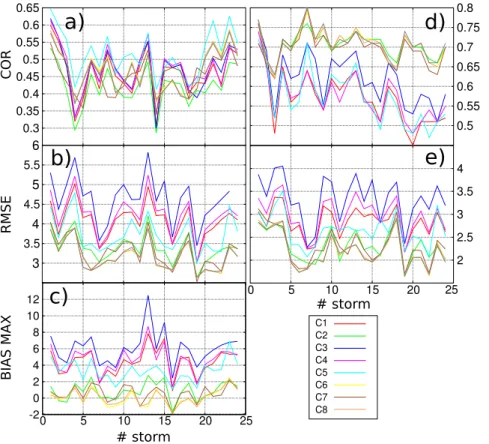
Most of the conclusions drawn from the analysis of the storm Lothar about the PBL schemes are consistent through the various storms simulated. This is illustrated in a comprehensive although summarised way in Fig. 7. Hereby, the “temporal” series show the median temporal correlation (i.e., the centre of the boxplots in Fig. 5) whereas
15
“spatial” series indicate the mean spatial correlation (i.e., the diamonds in Fig. 5). The temporal correlation seems to be mostly insensitive to the choice of PBL scheme (C1 to C4 in Fig. 7a) with the exception of the YSU∗scheme (configuration C2), which shows a slightly lower temporal correlation for almost all storms. Although the authors could not find reasons for the reduced temporal correlation, this phenomenon becomes
ame-20
liorated when nudging is used (see next section), rendering this caveat less relevant for the sake of the identification a suitable model setup. Still, the reduction of the over-estimation of wind speed by this configuration leads to lower temporal RMSE across the storms (Fig. 7b). This improvement becomes especially noticeable in the maximum wind speed bias (Fig. 7c) where the sensitivity simulations with the YSU∗scheme show
25
GMDD
8, 5437–5479, 2015Sensitivity of WRF to reproduce surface wind over complex
terrain
J. J. Gómez-Navarro et al.
Title Page
Abstract Introduction
Conclusions References
Tables Figures
◭ ◮
◭ ◮
Back Close
Full Screen / Esc
Printer-friendly Version Interactive Discussion
Discussion
P
a
per
|
Discussion
P
a
per
|
Discussion
P
a
per
|
Discussion
P
a
per
|
wind speeds at the right locations than the simulations using other PBL schemes. The simulations using the YSU∗scheme further exhibit lower spatial RMSEs, due to higher correlations and a reduction of the overestimation of wind speed (Fig. 7e).
Wind direction performance across all storms is analysed in a similar fashion. How-ever, this variable has to be treated differently, taking into account the problems
asso-5
ciated to its circularity. Thus, similarly to Jiménez and Dudhia (2013) the∆d parameter
is calculated:
∆d=
dWRF−dobs if|dWRF−dobs| ≤180
dWRF−dobs−360 ifdWRF−dobs>180
dWRF−dobs+360 ifd
WRF−dobs<−180.
This definition produces positive (negative) biases when simulated wind direction is orientated clockwise (counter-clockwise) with respect to observations. Once this
pa-10
rameter is calculated for each site in each time step, its distribution is obtained. For this, all values are pooled, so the temporal and spatial details are lost in the discussion hereafter. A RMSE that accounts for the deviations between the simulation and the ob-servations in every location and time step for each storm is derived from the distribution of this bias using
15
RMSE= "
1
n
n
X
i=1
(∆d
i)2
#1/2
.
The sensitivity simulations show a RMSE of about 70◦ regardless of the PBL scheme (Fig. 8). Similarly, the median of∆d exhibits a negative bias, again independent from
the PBL scheme. For both metrics, the inter-case variation is larger than the variation between the different sensitivity simulations. Thus, this confirms the finding of the storm
20
GMDD
8, 5437–5479, 2015Sensitivity of WRF to reproduce surface wind over complex
terrain
J. J. Gómez-Navarro et al.
Title Page
Abstract Introduction
Conclusions References
Tables Figures
◭ ◮
◭ ◮
Back Close
Full Screen / Esc
Printer-friendly Version Interactive Discussion
Discussion
P
a
per
|
Discussion
P
a
per
|
Discussion
P
a
per
|
Discussion
P
a
per
|
exhibit lower∆d and lower RMSE. This result is expected, and in good agreement with
the findings by Jiménez and Dudhia (2013), who pointed out that the model’s ability to reproduce wind directions is inversely related to wind speed.
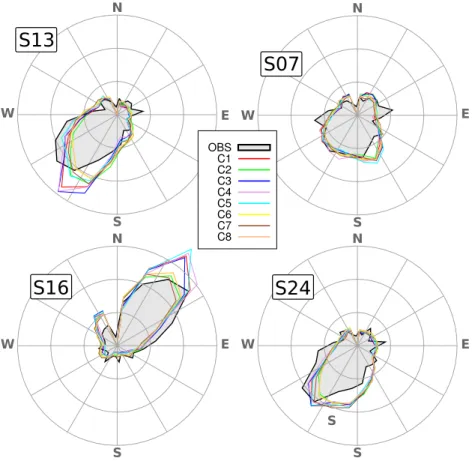
To assess whether the results of wind direction and the minor role of the PBL scheme may depend on the storm selected, wind roses of three additional storms are shown
5
in Fig. 6. The storm S07 corresponds to a typical Foehn storm. Unlike for the Lothar storm, the wind rose does not show preferred directions, as expected since Foehn storms affect only part of Switzerland. S16 corresponds to a bise storm. In this
config-uration there is again a clear preferred direction, but is exactly opposite to Lothar. In this storm there is a clear second maximum towards−30◦. Finally, S24 corresponds to
10
the Xynthia storm in February 2010. This is a west-wind storm, although its particular trajectory when traveling towards Switzerland induces a Foehn-like situation, and thus has been catalogued as such by Etienne et al. (2013). In these examples, all sensitiv-ity simulations show remarkable skill in identifying the most dominant wind directions. WRF is clearly able to capture the different nature of these storms, and simulate the
15
surfaces wind regime accordingly. However, none of the four PBL schemes stands out in reproducing the wind direction, resembling the minor role of the PBL scheme and showing that this result is independent from the specific type of the storm.
4.2 The role of the nesting technique
The analysis carried out in the former section indicates that the YSU∗ scheme is
su-20
perior compared to the other PBL parameterizations, so this scheme is used in the sensitivity experiments hereafter (see Table 2). The next choice pertains how the RCM is nested to the driving dataset. To assess the sensitivity of nesting approach, the fo-cus is set on the sensitivity simulations C2, C6, C7 and C8, where the free simulations (C2) are compared with analysis nudging (C6), reforecast (C7) and spectral nudging
25
GMDD
8, 5437–5479, 2015Sensitivity of WRF to reproduce surface wind over complex
terrain
J. J. Gómez-Navarro et al.
Title Page
Abstract Introduction
Conclusions References
Tables Figures
◭ ◮
◭ ◮
Back Close
Full Screen / Esc
Printer-friendly Version Interactive Discussion
Discussion
P
a
per
|
Discussion
P
a
per
|
Discussion
P
a
per
|
Discussion
P
a
per
|
configurations C6 and C7 better reproduce the intensity and precise timing compared to the C2 configuration.
Figure 5 presents spatial and temporal performance metrics for the storm Lothar. Spatially, the sensitivity simulations, which include nudging techniques, exhibit slightly higher correlations than the free simulation (C2). In contrast, the spatial bias show that
5
the analysis nudging reduces bias compared to C2, whereas the reforecast method increases the bias. The latter is due to the last day of the simulation, where this sensi-tivity simulation exhibits a strong bias (Fig. 4). For the temporal performance metrics, all nudged simulations (C6–C8) tend to increase the correlation compared to C2, although the improvements are small and rise concerns regarding the robustness of this finding.
10
A more clear improvement introduced by nudging is however found for the maximum wind. The original YSU∗ scheme without nudging shows systematic positive biases in this variable, which are reduced when reforecast, but especially analysis or spectral nudging, are used (Fig. 5).
The analysis of wind direction delivers similar results as in the sensitivity to different
15
PBL schemes (Fig. 6). The role of the nudging approach in correctly simulating the wind direction is minor regarding the storm Lothar. So, it is not possible to identify any nesting configuration that outperforms the others. Instead, all simulations behave similarly, and the main wind direction seems to be equally reproduced across sensitivity simulations according to the synoptic characteristic of the storm.
20
As before the analysis is extended to all 24 storms. The mean temporal correlation obtained for different storms is shown in Fig. 7a. This figure illustrates that the temporal
agreement is slightly but consistently improved when some nudging is applied, render-ing the temporal agreement with the observations comparable to the other schemes, as argued for the storm Lothar. The analysis and spectral nudging (C6 and C8)
sys-25
GMDD
8, 5437–5479, 2015Sensitivity of WRF to reproduce surface wind over complex
terrain
J. J. Gómez-Navarro et al.
Title Page
Abstract Introduction
Conclusions References
Tables Figures
◭ ◮
◭ ◮
Back Close
Full Screen / Esc
Printer-friendly Version Interactive Discussion
Discussion
P
a
per
|
Discussion
P
a
per
|
Discussion
P
a
per
|
Discussion
P
a
per
|
Moreover, nudging reduces the bias in maximum wind speed consistently, and makes analysis and spectral nudging equally suitable to improve the maximum wind speed compared to free simulations (C2). Regarding the improvement in wind direction the model performance varies erratically depending on the storm (Fig. 8). The role of the nesting scheme with respect to the median error∆d is even smaller than of the PBL
5
schemes. A very similar result can be drawn from the analysis of the RMSE, although in this case the nesting setups generally exhibit lower RMSE than the free simulation. However, these differences between the schemes are small, so that an identification of
a nesting setup that significantly outperforms the others is not possible when consider-ing wind direction.
10
4.3 The role of horizontal resolution
As argued above, the horizontal resolution has a profound impact on the ability of the model to simulate wind speed. In particular this is the case if the closest grid point of the model to the weather station is used in the analysis. We note that this simple ap-proach neglects the fact that the model averages subgrid terrain properties, and leads
15
to so-called representativity errors. It is beyond the scope of this study to assess these errors and to address a method to minimise them, since they introduce systematic bi-ases that only depend on the domain configuration, which is fixed across simulations, and thus play a secondary role in the evaluation of the relative skill of different model
configurations. Still, such errors, and the model performance in general, depend on
20
the model resolution, so the importance of model resolution and the type of station is discussed in more detail.
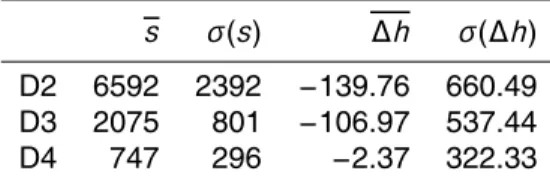
The representativity error is quantified by calculating the horizontal distance s and difference of height ∆h between the stations and the closest grid point (identical to
the model skill assessment above). The mean representativity error over all weather
25
GMDD
8, 5437–5479, 2015Sensitivity of WRF to reproduce surface wind over complex
terrain
J. J. Gómez-Navarro et al.
Title Page
Abstract Introduction
Conclusions References
Tables Figures
◭ ◮
◭ ◮
Back Close
Full Screen / Esc
Printer-friendly Version Interactive Discussion
Discussion
P
a
per
|
Discussion
P
a
per
|
Discussion
P
a
per
|
Discussion
P
a
per
|
The horizontal errors become more severe when a coarser resolution is implemented, and reach a mean of about 6.6 km in the 18 km resolution setup. As expected, the height bias is close to zero, but there is a large standard deviation from station to station, indicating that the error is pronounced in areas of complex topography. The model topography is too smooth even at 2 km grid size and lacks to reproduce the real
5
topography, which explains the high standard deviations.
The influence of the horizontal resolution on the model performance is investigated using the C6 configuration as an example (Fig. 9). Considering all stations, spatial correlations are 0.74, 0.39 and 0.22 for the resolutions from 2, 6 to 18 km, respectively. Similarly, the bias increases from 0.46, 2.19 and 3.24, respectively. This increase in
10
bias is explained by the fact that a coarser resolution implies smoother orography, which eventually leads to an excess of wind speed due to the underestimated terrain roughness. The smoothness is also a reason why the RMSE monotonously increases. For temporal metrics, a somewhat unexpected behaviour is found. Although the tem-poral correlation drops to a median value of zero in the coarsest domain analysed, the
15
model exhibits a remarkable high correlation in the 6 km resolution domain. To better understand this high correlation the site-averaged wind speed in different domains for
the case Lothar is compared to observations (Fig. 10). Although the series correspond-ing to D4 is more realistic and reproduces the timcorrespond-ing and intensity of the most severe wind speed, the simulation in 6 km (D3) captures the phasing of secondary peaks in
20
the time series better than in the 2 km resolution. Indeed, the RMSE reproduces the expected result of a reduction in performance when successive coarser domains are used, and demonstrates that the use of several statistics allows more robust assess-ments of the model performance.
The role of the representativity error is explored through the separation of the
obser-25
GMDD
8, 5437–5479, 2015Sensitivity of WRF to reproduce surface wind over complex
terrain
J. J. Gómez-Navarro et al.
Title Page
Abstract Introduction
Conclusions References
Tables Figures
◭ ◮
◭ ◮
Back Close
Full Screen / Esc
Printer-friendly Version Interactive Discussion
Discussion
P
a
per
|
Discussion
P
a
per
|
Discussion
P
a
per
|
Discussion
P
a
per
|
and it is worse over valleys, where important terrain features remain unresolved. The performance measurements behave similar in D3, when separating in PL, MO and VA. In D2 the correlation is too low that it precludes drawing any conclusion. Although bi-ases are generally close to zero in the innermost domain, there is a larger variation between the stations in the mountains, because the differences between the station
5
height and model topography can be large and indeed the RMSE is significantly larger in this locations.
The spatial correlation in the innermost domain shows a low value of 0.31 over the plains, which contrasts with the value of 0.78 obtained for mountains. This can be explained as a signal-to-noise artefact. The problem is that in the plains the mean wind
10
is not as strongly modulated by height as it is in mountains, where there is a larger difference among stations. Thus, small variations in mean wind lead to large variations
in the spatial correlation, since the mean wind speed is not a good predictor of the location of a station within plains. Additionally, the correlation is calculated according to only the 46 stations that corresponds to the plains in the Lothar storm. Such low number
15
leads to a large variance of the estimator of correlation, which further contributes to the signal-to-noise problem. Thus, the spatial correlation of mean wind patterns over homogeneous terrain is not a meaningful measure of model skill and should be treated with care.
5 Summary and conclusions
20
This paper analyses a number of sensitivity experiments aimed at identifying a model setup for WRF that minimises systematic errors in hindcast simulations of wind over areas of complex topography. The simulations use the Era-Interim reanalysis for initial and boundary conditions. These data are downscaled to a resolution of 2 km over the Alps in a series of consecutive nested domains. Due to the high demand of
computa-25
con-GMDD
8, 5437–5479, 2015Sensitivity of WRF to reproduce surface wind over complex
terrain
J. J. Gómez-Navarro et al.
Title Page
Abstract Introduction
Conclusions References
Tables Figures
◭ ◮
◭ ◮
Back Close
Full Screen / Esc
Printer-friendly Version Interactive Discussion
Discussion
P
a
per
|
Discussion
P
a
per
|
Discussion
P
a
per
|
Discussion
P
a
per
|
taining prominent historical storms in Switzerland (Etienne et al., 2013) are simulated and analysed. This selection is motivated by their relevance in risk assessments and impact studies, which are two typical applications of dynamically downscaled datasets. To identify a suitable setup to realistically simulate wind over complex terrain, 8 different
sensitivity experiments are performed for each case study taking into account different
5
PBL parameterizations, nudging techniques and horizontal resolutions.
The sensitivity tests designed to evaluate the role of the PBL parameterization show that WRF systematically overestimates wind speed compared to observations. The overestimation occurs in all types of location (plains, valleys or mountains), and is ex-acerbated in coarser domains. This result confirms previous studies pointing out the
10
overestimation of wind speed in simulations with WRF and its relation with unresolved topograhy (e.g Cheng and Steenburgh, 2005; Mass and Ovens, 2011; Jiménez and Dudhia, 2012). For the MYJ scheme wind speeds that are up to 100 % larger than in the observations are found. The overestimation becomes even stronger when focusing on maximum wind speed, a variable especially relevant in impacts studies. However,
15
this drawback can be significantly reduced by choosing the YSU∗ scheme which, be-ing based on the non-local YSU scheme, explicitly accounts for unresolved orography. These results resemble findings by Jiménez and Dudhia (2012) and Gonçalves-Ageitos et al. (2015), who tested this PBL parameterization in a small area of relatively complex topography in the North of the Iberian Peninsula and in the Pyrenees, respectively. It is
20
noteworthy that this improvement is not produced by a trivial reduction of wind speed in every location, but this reduction is applied where complexity of topography is more severely underestimated, yielding a remarkable increase in the model’s ability to repro-duce the spatial structure of wind speed.
The model is qualitatively able to reproduce the leading wind directions generated by
25
very different synoptic conditions. However, the simulations still exhibit systematic
GMDD
8, 5437–5479, 2015Sensitivity of WRF to reproduce surface wind over complex
terrain
J. J. Gómez-Navarro et al.
Title Page
Abstract Introduction
Conclusions References
Tables Figures
◭ ◮
◭ ◮
Back Close
Full Screen / Esc
Printer-friendly Version Interactive Discussion
Discussion
P
a
per
|
Discussion
P
a
per
|
Discussion
P
a
per
|
Discussion
P
a
per
|
by other factors such as the driving conditions, insufficient resolution, or representativity
errors.
Additionally, the sensitivity with respect to the nesting technique is explored by com-paring free simulations to analysis and spectral nudging, as well as the so-called re-forecast approach. The use of nudging techniques slightly improves several aspects of
5
the simulation, like reducing the mean wind overestimation discussed above and im-proving the spatial pattern of mean wind (in particular 3-D analysis nudging). Further, the free simulations generally show a lower temporal agreement with observations than nudged simulations, a feature that is consistent across storms. Analysis nudging yields a significant improvement for maximum wind speed, for which the overestimation is
re-10
duced and leads to values closer to zero on average than when no nudging is applied. These results indicate that preserving the large-scale circulation via nudging slightly improves the simulation of wind at regional scales, at least for hindcast simulations where the driving dataset is generally reliable, and whose aim is to be as close to the observations as possible. We note however that for other scientific questions a free
15
simulation setup could be more appropriate, as atmospheric processes and their inter-actions with regional scale features are able to develop desirable disturbances that add value to RCM simulations. Typical examples are climate change projections (van der Linden and Mitchell, 2009; Gómez-Navarro et al., 2010; Jacob et al., 2013), paleosim-ulations (Gómez-Navarro et al., 2013) but also classical sensitivity and process studies
20
(Kilic and Raible, 2013; Cipagauta et al., 2014).
Using the setup with analysis nudging and the YSU∗ scheme the role of the spatial resolution and the representativity error is assessed. As expected horizontal resolution is critical for a realistic wind simulation in very complex terrain. A reduction from 6 to 2 km shows a clear improvement in simulating the mean wind pattern as well as
maxi-25
GMDD
8, 5437–5479, 2015Sensitivity of WRF to reproduce surface wind over complex
terrain
J. J. Gómez-Navarro et al.
Title Page
Abstract Introduction
Conclusions References
Tables Figures
◭ ◮
◭ ◮
Back Close
Full Screen / Esc
Printer-friendly Version Interactive Discussion
Discussion
P
a
per
|
Discussion
P
a
per
|
Discussion
P
a
per
|
Discussion
P
a
per
|
valley areas the temporal agreement is slightly higher over flat terrain, and reduced in valleys. The mean biases are similar, although showing more spatial variability in the mountains, driven by the larger variability of height biases. More remarkable diff
er-ences are seen in the RMSE values which show relatively high values of about 6 m s−1 in the mountains compared to 3 m s−1in the flat regions and valleys.
5
In summary, this study suggests two setups depending on the scientific question: (i) the configuration C6 with the YSU∗ scheme that reduces wind overestimation and increases spatial correlations. It further uses 3-D analysis nudging, that improves the temporal agreement with respect to observations, and at the same time further reduces the overestimation of maximum wind speed and improves the spatial distribution of
10
wind speed. Thus, this combination is the most suitable for running hindcast simulations aimed at achieving a reliable surface wind simulation over areas of complex orography. (ii) When the timing is not so relevant but an undisturbed development of regional processes is needed, the configuration using the YSU∗ scheme and free simulations delivers a realistic simulation of surface winds over complex terrain.
15
Acknowledgements. The authors are grateful for the support provided by the Oeschger Centre for Climate Change Research and the Mobiliar lab for climate risk and natural hazards (Mobi-lab). Thanks are due to the Swiss National Supercomputing Centre (CSCS) for providing the supercomputing facilities and technical support required to perform the RCM simulations. The ERA-interim reanalysis was kindly provided by the ECMWF. Finally, we would like to thank
20
Martina Messmer for sharing her great knowledge of the Swiss geography and the stimulating discussions.
References
Awan, N. K., Truhetz, H., and Gobiet, A.: Parameterization-induced error characteristics of MM5 and WRF operated in climate mode over the Alpine region: an ensemble-based analysis, J.
25
Climate, 24, 3107–3123, doi:10.1175/2011JCLI3674.1, 2011. 5443
GMDD
8, 5437–5479, 2015Sensitivity of WRF to reproduce surface wind over complex
terrain
J. J. Gómez-Navarro et al.
Title Page
Abstract Introduction
Conclusions References
Tables Figures
◭ ◮
◭ ◮
Back Close
Full Screen / Esc
Printer-friendly Version Interactive Discussion
Discussion
P
a
per
|
Discussion
P
a
per
|
Discussion
P
a
per
|
Discussion
P
a
per
|
Future extreme events in European climate: an exploration of regional climate model projec-tions, Climatic Change, 81, 71–95, doi:10.1007/s10584-006-9226-z, 2007. 5439
Charney, J., Halem, M., and Jastrow, R.: Use of incomplete historical data to infer the present state of the atmosphere, J. Atmos. Sci., 26, 1160–1163, doi:10.1175/1520-0469(1969)026<1160:UOIHDT>2.0.CO;2, 1969. 5446
5
Chen, F. and Dudhia, J.: Coupling an advanced land surface–hydrology model with the Penn State–NCAR MM5 modeling system. Part I: Model implementation and sensitivity, Mon. Weather Rev., 129, 569–585, doi:10.1175/1520-0493(2001)129<0569:CAALSH>2.0.CO;2, 2001. 5444
Cheng, W. Y. Y. and Steenburgh, W. J.: Evaluation of surface sensible weather forecasts by the
10
WRF and the Eta models over the Western United States, Weather Forecast., 20, 812–821, doi:10.1175/WAF885.1, 2005. 5445, 5449, 5458
Cipagauta, C., Mendoza, B., and Zavala-Hidalgo, J.: Sensitivity of the surface temperature to changes in total solar irradiance calculated with the WRF model, Geofis. Int., 53, 153–162, doi:10.1016/S0016-7169(14)71497-7, 2014. 5459
15
Davies, H. C.: A laterul boundary formulation for multi-level prediction models, Q. J. Roy. Meteor. Soc., 102, 405–418, doi:10.1002/qj.49710243210, 1976. 5445
Dee, D. P., Uppala, S. M., Simmons, A. J., Berrisford, P., Poli, P., Kobayashi, S., Andrae, U., Balmaseda, M. A., Balsamo, G., Bauer, P., Bechtold, P., Beljaars, A. C. M., van de Berg, L., Bidlot, J., Bormann, N., Delsol, C., Dragani, R., Fuentes, M., Geer, A. J., Haimberger, L.,
20
Healy, S. B., Hersbach, H., Hólm, E. V., Isaksen, L., Kållberg, P., Köhler, M., Matricardi, M., McNally, A. P., Monge-Sanz, B. M., Morcrette, J.-J., Park, B.-K., Peubey, C., de Rosnay, P., Tavolato, C., Thépaut, J.-N., and Vitart, F.: The ERA-Interim reanalysis: configuration and performance of the data assimilation system, Q. J. Roy. Meteor. Soc., 137, 553–597, doi:10.1002/qj.828, 2011. 5441
25
Dierer, S., de Paus, T., Durante, F., Gregow, E., Lange, B., Lavagnini, A., Strack, M., and Tam-melin, B.: Predicting wind speed for wind energy; progress of the WINDENG project, Wind Eng., 29, 393–408, doi:10.1260/030952405775992616, 2005. 5440
Draxl, C., Hahmann, A. N., Peña, A., and Giebel, G.: Evaluating winds and vertical wind shear from Weather Research and Forecasting model forecasts using seven planetary boundary
30
GMDD
8, 5437–5479, 2015Sensitivity of WRF to reproduce surface wind over complex
terrain
J. J. Gómez-Navarro et al.
Title Page
Abstract Introduction
Conclusions References
Tables Figures
◭ ◮
◭ ◮
Back Close
Full Screen / Esc
Printer-friendly Version Interactive Discussion
Discussion
P
a
per
|
Discussion
P
a
per
|
Discussion
P
a
per
|
Discussion
P
a
per
|
Dudhia, J.: Numerical study of convection observed during the Winter Monsoon Experiment us-ing a mesoscale two-dimensional model, J. Atmos. Sci., 46, 3077–3107, doi:10.1175/1520-0469(1989)046<3077:NSOCOD>2.0.CO;2, 1989. 5444
Etienne, C., Goyette, S., and Kuszli, C.-A.: Numerical investigations of extreme winds over Switzerland during 1990–2010 winter storms with the Canadian Regional Climate Model,
5
Theor. Appl. Climatol., 113, 529–547, doi:10.1007/s00704-012-0800-1, 2013. 5439, 5440, 5444, 5447, 5453, 5458, 5467
García-Díez, M., Fernández, J., Fita, L., and Yagüe, C.: Seasonal dependence of WRF model biases and sensitivity to PBL schemes over Europe, Q. J. Roy. Meteor. Soc., 139, 501–514, doi:10.1002/qj.1976, 2013. 5440, 5443, 5444, 5445, 5446
10
Gómez-Navarro, J. J., Montávez, J. P., Jimenez-Guerrero, P., Jerez, S., García-Valero, J. A., and González-Rouco, J. F.: Warming patterns in regional climate change projections over the Iberian Peninsula, Meteorol. Z., 19, 275–285, doi:10.1127/0941-2948/2010/0351, 2010. 5440, 5459
Gómez-Navarro, J. J., Montávez, J. P., Jerez, S., Jiménez-Guerrero, P., and Zorita, E.: What
15
is the role of the observational dataset in the evaluation and scoring of climate models?, Geophys. Res. Lett., 39, L24701–L24701, doi:10.1029/2012GL054206, 2012. 5443
Gómez-Navarro, J. J., Montávez, J. P., Wagner, S., and Zorita, E.: A regional climate palaeosim-ulation for Europe in the period 1500–1990 – Part 1: Model validation, Clim. Past, 9, 1667– 1682, doi:10.5194/cp-9-1667-2013, 2013. 5440, 5459
20
Gonçalves-Ageitos, M., Barrera-Escoda, A., Baldasano, J. M., and Cunillera, J.: Modelling wind resources in climate change scenarios in complex terrains, Renew. Energ., 76, 670–678, doi:10.1016/j.renene.2014.11.066, 2015. 5458
Goyette, S.: Development of a model-based high-resolution extreme surface wind climatology for Switzerland, Nat. Hazards, 44, 329–339, doi:10.1007/s11069-007-9130-5, 2008. 5439
25
Goyette, S.: Synoptic conditions of extreme windstorms over Switzerland in a changing climate, Clim. Dynam., 36, 845–866, doi:10.1007/s00382-010-0820-4, 2010. 5439
Hong, S. and Lim, J.: The WRF single-moment 6-class microphysics scheme (WSM6), J. Ko-rean Meteorol. Soc., 42, 129–151, 2006. 5444
Jacob, D., Petersen, J., Eggert, B., Alias, A., Christensen, O. B., Bouwer, L. M., Braun, A.,
Co-30