Information Extraction of High Resolution
Remote Sensing Images Based on the
Calculation of Optimal Segmentation
Parameters
Hongchun Zhu1,2*, Lijie Cai1, Haiying Liu3, Wei Huang1
1Shandong University of Science and Technology, Geomatics College, Qianwan port road 579, Qingdao, Shandong 266590, China,2Shandong University of Science and Technology, The Key Laboratory of Geomatics and Digital Technology, Qianwan port road 579, Qingdao, Shandong 266590, China, 3Shandong University of Science and Technology, College of Information Science and engineering, Qianwan port road 579, Qingdao, Shandong 266590, China
Abstract
Multi-scale image segmentation and the selection of optimal segmentation parameters are the key processes in the object-oriented information extraction of high-resolution remote sensing images. The accuracy of remote sensing special subject information depends on this extraction. On the basis of WorldView-2 high-resolution data, the optimal segmentation parameters methodof object-oriented image segmentation and high-resolution image infor-mation extraction, the following processes were conducted in this study. Firstly, the best combination of the bands and weights was determined for the information extraction of high-resolution remote sensing image. An improved weighted mean-variance method was proposed andused to calculatethe optimal segmentation scale. Thereafter, the best shape factor parameter and compact factor parameters were computed with the use of the control variables and the combination of the heterogeneity and homogeneity indexes. Different types of image segmentation parameters were obtained according to the surface features. The high-resolution remote sensing images were multi-scale segmented with the optimal segmentation parameters. Ahierarchical network structure was established by setting the information extraction rules to achieve object-oriented information extraction. This study presents an effective and practical method that can explain expert input judgment by repro-ducible quantitative measurements. Furthermore the results of this procedure may be incor-porated into a classification scheme.
Introduction
Modern remote sensing technology is developing rapidly. It presents characteristics that involve multiple platforms, multi-angles, and multi-type sensors, as well as high geometric, a11111
OPEN ACCESS
Citation:Zhu H, Cai L, Liu H, Huang W (2016) Information Extraction of High Resolution Remote Sensing Images Based on the Calculation of Optimal Segmentation Parameters. PLoS ONE 11(6): e0158585. doi:10.1371/journal.pone.0158585
Editor:Guy J-P. Schumann, University California Los Angeles, UNITED STATES
Received:November 15, 2015
Accepted:June 19, 2016
Published:June 30, 2016
Copyright:© 2016 Zhu et al. This is an open access article distributed under the terms of theCreative Commons Attribution License, which permits unrestricted use, distribution, and reproduction in any medium, provided the original author and source are credited.
Data Availability Statement:All relevant data are within the paper and its Supporting Information files. The authors collected the data necessary to replicate the findings presented in this study, and the authors own the data underlying the findings presented in this study.
temporal, and spectral resolutions. High-resolution remote sensing images are widely used, and the information extraction from high-resolution remote sensing image is an important research direction. High-resolution remote sensing images have high geometric positioning accuracy, good stereo mapping ability, and good flexibility; theyalso provide effective data sup-port for the detailed extraction of spatial objects[1–2]. An automatic, rapid, accurate, and effi-cient extraction method of classification information from high-resolution remote sensing images is urgently needed for high-resolution remote sensing applications[3].
Many scholars have applied the object-oriented method to extract information from high-resolution remote sensing images because of its rich geometry and the texture characteristics. A series of experimental studies has shown that the object-oriented method can add value to information extraction conducted on the same data using different methods[4–9]. In the object-oriented information extraction from high-resolution images, the segmentation is one of the most important steps. The appropriate segmentation parameters, such as the optimal segmentation scale and the shape and structure factors, are the key factors in image segmenta-tion. At present, the calculation method of the optimal scale mainly uses expert experience, cal-culation models, objective functions, and so on. For example, Yan[10] presented an object-oriented typical ground object extraction on the basis of multi-level rules and improved the image segmentation method based on region growing. Hu[11]proposed an optimal segmenta-tion-scale calculation model to improve the accuracy of object-oriented image interpretation. Huang[12] developed mean variance and object max-area method to calculate the scale factor. Tian[13] proposed a framework to identify optimal segmentation scale for a given feature type. Yu[14] proposed a new method of optimal segmentation scale selection for the object-oriented remote sensing image classification-vector distance index method. According to the analysis of the above studies, the current calculation methods of segmentation parameter, such as expert experience and object function method[12,15], focus on the scale factor, depend on expert experience, and is restricted by the lack of mathematical law. Furthermore, the calculation method of the shape and firmness factor is lacking and mainly relies on subjective judgments. Therefore, examining object-oriented high-resolution remote sensing image segmentation, as well as the calculation method of the optimal segmentation parameters and thematic infor-mation extraction according to these segmentation parameters, has important the oretical research significance and practical application value. So, the purpose of this study is to present a calculation method of the optimal segmentation parameters and extract classification infor-mation from high-resolution remote sensing imagebased on the calculation of optimal segmen-tation parameters.
This paper presents a new calculation approach for the optimal segmentation parameters of high-resolution remote sensing image, by which global detection and local optimization, quan-titative analysis and fuzzy rules are employed to explore image characters. Thereafter, the cal-culation method of the image segmentation scale, shape factor, and tightness factor is studied. On the basis of experimental data, the optimal parameters of ground objects are obtained. At last, to confirm the effect and accuracy of this proposed new method, the segmentation classifi-cation result that uses optimal segmentation parameters is compared with the per-pixel super-vised classification result.
Calculation of the Segmentation Parameters
High-resolution remote sensing imageshave subtle information on surface features, such as reflectance characteristics across a spectrum, texture (descriptive statistics concerning the rela-tionships of pixel values to those of their near neighbours within a circumscribed area), the geometry of features defined by groups of contiguous pixels with similar attributes, and the
The Parameters Caculation in Object-Oriented Image Segmentation
relationships of these features to others. The identification and classification of different fea-tures require the combination of many types of feature information. The classification infor-mation extraction of object-oriented images is based on the prior definition of appropriate object-oriented image segmentation. The fractal network evolution algorithm (FNEA) was first proposed by Baatz,M. &A.Schäpe[16], and this method has been adopted by remote sensing software such as eCognition, ENVI and et.al[17]. FNEA integrates the spectrum and spatial heterogeneities of different segmentation objects, and the algorithm achieves the largest homo-geneity within object segmentation and the largest average heterohomo-geneity between objects[16]. The heterogeneity value of the image object spectral information is calculated with the spec-trum weight, shape information weight, spectral value heterogeneity, and shape heterogeneity. In the actual operations of image segmentation, the parameters focus on band combination weights and the segmentation scale, shape and firmness factors[17].
Experimental data and platform
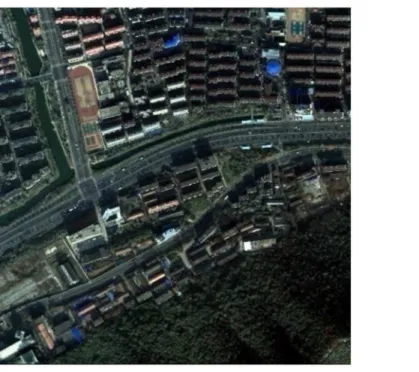
The experimental data in this study is WorldView-2 data including multispectral image and panchromatic image, which were obtained on January13, 2010. The spatial resolution of multi-spectral imageand panchromatic image data are1.8 and 0.5 meter respectively. The study area is located in the Xihu District Hangzhou, China at30°14052.34@N, 120°6016.77@E and 30° 17057.20@N, 120°908.61@E, covering an area of approximately 312.43 km2(Fig 1).
The software packages used in this study are MATLAB, ENVI, and eCognition. MATLAB is used in the attributive data processing of the image objects. The assessment standard for the best segmentation parameter is obtained by the suggested calculation model, and the curve graphs of the relevant scaling parameters are drawn. ENVI is mainly used for image pre-pro-cessing and evaluation, image cropping, and classification information extraction based on image pixels. eCognition is used to obtain the segmentation attribute properties of ground objects, and the multi-scale segmentation and information extraction of the high-resolution remote sensing images are realized with the optimal segmentation parameters.
Image enhancement processing
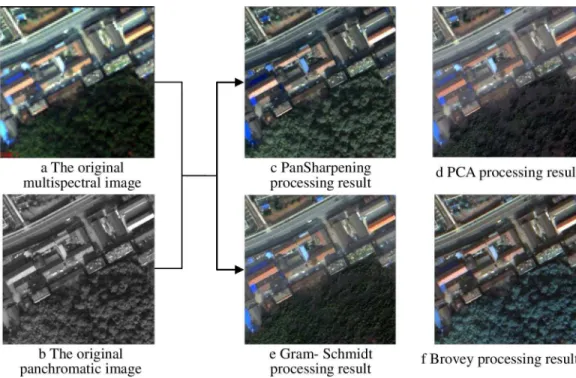
Processing requires that all data have a common pixel size. It is desirable to retain spectral val-ues as close as possible to the original, and to benefit maximally from higher spatial resolution panchromatic data. To accomplish this, four commonly-used methods, such as principal com-ponent analysis (PCA), Gram–Schmidt transformation, Pan-sharpening fusion, and Brovey transform, were selected and compared. The principle of the four methods is described in the references [18]. The processing results are shown inFig 2.
Through the qualitative analysis of the four enhancement processes inFig 2, we find that the object contour, such as roads and buildings, are significantly enhanced. The color of the pan sharpening fusion results has the best effect. The Pan-sharpening and Brovey fusion pro-cessing results show good image sharpness and texture. In the PCA and Brovey fusion results, the resolution of roads, buildings, trees, and bare land is considerably improved, and the tex-ture details are enhanced. However, restricted by the processing band, all types of enhancement results demonstrate different degrees of distortion. The texture and detail information of the Pan-sharpening results are better than those of the other results. Furthermore, some quantita-tive indexes are calculated to objecquantita-tively evaluate the enhancement results. The findings are shown inTable 1. The four quantitative indexes of different images, which are listed in the first column ofTable 1, are the average values of all bands.
suggests that abundant information and good spectral fidelity effect are found in sharpen-ing result. Therefore, on the basis of the qualitative and quantitative analysis results, the Pan-sharpening method is used for data pre-processing in this study.
To improve the efficiency of the experiment, and given the large amount of data generated after image enhancement processing, this study uses the cut 400400 pixel image as the Fig 1. The experimental data.The two sketch maps on the left indicate Natural coloring multi-spectral image of the study area; the right side is panchromatic image of the study area.
doi:10.1371/journal.pone.0158585.g001
Fig 2. Image enhancement processing results.
doi:10.1371/journal.pone.0158585.g002
experiment data. The cutting result is shown inFig 3. The cutting experiment data, including the typical urban setting, can be used to calculate the segmentation parameters and perform image classification.
Calculation of the optimal segmentation scale factor
Methodology. At present, the variance method is mainly used to calculate the optimal image segmentation scale[11], but this method only considers polygon object spectral informa-tion and does not consider the image’s spectral structure of the object. To address the defi-ciency of the variance method, this study proposes a weighted variance method of the optimal segmentation scale calculation based on the spectral structure. The applied process is described as follows:
• Calculation of several parameters
The mean value of the single Pan-sharpened band is the average brightness value of all pix-els that are affiliated with the same object. The mean variance of the single Pan-sharpened band refers to the variance of the mean value of all the objects. The mean value of object b is presented inFormula (1), and that of the entire image object is presented inFormula (2):
CLb¼
1
nS
n
i¼1CLbi ð1Þ
CLb¼
1
mS
m
i¼1CLb ð2Þ
In Formulas(1)and(2), CLbiis the brightness value of the pixel i of the object b in the band L, n is the number of pixels of one object, CLbis the brightness average value of object b in the band L, and m is the number of objects.
• Calculation of the weighted variance
Formulas(1)and(2)are used to calculate the average variance of each band.Formula (3)is then used to calculate the weighted variance:
S2 ¼SN
L¼1tLS
2
L ð3Þ
InFormula (3), N is the number of bands, tLis the weight of the band L, and S
2
Lis the
vari-ance of the band L.
• Determination of the segmentation band and its weight
This study uses the analytical method of the optimum index factor (OIF,Formula 4), which was developed by Chavez to determine the optimal band combination[19]. In the OIF method, Table 1. Quantitative index of enhancement results.
mean value standard deviation information entropy Deviation index
original panchromatic image 391.13 59.00 1.95
original multispectral image 332.27 50.46 1.95
PCA processing result 332.29 49.21 1.82 0.10
Gram-Schmidt processing result 332.28 49.82 1.84 0.11
Brovey processing result 129.88 20.05 1.59 0.29
Pan-Sharpening processing result 333.21 53.44 1.86 0.06
the optimal band combination is determined according to the standard deviation of the bands and the inter-band correlation coefficient. Generally, the informative bands with small correla-tions and large spectral differences are selected:
OIF¼
X3
i¼1si
X3
i¼1
X3
j¼iþ1jRijj
ð4Þ
InFormula (4),siis the standard deviation of band i, andRijis the correlation coefficient between two arbitrary bands. Calculating the covariance matrix and the correlation coefficient matrix of every two bands obtains the OIF values of different band combinations. The optimal band combination of image segmentation corresponds to the OIF maximum value. At the same time, the segmentation weights of the optimal band combination are determined accord-ing to the covariance matrix of every two bands.
• Drawing the corresponding curve scale between the variance and segmentation scale to determine the optimal segmentation scale value
Drawing the corresponding curve scale between the variance and segmentation scale, as well asaccessing the peaks of the curve, determines the optimal segmentation scale value. Com-bined with the visual interpretation method, the segmentation scale value corresponding to each featuretype is analyzed and obtained.
Experiment and results analysis. 1. Band combination and its weight
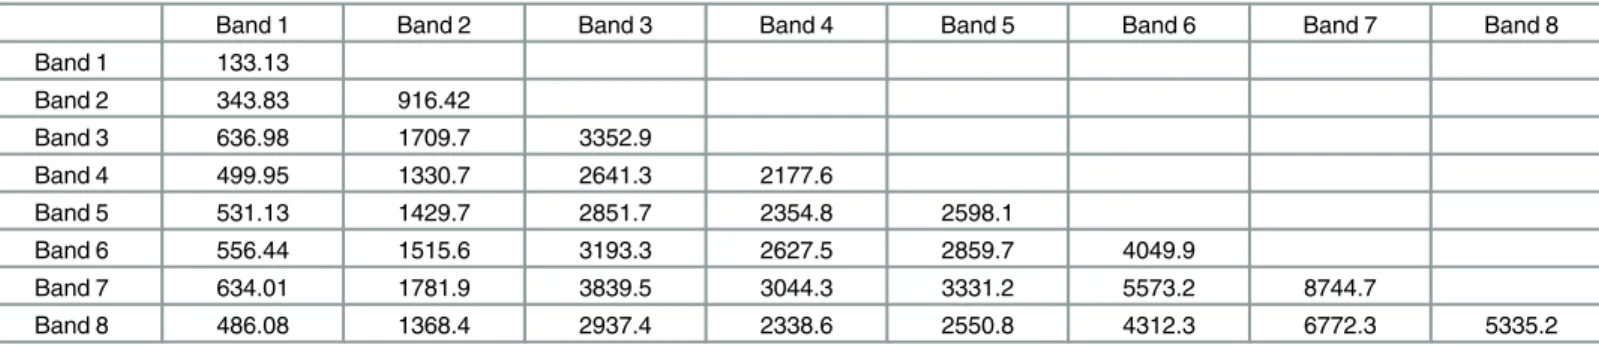
The covariance matrix and correlated coefficient matrix of every two bands of the experi-ment data were calculated. The results are shown in Tables2and3. The optimal band combi-nation and OIF value of the experiment data are calculated withFormula (5). The results are listed inTable 4.
Fig 3. The study area after subset.
doi:10.1371/journal.pone.0158585.g003
Table 4shows that the OIF values of bands 3, 5, and 7 are the largest. This result indicates that the combination of bands 3, 5, and 7 that correspond to the largest OIF values have the largest amount of information, and the correlations between bands are minimal. Therefore, the best combination of bands for this experiment is bands3, 5, and 7. The segmentation weight of each band is cited according to the spectral information of each band.Table 2shows that the variances of bands 7, 3, and 9 are 8744.7, 3352.9, and 2598.1, respectively. The variance of band 7 is approximately three times as much as that of bands 3 and 5. As a result, the weighted values of bands 3 and 5 are set to 1, the weighted value of band 7 is set to 3, and the weighted values of the rest of the bandsare set to 0in the image segmentation experiment.
2. Segmentation scale calculation experiment
The image segmentation experiment is done by eCognition. The segmentation scale range is set to from 10 to 300, the step length is set to20, the shape factor is set to 0.3, and the tightness Table 2. Band covariance matrix of study area.
Band 1 Band 2 Band 3 Band 4 Band 5 Band 6 Band 7 Band 8
Band 1 133.13
Band 2 343.83 916.42
Band 3 636.98 1709.7 3352.9
Band 4 499.95 1330.7 2641.3 2177.6
Band 5 531.13 1429.7 2851.7 2354.8 2598.1
Band 6 556.44 1515.6 3193.3 2627.5 2859.7 4049.9
Band 7 634.01 1781.9 3839.5 3044.3 3331.2 5573.2 8744.7
Band 8 486.08 1368.4 2937.4 2338.6 2550.8 4312.3 6772.3 5335.2
doi:10.1371/journal.pone.0158585.t002
Table 3. Band correlation matrix of study area.
Band 1 Band 2 Band 3 Band 4 Band 5 Band 6 Band 7 Band 8
Band 1 1.00
Band 2 0.98 1.00
Band 3 0.95 0.98 1.00
Band 4 0.93 0.94 0.98 1.00
Band 5 0.90 0.93 0.97 0.99 1.00
Band 6 0.76 0.79 0.87 0.88 0.88 1.00
Band 7 0.59 0.63 0.71 0.70 0.70 0.94 1.00
Band 8 0.58 0.62 0.69 0.69 0.69 0.93 0.99 1.00
doi:10.1371/journal.pone.0158585.t003
Table 4. The OIF of study area image.
Band combination OIF Band combination OIF Band combination OIF
3,5,7 3386.626 3,5,8 3126.68 5,6,8 2934.911
3,7,8 3350.293 4,6,7 3116.223 4,5,8 2909.966
3,6,7 3309.136 3,6,8 3056.632 2,4,7 2887.827
3,4,7 3298.084 3,4,8 3035.3 4,6,8 2859.116
5,7,8 3257.31 2,3,7 3032.239 3,5,6 2808.586
5,6,7 3188.997 2,7,8 2997.406 6,7,8 2805.054
4,7,8 3183.097 2,5,7 2984.53 2,3,8 2757.239
4,5,7 3174.843 2,6,7 2976.376 1,3,7 2749.029
factor is set to 0.5. The initial segmentation sequence is then obtained. The segmentation sequence result is shown inFig 4. The object segmentation number presents an exponential change when the segmentation dimensions are in the range of 10 to 50, whereas the object seg-mentation number presents little change when the segseg-mentation scale is more than 200. There-fore, the segmentation scale range in this study is confirmed to be between 50 and 200, and the segmentation sequence result is shown inFig 5.
3. Result analysis and discussion
With the use of the different scales, the attribute information of the polygon object in a dif-ferent scale layer is obtained. Finally, the variance weighted average values and variance values Fig 4. The relationship between the number ofobjects and segmentation scale.
doi:10.1371/journal.pone.0158585.g004
Fig 5. The selected of segmentation scale.
doi:10.1371/journal.pone.0158585.g005
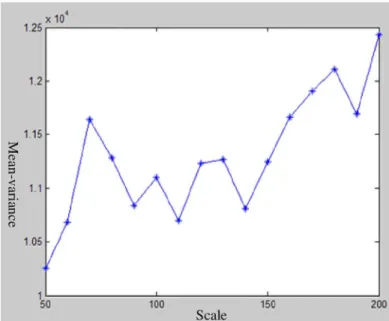
of the objects in different image layers are calculated with the method above-mentioned. The corresponding curve graph between the variance or weighted variance value and the segmenta-tion scale is drawn. The result is shown in Figs6and7. The optimal segmentation scale values can be identified by analyzing the curve graph.
Figs6and7depict that the variance value of each band is large, but the curves are similar to one another. Many peaks also appear in the curve graph (Fig 7) and these peaks correspond to the segmentation scale of 70, 100, 120, 130 and 180.Fig 6shows that the scale of 130 is a local peak in the near-infrared band, whereas the scale of 120 is a local peak in the green and red Fig 6. The relationship between mean-variance and segmentation scales for each band.
doi:10.1371/journal.pone.0158585.g006
Fig 7. Relationship between the weighted mean-variance and segmentation scale.
bands. These results illustrate that the scales of 120 and 130 are inconsonant among these three image bands. Thus, the segmentation scales of 70, 100, and 180 are selected for image segmen-tation. The image segmentation results that correspond to the three segmentation scales are shown inFig 8.
From the analysis ofFig 8, we can conclude that the information on vegetation and bare patches in the segmentation result is comparatively complete with the use of the segmentation scale of 70. Most of the shadows and buildings in the segmentation results are extracted with the use of the segmentation scale of 100. The area and shape of the water object are not changed, whereas the roads are combined into large objects. Furthermore, their shapes become regular with the use of the segmentation scale of 180. Therefore, in the segmentation layer that uses as cale of 180, the information extraction of roads, water, and large areas of vegetation has an improved effect.
Calculation of the shape and firmness factor
The quality of image segmentation is not only interrelated with the band weight and integral scale but also with the shape and firmness factors[15]. In the current study, the shape and firm-ness factors are calculated by the control variable method.
Methodology. The control variable method involves two steps:
1. The optimal segmentation scale value is set to the value corresponding to the feature, and its initial tightness factor value is set to 0.5 on the basis of the results of the optimal segmenta-tion scale value in above-mensegmenta-tioned. The relasegmenta-tion graph between the heterogeneity or homogeneity index value and the shape factor is drawn by a change in the shape factor parameters. The optimal parameters of the shape factor are obtained by analyzing the rela-tion graph.
2. The basis of the optimal segmentation scale value, the optimal parameters of the shape fac-tor, and the tightness factor parameters are changed. The relation graph between the hetero-geneity or homohetero-geneity index value and the tightness factor value is drawn. The optimal parameters of the tightness factor value are obtained by analyzing the relation graph.
Experiment and result analysis. 1. Calculation of the shape factor.
The shape factor is set in the range of 0 to 0.8, and its step length is set to 0.1. The average segmentation evaluation index (ASEI) is used to determine the optimal parameters of the shape factor. The ASEI calculation formula is presented as Formulas(5)to(8):
VL¼ Pn
i¼1aivi Pn
i¼1ai
ð5Þ
DCL¼
1
l
Xn
i¼1
Xm
j¼1lijjCL CLij ð6Þ
ASEIL¼ DCL
VL
ð7Þ
ASEII¼
Xm
L¼1wLASEIL ð8Þ InFormula (5), viis the standard deviation of object, aiis the area of object i, and n is the number of objects in the experimental region. InFormula (8), n is the number of objects in the
experimental region,ΔCLis the absolute value of the difference between the object and the neighborhood pixel mean value in the band L, CLiis the pixel value of i in the band L, CLis the
pixel mean value of one object in the band L, m is the number of objects neighboring the target object, l is the boundary length of the target object, and lijis the boundary length of objects i and j. In Formulas(7)and(8), ASEILis the heterogeneity index of band L, and ASEIis the het-erogeneity index of all bands.
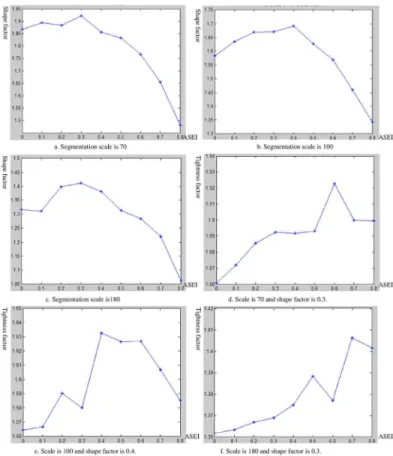
The ASEI value is calculated by the formulas from formulas(5)to(8), and the relation graph between the shape factor and ASEI, which is shown in (Fig 9a–9c), is drawn. In (Fig 9a– 9c), these coordinate figures of the horizontal and vertical axis represent the shape factor and Fig 8. The result of different segmentation scales.
doi:10.1371/journal.pone.0158585.g008
Fig 9. a-c: The relationships between shape factor of each segmentation scale and ASEI. d-f: The relationships between compactness factor of each segmentation scale and ASEI.
ASEI values. The analysis of (Fig 9a–9c) shows that the optimal shape factor values are 0.3, 0.4, and 0.3, which correspond to the optimal segmentation scale values, such as 70, 100, and 180.
3. Calculation of the tightness factor
The band weighting factor, optimal segmentation scale, and its corresponding optimal shape factor parameter are unchanged. The tightness factor is set in the range of 0 to 0.8, and the step length is set to 0.1. ASEI is used to determine the optimal parameters of the tightness factor. The ASEI calculation is shown as the formulas from formulas(5)) to(8). The relation graph between the tightness factor and ASEI is shown in (Fig 9d–9f). In (Fig 9d–9f), the coordi-nate figures of the horizontal and vertical axes represent the tightness factor and ASEI values. By analyzing (Fig 9d–9f), we can find that the directions of the curve are changed, and that multiple local peaks appear.
Classification Result and Analysis
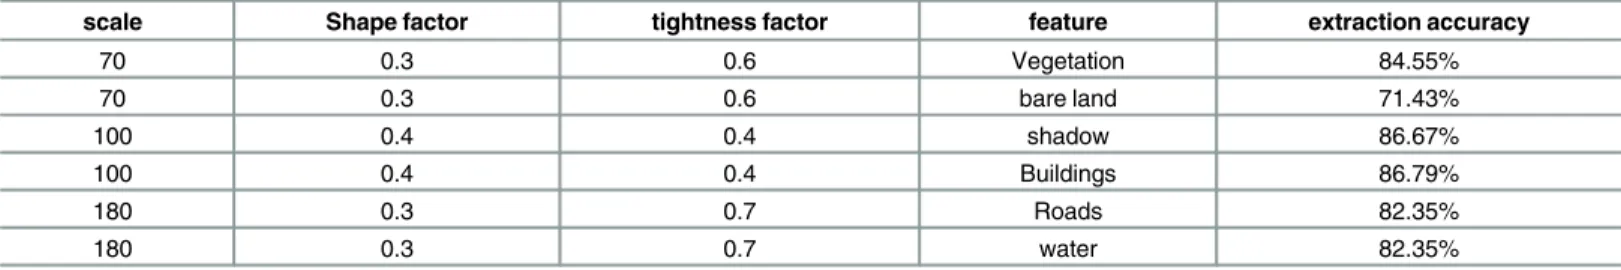
Calculation results of the optimal segmentation parameters
According to the calculation method and the experimental process described as above-mentioned, the specific parameters of the optimal segmentation results are obtained. These results are listed in
Table 5. The optimal correspondence of the three parameters is left three columnsTable 5.
Classification based on image optimal segmentation parameters
This study has obtained the features segmentation results by using the optimal segmentation parameters. The accuracy of each feature classification is right two columnsTable 5.In the process of multi-scale segmentation classification, image segmentation was realized with the use of a multi-level segmentation technology, and the network hierarchy of the image object was established on the basis of the segmentation results. Finally, the feature information was extracted by selecting the optimal segmentation on different object layer parameters and spectral characteristics. This research area is mainly divided into three parts. Given that the roads and water are spread out over a large area, and they present an aggregate distribution, the first layer contains water and road information and is represented by few objective polygons. The second layer is the sub-layer of the first layer, which is used to extract building and shadow infor-mation. The third layer is the sub-layer of layers 1 and 2, and is used to extract vegetation and bare land information. A few separate polygons are used to represent this feature information.
Classification result analysis and discussion
The multi-scale segmentation classification result of the experiment data are shown inFig 10a. To verify that the classification accuracy is improved, the supervised classification result of the experiment data is calculatedFig 10b.
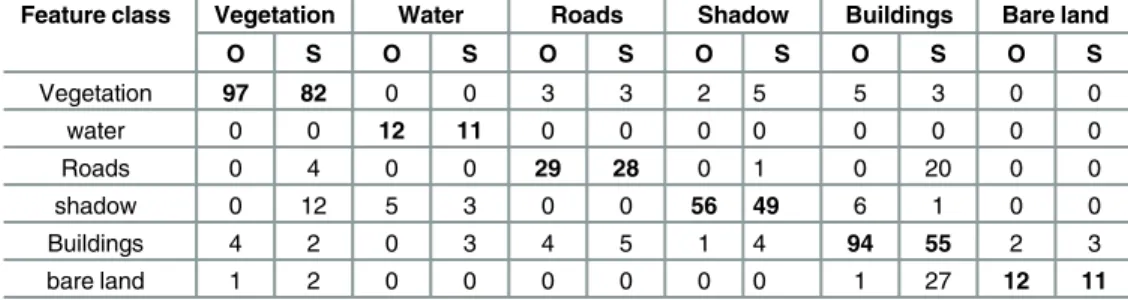
To verify the reliability of the multi-scale segmentation classification result, the confusion matrixes of the classification results for the feature misclassification rates are calculated, and the
Table 5. The extraction accuracy corresponding to its optimal segmentation parameters.
scale Shape factor tightness factor feature extraction accuracy
70 0.3 0.6 Vegetation 84.55%
70 0.3 0.6 bare land 71.43%
100 0.4 0.4 shadow 86.67%
100 0.4 0.4 Buildings 86.79%
180 0.3 0.7 Roads 82.35%
180 0.3 0.7 water 82.35%
doi:10.1371/journal.pone.0158585.t005
results are shown inTable 6. The data inTable 6show that the misclassification rates of all fea-tures of the supervised classification result, particularly buildings and vegetation, are higher than those of the multi-scale segmentation classification result. Thereafter, the degree of accuracy of the two classification result is calculated. The overall accuracy of the multi-scale segmentation classification result is 89.55%, and its Kappa coefficient is 0.862. While the overall accuracy of supervised classification result is 70.45% and its Kappa coefficient is 0.626. The accuracy of the multi-scale segmentation classification result is considerably improved compared with the super-vised classification result. The comparison result indicates that the multi-scale segmentation clas-sification and the optimal extraction parameters are effective. The multi-scale segmentation classification method can maximize the use of the spectrum, the structure feature, and texture information. For example, roads and buildings use the structure characteristics of the aspect ratio; thus the accuracy of the information extraction is considerably improved.
Discussion and Conclusion
In this study, the optimal segmentation parameters method of object-oriented image segmen-tation and high-resolution image information extraction are examined in depth. For the WorldView-2 experimental data, the Panimage sharpening fusion method is the optimal method. It does not only maintain the original image spectral information but also enhances Fig 10. Two kinds of classification results.
doi:10.1371/journal.pone.0158585.g010
Table 6. The confusion matrix of multi-scale segmentation and supervised classification result.
Feature class Vegetation Water Roads Shadow Buildings Bare land
O S O S O S O S O S O S
Vegetation 97 82 0 0 3 3 2 5 5 3 0 0
water 0 0 12 11 0 0 0 0 0 0 0 0
Roads 0 4 0 0 29 28 0 1 0 20 0 0
shadow 0 12 5 3 0 0 56 49 6 1 0 0
Buildings 4 2 0 3 4 5 1 4 94 55 2 3
bare land 1 2 0 0 0 0 0 0 1 27 12 11
Note: in Table 6, the letter O indicates multi-scale segmentation classification result, and the letter S indicates supervised classification result.
the image texture and spatial information. OIF indicates bands 7, 5, and 3 are the best combi-nation of object-oriented image segmentation, and that their segmentation weights are 3, 1, and 1, respectively. The improved weighted variance method is proposed to calculate the opti-mal segmentation scale, and this scale is selected with the use of such a method. The optimum shape factor parameters and the tightness factor are calculated by the application of the control variable method and by using the numerical results of the heterogeneity and homogeneity indexes. The experiment results indicate that the vegetation and bare land extraction effect are the best when the segmentation scale is set to 70, the shape parameter is set to 0.3, and the tightness factor is set to 0.6. Buildings and the shadow extraction effect show the best results when the segmentation scale is set to100, the shape parameter is set to 0.4, and the tightness factor is set to 0.4. Finally, roads and the water extraction effect are the best when the segmen-tation scale is set to180, the shape parameter is set to 0.3, and the tightness factor is set to 0.7. Multi-scale segmentation is realized for the image according to the calculated optimal parame-ters, and the level of hierarchical network structure is established. An 89.55% overall accuracy of extraction and 0.862 Kappa coefficient are achieved when the rules of information extraction are set, and object-oriented information extraction is conducted. As a result, information extraction is significantly improved. These results indicate that the proposed information extraction of object-oriented high-resolution remote sensing images based on the optimal seg-mentation parameters is highly effective and has practical value.
We propose an objective method that uses the inherent properties of remote sensing data (object autocorrelation and variance) to support the calculation of segmentation parameters. The proposed method allows users to benefit from the potential of object-based classification methods for extracting information from high-resolution satellite images. Therefore, further researches are expected to realize the automaticity of the method, particularly the use of the remote sensing software tools such as eCognition. The optimal segmentation parameter calcu-lation is based on the scale parameter sequence, and it has some limitations. So, we still need to further study the dimension parameters on image segmentation results of comprehensive eval-uation index, the optimal segmentation scale and scope in the future. In addition, the relation-ship between the image resolution and the optimal parameters, especially the scale parameter, should be further examined in the future work.
Supporting Information
S1 Dataset. This is the raw data of image enhancement processing results, and it also is the raw data offig 2.
(ZIP)
S2 Dataset. This is the raw data of the subset dataresults, and it also is the raw data offig 3. (ZIP)
S3 Dataset. The raw data of segmentation and classification experiments. (ZIP)
S4 Dataset. The figures of this article. (ZIP)
Acknowledgments
This letter is under the auspices of the National Natural Science Foundation of China (NO.41471331, 41376108, 41301422), and this work is part of the research project which is above mentioned.
Author Contributions
Conceived and designed the experiments: HCZ. Performed the experiments: HCZ LJC. Ana-lyzed the data: HCZ LJC. Contributed reagents/materials/analysis tools: HYL. Wrote the paper: HCZ LJC WH.
References
1. Zhao YS, Chen DM, Yang LM, Li XW, Tang WZ. The Principle and Method of Analysis of Remote Sens-ing Application. BeijSens-ing: Science press; 2009.
2. Guan YX, Chen XY. Guide for High resolution satellite image processing. Beijing: Science press; 2008.
3. Myint SW, Gober P, Brazel A, Grossman-Clarke S, Weng Q. Per-pixel vs. Object-based classification of urban land cover extraction using high spatial resolution imagery. Remote Sensing of Environment. 2011; 115:1145–1161.
4. Tian XG. Object-oriented information extraction from high resolution remote sensing imagery. Beijing: Chinese Academy of Surveying & Mapping. 2007.
5. Balaguer A, Ruiz LA, Hermosilla T, Recio JA. Definition of a comprehensive set of texture semivario-gram features and their evaluation for object-oriented image classification. Computers & Geosciences. 2010; 36(2):231–240.
6. Tan QL. Urban Building Extraction from VHR Multi-spectral Images Using Object-based Classification. Acta Geodaeticaet Cartograhica Sinica. 2010; 39(6): 618–623.
7. Tao C,Tan YL,Cai HJ,Bo DU,Tian J. Object-oriented Method of Hierarchical Urban Building Extraction from High-resolution Remote-sensing Imagery. Acta Geodaeticaet Cartograhica Sinica. 2010; 39(1): 618–623.
8. Wang H, Chen JS, Yu XM. Feature Selection and its application in object-oriented classification. Jour-nal of Remote Sensing. 2013; 17(4): 822–829.
9. Mahmoudi FT, Samadzadegan F, Reinartz P. Object oriented image analysis based on multi-agent rec-ognition system. Computers & Geosciences. 2013; 54(4):219–230.
10. Yan L, Zhao Z, Nie Q, Yao Y. Ground Objects Extration from High-Resolution Remote Sensing Image with Rules. Geomatics and Information Science of Wuhan University. 2012; 37(6): 636–639. 11. Hu WL, Zhao P, Dong ZY. An Improved Caculation Model of Object-Oriented for the Optimal
Segmen-tation-Scale of Remote Sensing Image. Geography and Geo-Information Scienc. 2010; 26(6): 15–18. 12. Huang Huiping. Scale Issues in Object-oriented Image Analysi. Beijing: Institute of Remote Sensing
Applications Chinese Academy of Sciences. 2003.
13. Tian J, Chen DM. Optimization in multi-scale segmentation of high-resolution satellite images for artifi-cial feature recognition. International Journal of Remote Sensing. 2007; 28(20): 4625–4644. 14. Yu H, Zhang SQ, Kong B, Li X. Optimal Segmentation Scale Selection for Object-oriented Remote
Sensing Image Classification. Journal of Image and Graphics. 2010; 15(2): 352–360.
15. Lu C. Research on Information Extraction of WorldView-2 Imagery with Object-Oriented Technology. Hangzhou: Zhejiang University. 2012.
16. Baatz M, Schäpe A. Multi resolution segmentation:an optimization approach for high quality multi-sca-leimage segmentation. Journal of Photogrammetry and Remote Sensing. 2007; (34: ):3–4.
17. Baatz M, Benz U, Dehghani S, Heynen M. eCognition User Guide 5. Munich: Definiens Imaging GmbH: 2011.
18. Sheffigara VK. A Generalized Component Substitution Technique for Spatial Enhancement of Multi-spectral Images Using Higher Resolution Data Set. Photogrammetric Enginering and Remote Sensing. 1992; 58(5):561–567.