Unequally Distributed Psychological Assets:
Are There Social Disparities in Optimism, Life
Satisfaction, and Positive Affect?
Julia K. Boehm1*, Ying Chen2, David R. Williams2,3, Carol Ryff4,5, Laura D. Kubzansky2
1Department of Psychology, Chapman University, Orange, California, United States of America,
2Department of Social and Behavioral Sciences, Harvard School of Public Health, Boston, Massachusetts, United States of America,3Department of African and African American Studies and Sociology, Harvard University, Cambridge, Massachusetts, United States of America,4Department of Psychology, University of Wisconsin Madison, Madison, Wisconsin, United States of America,5Institute on Aging, University of Wisconsin Madison, Madison, Wisconsin, United States of America
Abstract
Socioeconomic status is associated with health disparities, but underlying psychosocial mechanisms have not been fully identified. Dispositional optimism may be a psychosocial process linking socioeconomic status with health. We hypothesized that lower optimism would be associated with greater social disadvantage and poorer social mobility. We also investigated whether life satisfaction and positive affect showed similar patterns. Partici-pants from the Midlife in the United States study self-reported their optimism, satisfaction, positive affect, and socioeconomic status (gender, race/ethnicity, education, occupational class and prestige, income). Social disparities in optimism were evident. Optimistic individu-als tended to be white and highly educated, had an educated parent, belonged to higher oc-cupational classes with more prestige, and had higher incomes. Findings were generally similar for satisfaction, but not positive affect. Greater optimism and satisfaction were also associated with educational achievement across generations. Optimism and life satisfac-tion are consistently linked with socioeconomic advantage and may be one conduit by which social disparities influence health.
Introduction
Disparities in health and longevity based on socioeconomic status (SES) are well established [1]. Individuals with lower social status have greater risk of disease and mortality relative to in-dividuals with higher social status. However, less well understood are the pathways underlying this association. Access to health care, engaging in preventative health behaviors like exercising, and exposure to environmental hazards have been suggested as pathways by which SES and health are connected. Psychosocial processes have also been theorized as a possible pathway by which SES and health are linked. For example, the reserve capacity framework posits that indi-viduals in low socioeconomic contexts are exposed to more stressful situations, which may
OPEN ACCESS
Citation:Boehm JK, Chen Y, Williams DR, Ryff C, Kubzansky LD (2015) Unequally Distributed Psychological Assets: Are There Social Disparities in Optimism, Life Satisfaction, and Positive Affect? PLoS ONE 10(2): e0118066. doi:10.1371/journal. pone.0118066
Academic Editor:Jan L. Wallander, Merced, UNITED STATES
Received:August 27, 2014
Accepted:January 7, 2015
Published:February 11, 2015
Copyright:© 2015 Boehm et al. This is an open access article distributed under the terms of the Creative Commons Attribution License, which permits unrestricted use, distribution, and reproduction in any medium, provided the original author and source are credited.
Data Availability Statement:All relevant data from the Midlife in the United States (MIDUS) Study are available from the Inter-university Consortium for Political and Social Research (ICPSR) athttp://www. icpsr.umich.edu/icpsrweb/landing.jsp.
(P01-strain the psychosocial resources (e.g., social support, feelings of control, optimism) that can be used for managing challenges [2]. Moreover, repeated encounters with stress may reduce the number of opportunities that individuals with low SES have to either develop or replenish their psychosocial resources [3]. With both more stressful experiences and fewer psychosocial re-sources with which to cope, worse health outcomes may ensue [4].
Dispositional optimism—or the generalized expectation that good rather than bad events will occur [5]—has been characterized as a health asset. In other words, optimism can be con-sidered a psychosocial resource that may protect health over the life course [6,7]. This is based in part on a growing body of research indicating that optimistic individuals have reduced risk of heart disease and all-cause mortality compared with less optimistic individuals [8–10]. Sev-eral investigators have also reported that optimism appears to be associated with social status, with findings in non-U.S. cohorts suggesting higher optimism is associated with higher SES [11,12]. As a result, optimism has been put forward as a potential psychosocial resource that may explain in part why higher social status is associated with better health [4,13–15].
Optimism can serve as a mechanism by which social advantage leads to better health only if it is itself systematically patterned and produced by income, education, and race/ethnicity such that those with greater social advantage have higher levels of optimism. However, although op-timism is only partly heritable [16], relatively little is known about its distribution across the social structural factors that are so strongly linked to health disparities—hereafter called struc-tural factors [5]. This is partly because epidemiological cohorts do not typically assess disposi-tional optimism; they more often assess other psychological assets (i.e., indicators of positive psychological functioning) such as life satisfaction and positive affect. Limited research indi-cates greater optimism is associated with higher SES (most often indicated by education) among older community members [12] and adolescents or young adults [13,17,18]. But no re-search has systematically examined optimism’s association with key structural factors contrib-uting to social disparities in health among U.S. adults including race/ethnicity, education, occupational class and prestige, and income.
In addition to prior work in British and Finnish cohorts suggesting that low SES is associat-ed with viewing the future less optimistically [11,12], research with other indicators of psycho-logical health suggests that while they may seem intensely personal, they are in fact patterned by structural factors. For example, low SES individuals are more likely to experience higher lev-els of depression and anxiety with greater frequency [19–21]. Moreover, life satisfaction is asso-ciated with social advantage [22,23] such that greater satisfaction is linked with more
education and higher income [24–27]. Whites also tend to report being more satisfied than Blacks and Hispanics in the U.S. [26]. In sum, prior work indicates substantial social disparities in some of the most commonly assessed indicators of psychological health.
Thus, there is reason to suspect that dispositional optimism is similarly patterned by the structural factors that influence access to resources and are linked with health disparities. We posit that optimism may be associated with disparities-related factors because these factors provide a context for either developing or restricting optimistic tendencies. For example, opti-mistic people expect favorable outcomes, persist at goals, use effective coping strategies, and engage with attainable goals or disengage from unattainable goals [28]. Higher levels of educa-tion may foster such skills, as well as the opportunity for positive feedback loops to develop about goal attainment that validate optimistic perspectives. By contrast, poverty and/or the ex-perience of being a racial or ethnic minority may suppress optimistic tendencies because indi-viduals encounter more demanding environments and have fewer resources to combat challenges [20]. Because they are more frequently exposed to unpredictable and difficult situa-tions, individuals of low SES are more likely to develop a schema that the world is threatening, and therefore interpret ambiguous events with more negative and fewer positive attributions AG020166;http://www.nia.nih.gov). The funders had
no role in study design, data collection and analysis, decision to publish, or preparation of the manuscript.
[29]. Such experiences are unlikely to routinely foster upward spirals of optimism. Notably, SES is frequently perpetuated across generations [30,31], and this may extend to the corre-sponding cognitive and affective processes that are associated with lower social status [20]. Thus, in addition to understanding optimism’s association with structural factors, it is also use-ful to consider whether optimism is associated with the educational attainment of one’s parents or responsive to social mobility.
Taken together, our primary aim was to investigate dispositional optimism’s association with a set of social structural factors related to health disparities: gender, race/ethnicity, educa-tion level (of the participant and his or her parents), occupaeduca-tional class, occupaeduca-tional prestige, and income. Consistent with previous research, we expected that higher social position (e.g., higher levels of education and income) would be associated with greater optimism. We also considered age-related patterning as health-related social disparities widen with age [32]. For comparative purposes, and because satisfaction and positive affect are more often included in large epidemiological cohorts, we also considered whether social patterning in optimism is similar to patterning with these psychological assets. Although numerous studies have consid-ered the distribution of life satisfaction or positive affect across social indicators, few have com-pared these patterns with those for optimism. Given the moderate to high correlations between these psychological assets [33], we expected them to be similarly distributed. However, evi-dence that they are not similarly distributed might suggest that unique psychological assets are not equally relevant for understanding how social disadvantage translates into
health outcomes.
A secondary aim was to use a life course perspective to investigate the association of each psychological asset with intergenerational continuity and change in educational attainment. Evidence from a Finnish cohort suggested that optimism was associated with intergenerational trajectories of social mobility such that individuals with persistently high SES (present in child-hood and adultchild-hood) were more optimistic than individuals with persistently low SES or who became upwardly or downwardly mobile [11]. We sought to replicate that finding with educa-tional achievement in U.S. participants, and to examine whether satisfaction and positive affect were similarly influenced by intergenerational trajectories. To our knowledge, limited research has considered whether different psychological assets are influenced by social mobility.
Methods
Participants
Participants were men and women from the Midlife in the United States (MIDUS) study. MIDUS was initially designed to investigate behavioral, psychological, and social factors in aging individuals. The first phase (MIDUS I) began in 1995 and included a national ran-dom-digit-dialing sample, oversamples from five metropolitan areas, siblings of the random-digit-dialing sample, and a national random-random-digit-dialing sample of twin pairs (totalN= 7,108). Individuals were eligible to participate if they were non-institutionalized, spoke English, and were 25–74 years old. A longitudinal follow-up began an average of 9 years later in 2004 (MIDUS II); 4,963 of the original MIDUS I respondents participated in MIDUS II [34]. A new sample of Blacks was also recruited from Milwaukee to participate in MIDUS II (N= 592). Our analyses were based on MIDUS II data so Milwaukee participants could be included and be-cause a well-validated measure of dispositional optimism was assessed then. Thus, the initial sample of 5,555 included main MIDUS II and Milwaukee participants.
completed them compared with the primary phone interview. However, among participants who completed the measures of psychological assets, the vast majority completed all items and over 98% completed at least two thirds of the relevant items in each measure (n = 4,415). Among these participants, some were missing data on structural factors. Where possible, miss-ing data on structural factors at MIDUS II was replaced with MIDUS I data. Thus, sample sizes in the primary analyses were 3,844–4,415, with 1,837 members of a sibling or twin set in the an-alytic sample. Included versus excluded participants tended to be women who were older, white, educated, of a higher occupational class, and with higher household incomes. As a result, estimates of social disparities in the psychological assets may be conservatively estimated in this sample. All respondents provided written informed consent. Original data collection was approved by institutional review boards at the University of Wisconsin Madison, University of California Los Angeles, and Georgetown University. Secondary data analyses were approved by the institutional review boards at Chapman University and Harvard School of Public Health.
Measures
Social structural factors. Social structural factors were self-reported by participants at MIDUS II except for parental education, which was self-reported at MIDUS I for non-Milwaukee par-ticipants. If social structural information from MIDUS II was not available, information from MIDUS I was used when possible. The social structural factors included gender (men, women), race/ethnicity (white, black; other races were excluded), highest level of education attained by either the participant’s mother or father, and highest level of education attained by the partici-pant (each coded as less than high school, high school diploma, some college, college degree or more). In addition, we assessed occupational class (managerial/professional, technical/sales/ clerical/service, manual; homemakers and individuals not currently working were excluded if their previous job was unknown) and Duncan’s socioeconomic index (SEI) as an indicator of the status of participants’current job or previous job if retired [35]. SEI was standardized (M = 0, SD = 1). Standardized scores of +1 (e.g., public administrators with SEI = 54.35), 0 (e.g., postmaster with SEI = 39.84), and-1 (e.g., apparel salesperson with SEI = 25.37) approxi-mated high, average, and low prestige occupations, respectively [36]. Finally, we assessed household income in U.S. dollars, which was further categorized into quintiles ($0 to
<$21,000, $21,000 to<$40,250, $40,250 to<$63,750, $63,750 to<$102,750, $102,750 to
$300,000 or more). To maintain confidentiality, household incomes greater than $300,000 were converted to $300,000.
Following previous work [11,37], we created four trajectories of social mobility across gener-ations for the 1,959 participants whose parents had either less than a high school diploma or a college degree or more. We excluded participants whose parents were moderately educated to focus on effects of either upward or downward social mobility, or stable SES from extreme so-cial-class origins. Intergenerational trajectories of education were categorized as persistently high (high parental education and participant education;n= 592, 30.22%), downwardly mobile (high parental education and low participant education;n= 292, 14.91%), upwardly mobile (low parental education and high participant education;n= 932, 47.58%), and persistently low (low parental education and participant education;n= 143, 7.30%).
positive events and less likely to encounter negative events than others) [39], and situation-specific optimism (i.e., having favorable expectations for a situation-specific event) [40]. Despite using the term“optimism”, these three other definitions are weakly to moderately correlated with dispositional optimism and are considered distinct constructs [5,39,40]. In this study, disposi-tional optimism was assessed with the valid and reliable six-item Life Orientation Test-Revised [41]. Example items are“I expect more good things to happen to me than bad”and“I hardly ever expect things to go my way”(1 =agree a lotto 5 =disagree a lot). Although past work has occasionally derived subscales from the three positively-worded (α= .68) and the three
nega-tively-worded items (α= .80; in the present study, the subscales were correlatedr= -.44), we
followed recommendations to use all six items to more fully characterize optimism [42,43] and to achieve higher internal consistency. An optimism score was derived by reverse coding items as necessary and then summing responses such that greater numbers reflected greater opti-mism (possible scores ranged from 6–30). Following MIDUS data conventions, if at least three items were completed, a missing value was imputed with the mean value of the other items. In-ternal consistency reliability in the present sample was good (α= .79).
Life satisfaction, defined as judgments about life in general or specific life domains [44], was assessed with six previously validated items [45,46] that asked participants to rate their satisfac-tion with work, health, relasatisfac-tionship with spouse/partner, relasatisfac-tionship with children, financial situation, and life overall (0 =the worst possibleto 10 =the best possible). The two items regard-ing relationship satisfaction were first averaged together and subsequently averaged with the remaining items for an overall life satisfaction mean [46]. Following MIDUS data conventions, if at least one item was completed, a mean score was computed with greater numbers reflecting greater satisfaction (possible scores ranged from 1–10). Internal consistency reliability in the present sample was acceptable (α= .72).
Positive affect (colloquially known as happiness) was assessed in response to six items refer-ring to the question:“During the past 30 days, how much of the time did you feel. . .”Items
included“cheerful”,“in good spirits”,“extremely happy”,“calm and peaceful”,“satisfied”, and“full of life”(1 =all of the timeto 5 =none of the time) [47]. Following MIDUS data con-ventions, a mean positive affect score was computed if at least one of the six items was complet-ed. Greater scores reflected more positive affect (possible scores ranged from 1–5). Internal consistency reliability in the present sample was excellent (α= .91). We also examined
positive affect assessed with the Positive Affect and Negative Affect Schedule [48] and the Mul-tidimensional Personality Questionnaire [49,50], but patterns were similar so results are not discussed.
Statistical Analyses
Descriptive analyses were first conducted. Differences in mean psychological assets according to each individual structural factor were then examined with analyses of variance (ANOVAs), which indicate whether at least one level of social strata differs from the others. We also con-ducted focused contrast analyses that tested a linear trend to reflect the expected social gradient [51]. These contrast analyses yieldedFcontrast(which provides the significance level for the
line-ar trend) andrcontrast(which provides the magnitude of effect for the linear trend). Multivariate
Results
Sample characteristics
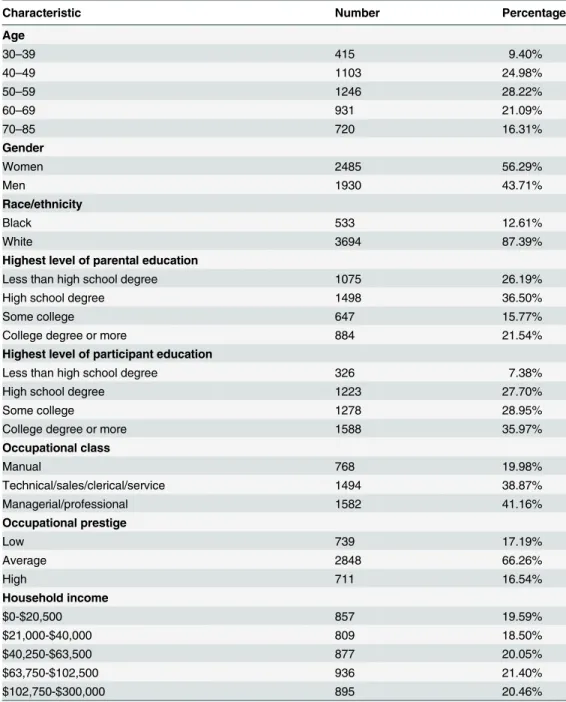
Participants were men (44%) and women (56%), ages 30–85 years (M= 55.85,SD= 12.37). Participants tended to be white, have a high school education or more, be employed in manage-rial/professional or technical/sales/clerical/service positions, and have an average level of occu-pational prestige (Table 1). Younger individuals reported the lowest levels of optimism,
Table 1. Sample characteristics.
Characteristic Number Percentage
Age
30–39 415 9.40%
40–49 1103 24.98%
50–59 1246 28.22%
60–69 931 21.09%
70–85 720 16.31%
Gender
Women 2485 56.29%
Men 1930 43.71%
Race/ethnicity
Black 533 12.61%
White 3694 87.39%
Highest level of parental education
Less than high school degree 1075 26.19%
High school degree 1498 36.50%
Some college 647 15.77%
College degree or more 884 21.54%
Highest level of participant education
Less than high school degree 326 7.38%
High school degree 1223 27.70%
Some college 1278 28.95%
College degree or more 1588 35.97%
Occupational class
Manual 768 19.98%
Technical/sales/clerical/service 1494 38.87%
Managerial/professional 1582 41.16%
Occupational prestige
Low 739 17.19%
Average 2848 66.26%
High 711 16.54%
Household income
$0-$20,500 857 19.59%
$21,000-$40,000 809 18.50%
$40,250-$63,500 877 20.05%
$63,750-$102,500 936 21.40%
$102,750-$300,000 895 20.46%
Note. Sample size for each analysis ranged from 3,844 to 4,415 participants. To maintain confidentiality, household incomes greater than $300,000 were converted to a maximum value of $300,000
satisfaction, and positive affect relative to older individuals (Table 2). However, in general, par-ticipants tended to report levels of psychological assets above the midpoint on each rating scale (optimismM= 23.03,SD= 4.75; satisfactionM= 7.44,SD= 1.32; positive affectM= 3.44,SD = 0.72). For example, the average participant experienced positive affect some or most of the time. The three psychological assets were correlated (optimism and satisfactionr= .44; opti-mism and positive affectr= .44; satisfaction and positive affectr= .52).
Social disparities in psychological assets
The social structural patterning of the three psychological assets is shown inTable 2. Men and women did not differ in reported levels of optimism, satisfaction, or positive affect. The psy-chological assets were associated with race/ethnicity. Optimism and life satisfaction were sig-nificantly higher among Whites relative to Blacks. In contrast, Blacks reported higher positive affect relative to Whites. Optimism also seemed to be strongly patterned by other SES indica-tors. For example, optimism’s association with education in one’s family of origin was robustly graded such that participants who had a parent with a college degree or more were the most optimistic compared to those who had a parent with a high school diploma or less. However, satisfaction did not vary based on parental education. Moreover, a social gradient was not evi-dent for positive affect in the context of parental education. Counter to expectation, partici-pants whose most highly educated parent did not complete high school reported the highest levels of positive affect. Participants’own education level was significantly and positively asso-ciated with optimism and satisfaction. Individuals with a college degree or higher reported being the most optimistic and satisfied compared with less educated individuals. For optimism in particular, the association was strikingly linear such that with each increase in education level, there was an associated increase in optimism. By contrast, positive affect was not signifi-cantly associated with participants’level of education.
The highest levels of optimism and satisfaction were evident among individuals with mana-gerial or professional occupations (i.e., the highest occupational class). Furthermore, both opti-mism and satisfaction had a linear relationship with occupational class such that manual occupations (i.e., the lowest occupational class) had the lowest levels and managerial occupa-tions (i.e., the highest occupational class) had the highest levels. By contrast, positive affect did not differ by occupational class and a linear trend was not evident. Greater occupational pres-tige was also linearly associated with higher levels of optimism and satisfaction, but positive af-fect did not differ by occupational prestige. A similar pattern was evident for income.
Optimism and satisfaction had a linear association with income such that individuals with the highest income reported the greatest optimism relative to their less wealthy counterparts. Posi-tive affect was not significantly associated with income.
Multivariate models that included all of the structural factors simultaneously showed nearly identical patterns as the univariate models presented inTable 2(data not shown). The percent of variance explained by all structural factors was 9% for optimism, 12% for satisfaction, and 4% for positive affect.
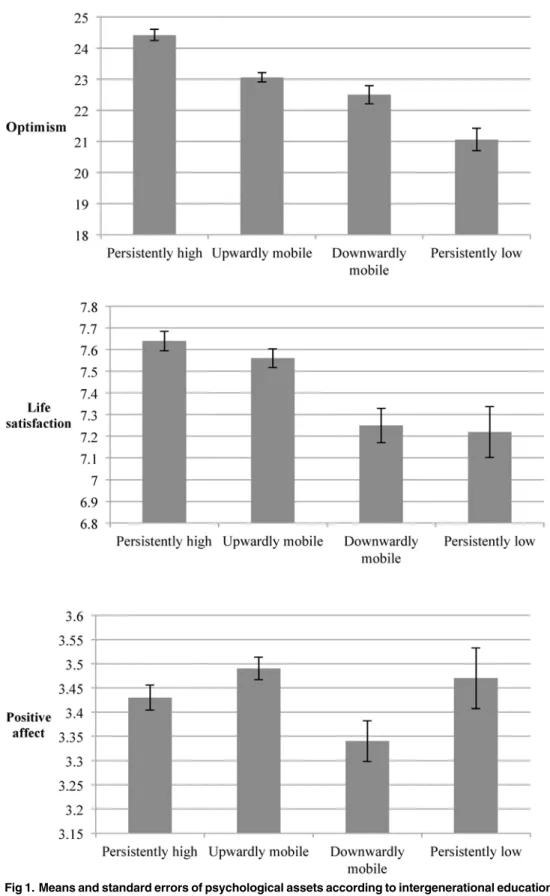
Trajectories of social mobility across generations
Different patterns of optimism, life satisfaction, and positive affect emerged for trajectories of social mobility across generations (Fig. 1). Individuals with persistently higher education across generations had significantly greater optimism than the upwardly mobile, downwardly mobile, and persistently lower educated (post-hoc comparisonsp<0.05). Individuals with persistently
Table 2. Social disparities in psychological assets.
Psychological Assets
Optimism Life Satisfaction Positive Affect
Characteristic Mean (SD)
Omnibus F Contrast F Contrastr (95% CI) Mean (SD)
Omnibus F Contrast F Contrastr (95% CI) Mean (SD)
Omnibus F Contrast F Contrastr (95% CI)
Age 22.17*** 44.18***.10 46.22*** 102.09***.15 26.93*** 50.60*** .11
(.07-.13) (.12-.18) (.08-.14)
30–39 22.01
(4.79)
7.23 (1.26)
3.35 (0.71)
40–49 22.35
(5.03)
7.15 (1.32)
3.33 (0.74)
50–59 23.11
(5.02)
7.32 (1.37)
3.39 (0.74)
60–69 24.06
(4.36)
7.77 (1.23)
3.61 (0.66)
70–85 23.20
(3.96)
7.78 (1.18)
3.54 (0.69)
Gender 0.85 0.85 .01 0.08 0.08 .004 1.01 1.01 .02
(-.02-.04) (-.03-.03) (-.01-.04)
Women 22.98 (4.89) 7.43 (1.34) 3.43 (0.74) Men 23.11 (4.57) 7.45 (1.28) 3.45 (0.70)
Race/Ethnicity 17.41*** 17.41***.06 105.68*** 105.68***.16 36.50*** 36.50*** .09
(.03-.09) (.13-.19) (0.06-.12)
Black 22.28 (4.64) 6.91 (1.57) 3.62 (0.81) White 23.20 (4.76) 7.53 (1.26) 3.42 (0.70) Parental Education
12.42*** 6.04** .04 1.76 0.22 .007 5.76*** 0.06 .004
(.008-.07) (-.02-.04) (-.03-.03)
Less than high school degree 22.79 (4.57) 7.51 (1.33) 3.49 (0.71) High school degree 22.84 (4.83) 7.42 (1.29) 3.39 (0.74) Some college 23.71
(4.74)
7.51 (1.26)
3.48 (0.68) College degree or
more 23.78 (4.67) 7.51 (1.21) 3.40 (0.66) Participant Education
89.25*** 40.87***.10 33.17*** 8.94** .04 0.43 0.53 .01
(.07-.12) (.02-.07) (-.02-.04)
Less than high school degree 20.51 (4.49) 7.00 (1.50) 3.46 (0.84) High school degree 22.03 (4.65) 7.34 (1.40) 3.43 (0.74) Some college 23.12
(4.72)
7.36 (1.32)
3.44 (0.71) College degree or
more 24.26 (4.53) 7.67 (1.16) 3.45 (0.68) Occupational Class
67.87*** 70.52***.13 24.83*** 32.90***.09 0.10 0.20 .007
individuals reporting significantly greater satisfaction compared with all other trajectories ex-cept for the upwardly mobile (post-hoc comparisonsp<0.05). Positive affect differed
signifi-cantly between individuals who were upwardly versus downwardly mobile across generations such that the upwardly mobile reported greater positive affect (post-hoc comparisonp<0.05).
No other comparisons were statistically significant for positive affect.
Table 2. (Continued)
Psychological Assets
Optimism Life Satisfaction Positive Affect
Characteristic Mean (SD)
Omnibus F Contrast F Contrastr (95% CI) Mean (SD)
Omnibus F Contrast F Contrastr (95% CI) Mean (SD)
Omnibus F Contrast F Contrastr (95% CI)
(.10-.17) (.06-.12) (-.02-.04)
Manual 22.05 (4.46) 7.39 (1.26) 3.48 (0.72) Technical/sales/ clerical/service 22.82 (4.67) 7.46 (1.20) 3.48 (0.71) Managerial/ professional 24.21 (4.55) 7.70 (1.13) 3.47 (0.67) Occupational Prestige
74.54*** 81.09***.14 47.32*** 50.67***.11 1.74 0.74 .01
(.11-.17) (.08-.14) (-.02-.04)
Low 21.40 (4.84) 7.08 (1.45) 3.45 (0.79) Average 23.14 (4.69) 7.46 (1.30) 3.43 (0.72) High 24.36 (4.43) 7.74 (1.10) 3.48 (0.65) Household Income
34.75*** 135.03***.17 58.62*** 228.04***.22 0.66 1.82 .02
(.14-.20) (.19-.25) (-.009-.05)
$0-$20,500 21.83 (4.90) 6.97 (1.65) 3.41 (0.81) $21,000-$40,000 22.48 (4.75) 7.31 (1.30) 3.44 (0.70) $40,250-$63,500 23.08 (4.73) 7.43 (1.26) 3.44 (0.73) $63,750-$102,500 23.32 (4.63) 7.59 (1.10) 3.44 (0.68) $102,750-$300,000 24.32 (4.41) 7.86 (1.03) 3.47 (0.67)
Note. Sample size for each analysis ranged from 3,844 to 4,415 participants. To maintain confidentiality, household incomes greater than $300,000 were converted to a maximum value of $300,000. Abbreviations: CI = confidence interval;SD= standard deviation. The omnibusFindicates whether at least one level of social strata differs significantly from the others. The contrastFandrprovide the significance level and magnitude of effect, respectively, for the linear trend reflecting a social gradient. Statistically significantFvalues are indicated with
*p. 05 **p. 01 ***p. 001
Discussion
Although optimism is relevant for health outcomes [6,7,9,10] and is an important psychosocial asset in its own right [5], little is known about its social distribution, particularly among U.S. adults. We examined dispositional optimism’s social structural patterning in the context of a social disparities framework and compared findings on optimism with two more commonly assessed measures of psychological assets in epidemiological cohorts: life satisfaction and posi-tive affect. Our hypothesis that social disparities in optimism would be evident was largely sup-ported (although associations were modest), which is consistent with the reserve capacity framework [4]. Greater levels of optimism were evident among more socially advantaged indi-viduals—that is, those without minority status who had more education, higher occupational classes and prestige, and larger incomes.
Consistent with previous findings [25], optimism, satisfaction, and positive affect did not differ between men and women. However, the patterning across other social structural factors tended to vary, with optimism and life satisfaction generally similar (except in relation to pa-rental education). Whites reported the greatest optimism and satisfaction, whereas Blacks re-ported the greatest positive affect. The highest optimism and satisfaction levels were evident among college-educated participants, but positive affect was not associated with educational at-tainment. Consistent with other studies, optimism was also greatest among participants with at least one college-educated parent [52,53], although this association was of a smaller magnitude than the other statistically significant findings. In contrast, life satisfaction and positive affect were not linearly associated with parental education.
We also found that optimism and life satisfaction were patterned by occupational class such that individuals with professional or managerial jobs were the most optimistic and satisfied. Occupational prestige also had a clear gradient with optimism and satisfaction whereby more prestige correlated with more optimism and satisfaction. This was not the case with positive af-fect, which conflicts with previous findings (but this could be due to differences in methodolo-gy including single sex samples and ecologic momentary assessment methods) [3]. Finally, consistent with past work [54,55], optimism and satisfaction each demonstrated a positive, lin-ear association with income. Although we did not find a statistically significant association be-tween positive affect and income, previous studies report small associations and suggest income’s relation with affect is smaller and more unstable than with satisfaction [56].
When examining intergenerational social mobility, the most optimistic and satisfied indi-viduals were those with high levels of education across generations (i.e., parent and participant were both college-educated). These findings are consistent with those from Heinonen and col-leagues [11] who studied Finnish youth into adulthood, although they also found that the downwardly mobile were more optimistic than the upwardly mobile and the persistently low. In our sample of mostly middle-aged U.S. adults, those who were upwardly mobile were more optimistic and satisfied than the downwardly mobile. We also found that individuals with per-sistently high levels of education across generations did not differ in positive affect from those with persistently low levels of education, the upwardly mobile, or the downwardly mobile. To our knowledge, only one other study has examined links between satisfaction and social mobil-ity [57], and no studies have examined positive affect.
and upwardly mobile, as well as the persistently low and the downwardly mobile. For positive affect, only the comparison between the upwardly mobile and the downwardly mobile was significantly different.
Note. Only participants with low or high parental education were included in these analyses (i.e., participants whose parents were moderately educated were excluded).
Dispositional optimism, life satisfaction, and positive affect are sometimes used as inter-changeable markers in studies examining psychological factors in relation to physical health. Our findings suggest that such practices should be avoided, particularly if studies are investi-gating a possible role for psychological assets in explaining social disparities in physical health. These measures are not proxies for one another as they have different associations with SES. Optimism was consistently related with structural factors, which is in line with the reserve ca-pacity framework. Namely, higher levels of dispositional optimism were evident among more advantaged members of society: white, college-educated individuals with higher occupational positions, prestige, and income. Satisfaction had a similar pattern, with the exception of paren-tal education. Compared with optimism and satisfaction, positive affect seemed to have unique associations with status [56]. This could be because positive affect taps the emotional aspect of well-being whereas optimism and satisfaction are cognitively-oriented. Alternatively, perhaps because affect has evolved to signal whether a particular stimulus may be beneficial or harmful, the utility of positive affect may cut across different levels of SES. Moreover, optimism and sat-isfaction may be patterned similarly because they reflect more enduring characteristics com-pared with positive affect, which may be subject to transient influences. Or, optimism’s (and to a lesser extent satisfaction’s) emphasis on fulfilling meaningful goals versus positive affect’s em-phasis on enjoying pleasure may be more strongly tied to social structural status and capacity to attain goals. Having the educational, financial, and other resources associated with higher status may further enable greater striving and more hopefulness about the future. Although these speculations extrapolate beyond the current data, they could be investigated in future re-search designed to examine the association between psychological assets and structural factors implicated in opportunities (or the lack thereof) across the life course.
The correlational design of the current study prohibits causal conclusions and the size of the reported associations could be considered small according to conventional guidelines. Howev-er, reported associations are comparable to other findings [58] and even very small effects can have a large impact at the population level [59], especially if effects stemming from SES and psychological assets accumulate across the life course [60]. This study captures structural fac-tors at only a single point in time, so it is unclear whether a recent change in status (e.g., chang-ing from employed to unemployed) is associated with changes in psychological assets. In addition, educated individuals were more likely to participate in MIDUS II [34], so reported as-sociations may be conservative due to selective attrition. Although study participants ranged in age from 30–85 years, most were middle aged. And, despite supplementing the sample with Blacks, the current sample was primarily White and numbers were not large enough to investi-gate other racial or ethnic groups separately. Generalization to more diverse samples may not be warranted, although evidence suggests that optimism and other psychological assets are uni-versal phenomena [61,62]. In addition, findings related to intergenerational social mobility were based only on education, not other status indicators such as employment status, occupa-tional class, or income [63,64]. Moreover, educational attainment in earlier generations may not correspond exactly to education attainment in subsequent generations (e.g., a high school diploma for somebody in the early 20thcentury may be equivalent to a college degree for some-body in the mid to late 20thcentury).
accumulate across the lifespan. Indeed, the 4-point spread in optimism scores evident for the highest versus lowest levels of participant education has been shown to translate into a 16% re-duced risk of myocardial infarction and a 30% rere-duced risk of heart disease-related mortality [9]. Thus, even apparently small differences in optimism can have critical health implications.
We also compared the patterning of optimism with two other widely assessed psychological assets, which has not been done previously. Although dispositional optimism is not routinely assessed in surveillance studies, findings reported here suggest that it may reveal unique in-sights about effects of social structure on health (among other pathways), and should be con-sidered for inclusion in future assessments. Moreover, given links between optimism and improved mental and physical health [6,65], assessment of optimism may provide additional insight into social disparities in health or other factors that shape capacity for positive adapta-tion in the context of adversity [66]. Because optimism and satisfaction appear to be related to social structural influences and health, they may be useful targets for both policy-oriented as well as individual-level intervention strategies for improving population health. Furthermore, increasing educational opportunities and otherwise reducing social disparities may not only improve physical health, but may also foster greater psychological assets.
Acknowledgments
We thank the staff of the clinical research centers at Georgetown University, University of Wis-consin-Madison, and University of California, Los Angeles for their support in conducting this study.
Author Contributions
Conceived and designed the experiments: JB LK. Analyzed the data: YC JB. Wrote the paper: JB LK YC DW CR. Acquisition of data: DW CR. Critical revisions: DW CR LK YC.
References
1. Adler NE, Ostrove JM (1999) Socioeconomic status and health: what we know and what we don’t. Ann N Y Acad Sci 896: 3–15. PMID:10681884
2. Gallo LC (2009) The Reserve Capacity Model as a framework for understanding psychosocial factors in health disparities. Applied Psychology: Health and Well-Being 1: 62–72.
3. Gallo LC, Bogart LM, Vranceanu A-M, Matthews KA (2005) Socioeconomic status, resources, psycho-logical experiences, and emotional responses: a test of the Reserve Capacity Model. J Pers Soc Psy-chol 88: 386–399. PMID:15841865
4. Gallo LC, de los Monteros KE, Shivpuri S (2009) Socioeconomic status and health: what is the role of reserve capacity? Current Directions in Psychological Science 18: 269–274. PMID:22210579 5. Carver CS, Scheier MF, Segerstrom SC (2010) Optimism. Clin Psychol Rev 30: 879–889. doi:10.
1016/j.cpr.2010.01.006PMID:20170998
6. Rasmussen HN, Scheier MF, Greenhouse JB (2009) Optimism and physical health: a meta-analytic re-view. Ann Behav Med 37: 239–256. doi:10.1007/s12160-009-9111-xPMID:19711142
7. Boehm JK, Kubzansky LD (2012) The heart’s content: the association between positive psychological well-being and cardiovascular health. Psychol Bull 138: 655–691. doi:10.1037/a0027448PMID:
22506752
8. Boehm JK, Peterson C, Kivimaki M, Kubzansky LD (2011) A prospective study of positive psychologi-cal well-being and coronary heart disease. Health Psychol 30: 259–267. doi:10.1037/a0023124
PMID:21553969
9. Tindle HA, Chang YF, Kuller LH, Manson JE, Robinson JG, et al. (2009) Optimism, cynical hostility, and incident coronary heart disease and mortality in the Women’s Health Initiative. Circulation 120: 656–662. doi:10.1161/CIRCULATIONAHA.108.827642PMID:19667234
11. Heinonen K, Raikkonen K, Matthews KA, Scheier MF, Raitakari OT, et al. (2006) Socioeconomic status in childhood and adulthood: associations with dispositional optimism and pessimism over a 21-year fol-low-up. J Pers 74: 1111–1126. PMID:16787430
12. Robb KA, Simon AE, Wardle J (2009) Socioeconomic disparities in optimism and pessimism. Int J Behav Med 16: 331–338. doi:10.1007/s12529-008-9018-0PMID:19424813
13. Khullar D, Oreskovic NM, Perrin JM, Goodman E (2011) Optimism and the socioeconomic status gradi-ent in adolescgradi-ent adiposity. J Adolesc Health 49: 553–555. doi:10.1016/j.jadohealth.2011.04.003
PMID:22018574
14. Taylor SE, Seeman TE (1999) Psychosocial resources and the SES-health relationship. Ann N Y Acad Sci 896: 210–225. PMID:10681899
15. Schöllgen I, Huxhold O, Schüz B, Tesch-Römer C (2011) Resources for health: differential effects of optimistic self-beliefs and social support according to socioeconomic status. Health Psychol 30: 326–335. doi:10.1037/a0022514PMID:21553976
16. Mosing MA, Zietsch BP, Shekar SN, Wright MJ, Martin NG (2009) Genetic and environmental influ-ences on optimism and its relationship to mental and self-rated health: a study of aging twins. Behav Genet 39: 597–604. doi:10.1007/s10519-009-9287-7PMID:19618259
17. Finkelstein DM, Kubzansky LD, Capitman J, Goodman E (2007) Socioeconomic differences in adoles-cent stress: the role of psychological resources. J Adolesc Health 40: 127–134. PMID:17259052 18. Schutte JW, Valerio JK, Carrillo V (1996) Optimism and socioeconomic status: a cross-cultural study.
Social Behavior and Personality 24: 9–18.
19. Akhtar-Danesh N, Landeen J (2007) Relation between depression and sociodemographic factors. Int J Ment Health Syst 1: 4. doi:10.1186/1752-4458-1-4PMID:18271976
20. Gallo LC, Matthews KA (2003) Understanding the association between socioeconomic status and physical health: do negative emotions play a role? Psychol Bull 129: 10–51. PMID:12555793 21. Lorant V, Deliege D, Eaton W, Robert A, Philippot P, et al. (2003) Socioeconomic inequalities in
depres-sion: a meta-analysis. Am J Epidemiol 157: 98–112. PMID:12522017
22. Marmot M, Ryff CD, Bumpass LL, Shipley M, Marks NF (1997) Social inequalities in health: next ques-tions and converging evidence. Soc Sci Med 44: 901–910. PMID:9080570
23. Keyes CLM, Shmotkin D, Ryff CD (2002) Optimizing well-being: the empirical encounter of two tradi-tions. J Pers Soc Psychol 82: 1007–1022. PMID:12051575
24. Agrawal J, Murthy P, Philip M, Mehrotra S, Thennarasu K, et al. (2011) Socio-demographic correlates of subjective well-being in urban India. Soc Indic Res 101: 419–434.
25. Diener E, Ryan K (2009) Subjective well-being: a general overview. South African Journal of Psycholo-gy 39: 391–406.
26. Barger SD, Donoho CJ, Wayment HA (2009) The relative contributions of race/ethnicity, socioeconom-ic status, health, and social relationships to life satisfaction in the United States. Quality of Life Re-search: An International Journal of Quality of Life Aspects of Treatment, Care & Rehabilitation 18: 179–189. doi:10.1016/j.eururo.2013.10.017PMID:24210091
27. Fernández-Ballesteros R, Zamarrón MD, Ruíz MA (2001) The contribution of socio-demographic and psychosocial factors to life satisfaction. Ageing & Society 21: 25–43. doi:10.1016/j.rmr.2014.07.017
PMID:25597021
28. Rasmussen HN, Wrosch C, Scheier MF, Carver CS (2006) Self-regulation processes and health: the importance of optimism and goal adjustment. J Pers 74: 1721–1747. PMID:17083664
29. Chen E, Matthews KA (2003) Development of the cognitive appraisal and understanding of social events (CAUSE) videos. Health Psychol 22: 106–110. PMID:12558208
30. Mazumder B (2005) Fortunate sons: new estimates of intergenerational mobility in the United States using social security earnings data. The Review of Economics and Statistics 87: 235–255.
31. Aaronson D, Mazumder B (2008) Intergenerational economic mobility in the United States, 1940 to 2000. The Journal of Human Resources 43: 139–172.
32. Ross CE, Wu CL (1996) Education, age, and the cumulative advantage in health. J Health Soc Behav 37: 104–120. PMID:8820314
33. Lucas RE, Diener E, Suh E (1996) Discriminant validity of well-being measures. J Pers Soc Psychol 71: 616–628. PMID:8831165
34. Radler BT, Ryff CD (2010) Who participates? accounting for longitudinal retention in the MIDUS nation-al study of henation-alth and well-being. J Aging Henation-alth 22: 307–331. doi:10.1177/0898264309358617
PMID:20103686
36. Chapman BP, Fiscella K, Duberstein P, Coletta M, Kawachi I (2009) Can the influence of childhood so-cioeconomic status on men’s and women’s adult body mass be explained by adult socioeconomic sta-tus or personality? Findings from a national sample. Health Psychol 28: 419–427. doi:10.1037/ a0015212PMID:19594266
37. Poulton R, Caspi A, Milne BJ, Thomson WM, Taylor A, et al. (2002) Association between children’s ex-perience of socioeconomic disadvantage and adult health: a life-course study. Lancet 360:
1640–1645. PMID:12457787
38. Peterson C (1991) The meaning and measurement of explanatory style. Psychological Inquiry 2: 1–10.
39. Shepperd JA, Carroll P, Grace J, Terry M (2002) Exploring the causes of comparative optimism. Psy-chologica Belgica 42: 65–98.
40. Taylor SE, Kemeny ME, Aspinwall LG, Schneider SG, Rodriguez R, et al. (1992) Optimism, coping, psychological distress, and high-risk sexual behavior among men at risk for acquired immunodeficiency syndrome (AIDS). J Pers Soc Psychol 63: 460–473. PMID:1403625
41. Scheier MF, Carver CS, Bridges MW (1994) Distinguishing optimism from neuroticism (and trait anxi-ety, self-mastery, and self-esteem): a reevaluation of the Life Orientation Test. J Pers Soc Psychol 67: 1063–1078. PMID:7815302
42. Ryff CD, Singer B (2007) Reply: what to do about positive and negative items in studies of psychologi-cal well-being and ill-being? Psychother Psychosom 76: 61–62.
43. Segerstrom SC, Evans DR, Eisenlohr-Moul TA (2011) Optimism and pessimism dimensions in the life orientation test-revised: method and meaning. J Res Pers: 126–129.
44. Pavot W, Diener E (2008) The Satisfaction With Life Scale and the emerging construct of life satisfac-tion. The Journal of Positive Psychology 3: 137–152.
45. Fleeson W (2004) The quality of American life at the end of the century. In: Brim OG, Ryff CD, Kessler RC, editors. How healthy are we?: A national study of well-being at midlife. Chicago, IL US: University of Chicago Press. pp. 252–272.
46. Prenda KM, Lachman ME (2001) Planning for the future: a life management strategy for increasing con-trol and life satisfaction in adulthood. Psychol Aging 16: 206–216. PMID:11405309
47. Mroczek DK, Kolarz CM (1998) The effect of age on positive and negative affect: a developmental per-spective on happiness. J Pers Soc Psychol 75: 1333–1349. PMID:9866191
48. Watson D, Clark LA, Tellegen A (1988) Development and validation of brief measures of positive and negative affect: the PANAS scales. J Pers Soc Psychol 54: 1063–1070. PMID:3397865
49. Patrick CJ, Curtin JJ, Tellegen A (2002) Development and validation of a brief form of the Multidimen-sional Personality Questionnaire. Psychol Assess 14: 150–163. PMID:12056077
50. Tellegen A (1985) Structures of mood and personality and their relevance to assessing anxiety, with an emphasis on self-report. In: Tuma AH, Maser JD, editors. Anxiety and the anxiety disorders. Hillsdale, NJ England: Lawrence Erlbaum Associates, Inc. pp. 681–706.
51. Rosenthal R, Rosnow RL, Rubin DB (2000) Contrasts and effect sizes in behavioral research: a corre-lational approach. Cambridge, United Kingdom: Cambridge University Press. PMID:17292698 52. Daraei M, Ghaderi AR (2012) Impact of education on optimism/pessimism. Journal of the Indian
Acade-my of Applied Psychology 38: 339–343.
53. Ek E, Remes J, Sovio U (2004) Social and developmental predictors of optimism from infancy to early adulthood. Soc Indic Res 69: 219–242.
54. Segerstrom SC (2007) Optimism and resources: effects on each other and on health over 10 years. J Res Pers 41: 772–786.
55. Lucas RE, Schimmack U (2009) Income and well-being: how big is the gap between the rich and the poor? J Res Pers 43: 75–78.
56. Diener E, Kahneman D, Tov W, Arorad R (2010) Income’s association with judgments of life versus feelings. In: Diener E, Helliwell JF, Kahneman D, editors. International differences in well-being. New York, NY US: Oxford University Press. pp. 3–15.
57. Marshall G, Firth D (1999) Social mobility and personal satisfaction: evidence from ten countries. Br J Sociol 50: 28–48. PMID:15266673
58. Roberts BW, Kuncel NR, Shiner R, Caspi A, Goldberg LR (2007) The power of personality: the compar-ative validity of personality traits, socioeconomic status, and cognitive ability for predicting important life outcomes. Perspectives on Psychological Science 2: 313–345.
59. Friedman HS, Booth-Kewley S (1987) The‘disease-prone personality’: a meta-analytic view of the con-struct. Am Psychol 42: 539–555. PMID:3619180
61. Gallagher MW, Lopez SJ, Pressman SD (2012) Optimism is universal: exploring the presence and ben-efits of optimism in a representative sample of the world. J Pers. doi:10.1111/j.1467-6494.2012.00789. xPMID:22433002
62. Fischer R, Chalmers A (2008) Is optimism universal? a meta-analytical investigation of optimism levels across 22 nations. Pers Individ Dif 45: 378–382.
63. Heraclides A, Brunner E (2010) Social mobility and social accumulation across the life course in relation to adult overweight and obesity: the Whitehall II study. J Epidemiol Community Health 64: 714–719. doi:10.1136/jech.2009.087692PMID:19737739
64. Scharoun-Lee M, Gordon-Larsen P, Adair LS, Popkin BM, Kaufman JS, et al. (2011) Intergenerational profiles of socioeconomic (dis)advantage and obesity during the transition to adulthood. Demography 48: 625–651. doi:10.1007/s13524-011-0024-5PMID:21491185
65. Achat H, Kawachi I, Spiro A III, DeMolles DA, Sparrow D (2000) Optimism and depression as predictors of physical and mental health functioning: the Normative Aging Study. Ann Behav Med 22: 127–130. PMID:10962705