Fisioter. Mov., Curitiba, v.30, Suppl 1, 2017 Licenciado sob uma Licença Creative Commons DOI: http://dx.doi.org/10.1590/1980-5918.030.S01.AO16
Prevalence of obesity, sarcopenic obesity and
associated factors: A FIBRA Network study
Prevalência da obesidade, obesidade sarcopênica e
fatores associados: um estudo da Rede FIBRA
Carla Moura Santos [a], João Marcos Domingues Dias[a], Giane Amorim Ribeiro Samora[a], Mônica Rodrigues Perracini[b], Ricardo Oliveira Guerra[c], Rosângela Correa Dias[a]*
[a] Universidade Federal de Minas Gerais (UFMG), Belo Horizonte, MG, Brazil [b] Universidade Cidade de São Paulo (UNICID), São Paulo, SP, Brazil
[c] Universidade Federal do Rio Grande do Norte (UFRN), Natal, RN, Brazil
Abstract
Introduction: Sarcopenic obesity in older adults may lead to an inability to use muscles efficiently and has been associated with functional deficits and disabilities. Objective: To identify the prevalence of obesity and sarco
-penic obesity (SO) among community-dwelling older adults, and to characterize associated sociodemographics, health conditions and functional performance. Methods: Study data are from the FIBRA Network database of the Federal University of Minas Gerais. There were 1,373 older adult participants, subdivided into three groups: 1) non-obese; 2) non-sarcopenic obese; and 3) sarcopenic obese (SO). The latter is defined as a BMI ≥30 kg/m2 and weak palmar grip strength (PGS). Results: The overall prevalence of obesity and SO among older adults was 25.85% and 4.44%, respectively, with levels of frailty and pre-frailty among at 36.1% and 59%, respectively. Gait speed (GS) was lower in the SO group as well, compared to the other groups. An average increase in GS of 0.1 m/ sec reduced the likelihood of SO by 85.1%, in average. Sarcopenic obese older adults were 14.2 times more likely
* CMS: MS, e-mail: carlamspr@gmail.com JMDD: PhD, e-mail: jmdd@ufmg.br
GARS: PhD, e-mail: gribeirosamora@gmail.com MRP: PhD, e-mail: monica.perracini@unicid.edu.br ROG: PhD, e-mail: roguerra@ufrnet.br
162
to be pre-fragile and 112.9 times more likely to be fragile than the other groups. Conclusion: The prevalence of obesity found in this study was higher than that in the general population, but similar to national statistics for the sample’s mean age and gender. SO was directly associated with frailty in advanced and instrumental activi
-ties of daily living as well as gait speed and significantly increased the likelihood of being pre-frail and frail. GS may be an extremely useful tool for monitoring the progress of SO in older adults.
Keywords: Elderly. Obesity. Sarcopenia. Sarcopenic Obesity. Frailty.
Resumo
Introdução: A obesidade sarcopênica é uma condição de saúde que em idosos, pode resultar na incapacidade
de utilizar os músculos de forma eficiente e tem sido associada a déficits funcionais e incapacidades. Objetivo:
Identificar a prevalência da obesidade e obesidade sarcopênica (OS) e os fatores sociodemográficos, condições de saúde e medidas de desempenho funcional, associadas à OS em idosos comunitários. Métodos: Recorte do
banco de dados do polo UFMG da Rede FIBRA. Participaram do estudo 1373 idosos divididos em três grupos 1) Não obesos; 2) Obesos não sarcopênicos; 3) Obesos sarcopênicos. OS foi definida por IMC ≥30 kg/m2 e baixa
força de preensão palmar (FPP). Resultados: A prevalência de obesidade foi 25,85% e de OS foi 4,44%. Entre os
obesos sarcopênicos a prevalência de fragilidade foi 36,1% e 59% de pré-frágilidade. A velocidade de marcha (VM) no grupo obeso sarcopênico, foi menor quando comparada aos outros grupos. Um aumento médio de 0,1m/seg na VM reduziu em média 85,1% a chance de se ter OS na amostra. Ser obeso sarcopênico aumentou em 14,2 vezes a chance de ser pré-frágil e 112,9 vezes a chance de ser frágil. Conclusão: A prevalência de
obesidade foi maior que as taxas gerais, porém semelhante aos dados nacionais para a média de idade e sexo da amostra. OS se associou ao perfil de fragilidade, às atividades instrumentais e avançadas de vida diária e à velocidade de marcha. OS aumentou expressivamente a chance de o idoso ser pré-frágil e frágil e a VM pode ser uma ferramenta útil de acompanhamento da progressão da OS.
Palavras-Chave: Idoso. Obesidade. Sarcopenia. Obesidade Sarcopênica. Fragilidade.
Introduction
Aging is accompanied by changes in both physiology and body composition, with redistribution of muscle and adipose tissue (1, 2). There is a gradual loss of muscle mass - called sarcopenia - with an increase in the amount of body fat (3).
The loss of lean body mass decreases the basal energy expenditure and can be associated with or aggravated by hormonal changes, reduced physical activity, comorbidities and dietary changes, contributing to an increase in adipose tissue (1 – 4), which tends to accumulate in the abdominal region. This phenomenon may be correlated to chronic subclinical inflammation, which in turn aggravates sarcopenia (3, 5, 6).
Adipose cells also infiltrate muscle tissue, with reduced contraction efficiency and muscle capacity for strength. This may contribute to a decrease in
physical activity levels and, consequently, lead to greater neuromuscular dysfunction (7).
Thus, sarcopenic obesity (SO) is characterized by excess body fat and reduced muscle mass and strength (6), although this can vary, depending on the methodological approaches (2). In international studies, SO ranges from 3% (8) to 12.5%9 and as high
as 21% (10) among females, while it ranges from 4.4% (8) to 5.1% (9) and 11.5% (10) among males. In national studies, its incidence among females is approximately 20% (11, 12).
SO may lead to an inability to use muscles efficiently (2, 6, 13) and may cause more damages than when obesity and sarcopenia occur separately (2, 6). It has been associated with functional deficits and disabilities (14, 15) and we also assume that health conditions, lifestyle and functional status can influence or be impacted by SO.
163 on this chronic condition is important; this would
facilitate the identification of individuals at higher risk for disabilities and future interventions. This study aimed to: a) assess the prevalence of obesity and SO among community-dwelling older adults; b) analyze the relationship between obesity, SO, and sociodemographics, health conditions, and functional performance of older adults.
Methods
This study was approved by the Research Ethics Committee of the Federal University of Minas Gerais and drew on data from the FIBRA Network (Study network on frailty in older adults) database of the Federal University of Minas Gerais. The FIBRA Network is an epidemiological, cross-sectional and multicenter study whose goal is to investigate the profile and prevalence of frailty syndrome in community-dwelling Brazilian older adults. The network is composed of four centers, one of which is located at the UFMG (Federal University of Minas Gerais). It encompasses three cities (Barueri, São Paulo; Belo Horizonte, Minas Gerais; and Santa Cruz, Rio Grande do Norte) and a total of 1,373 older adults.
The study sample was selected using randomized sampling, by means of “area clusters”. First, we defined the sample size for each city. Next, we calculated the number of census tracts and streets to be selected, based on data provided by the Brazilian Institute of Geography and Statistics (IBGE) (16). The researchers visited all households in the randomly selected streets. In order not to underestimate the number of older adults, when more than one older adult was present in a household, the researcher invited all older adults to participate in the study.
The study included adults of both sexes aged 65 years or older, who lived in randomized census tracts. All study volunteers signed an informed consent form (ICF). Exclusion criteria were having cognitive impairment (as defined by a Mini-Mental State Exam [MMSE] (17) score of less than 17 points), severe Parkinson’s disease or severe stroke sequelae, requiring wheelchair use or being bedridden.
The FIBRA Network questionnaire was administered by previously trained interviewers. Data were collected using questionnaires, functional assessment tools and physical measures.
Sarcopenic obesity was assessed using body mass index (BMI) ≥ 30 kg/m2 and palmar grip strength
scores below the 20th percentile of the sample (cut-off points adjusted for gender and BMI). The mean of three measurements using a Saehan hand dynamometer (18) (Saehan Corporation, 973, Yangdeok-Dong, Masan 630-728, Korea) was used for analysis.
BMI was calculated as weight divided by height squared in kg/m2. Anthropometric measurements
(weight and height) were taken using standardized methods (tape measure and scale).
The study variables were divided into four groups: 1) Sociodemographic variables: gender, age, city,
years of schooling, marital status (married or living with a partner, single, divorced/ separated or widowed).
2) Health condition-related variables: Number of medications used, number of self-reported diseases diagnosed by a doctor, total hospitalization time in the previous year and reports of falls in the preceding 12 months. 3) Variables related to functional performance:
a) Instrumental Activities of Daily Living (IADL), as assessed by Lawton’s original scale (19). The validation of the scale for use in Brazil had not yet been published when the FIBRA Network study was conducted. Lawton’s scale included items such as ability to use the telephone, mode of transportation, shopping, food preparation, household tasks, responsibility for medications and ability to manage finances. Scale scores range from 3 (completely dependent) to 21 points (independent); b) Advanced Activities of Daily Living (AADL), based on the Berlin Aging Study
164
in the middle 4.6 meters to allow 2 meters for acceleration and 2 meters for deceleration). 4) Frailty: Frailty was operationalized using
Fried frailty criteria (21), according to the following items: 1) ≥ 4.5 kg or ≥ 5% weight loss in the preceding year; 2) Exhaustion, as assessed by two questions from the Center Epidemiological Scale - Depression (CES-D) (22). The criterion was considered positive if at least one of the questions was answered as “most of the times" or "always"; 3) Level of physical activity, as assessed by the Minnesota
Leisure Time Activity Questionnaire (23), which estimates weekly energy expenditures in kilocalories (Kcal), adjusted for gender, with cut-off point set as the 20th percentile of the sample (participants who scored below the 20th percentile were marked positive for this criterion); 4) Reduced muscle strength: reduced grip strength as measured with a Saehan manual hydraulic dynamometer. Participants whose mean of three grip strength measurements was below the 20th percentile
of the sample (adjusted for gender and BMI) were marked positive for this criterion; 5) Gait slowness: assessed as the time required to walk 8.6 meters (time measured in the middle 4.6 meters to allow 2 meters for acceleration and 2 meters for deceleration). Participants were marked positive for this criterion when the mean of three measurements was the 20 percent highest time scores (in seconds) for the sample distribution. The cut-off points were adjusted for gender and height.
Participants were considered frail when they met three or more criteria, pre-frail when they met one or two criteria, and not frail when they met none of the criteria.
Variables were analyzed according to the distribution of the sample into three groups:
1) The non-obese group, defined as BMI < 30kg/m2.
2) The non-sarcopenic obese group, defined as BMI ≥ 30kg/m2 and grip strength above the
20th percentile of the sample (≥ 14.0 Kgf for women and ≥ 24.6 Kgf for men.
3) The sarcopenic obese, defined as BMI ≥ 30kg/m2
and grip strength below the 20th percentile of the sample (< 14.0 Kgf for women and < 24.6 Kgf for men).
The data were checked for normality using a Kolmogorov-Smirnov test. Descriptive statistics was used to obtain central tendency (mean or median) and dispersion measures (standard deviation or interquartile range) for quantitative variables; absolute (n) and relative (%) frequency were used for categorical variables.
A one-way ANOVA with the Bonferroni post hoc test was used to assess between-group differences in gait speed (m/s).
A biserial correlation coefficient (24) (rb) was used to assess associations between sarcopenic obesity and continuous variables, while a chi-square test (χ2) was used to assess associations between
sarcopenic obesity and qualitative variables.
Multivariate logistic regression models were used to identify associations between: 1) functional performance variables (gait speed, AADL and IADL) and sarcopenic obesity; 2) frailty classification (frail and pre-frail) and sarcopenic obesity. The choice of variables for inclusion in the model was based on theoretical considerations. Only those with a p-value < 0.10 in the bivariate analysis were used for regression adjustment, by using the forward procedure (likelihood ratio). The goodness of fit of the models was assessed using the Hosmer-Lemeshow test and residual analysis. Strength of association between each independent variable and sarcopenic obesity was expressed as odds ratios (OR), with 95% confidence interval (95% CI). The level of significance was set at α = 5%
The data were analyzed using Statistical Package for the Social Sciences - SPSS (version 15.0).
Results
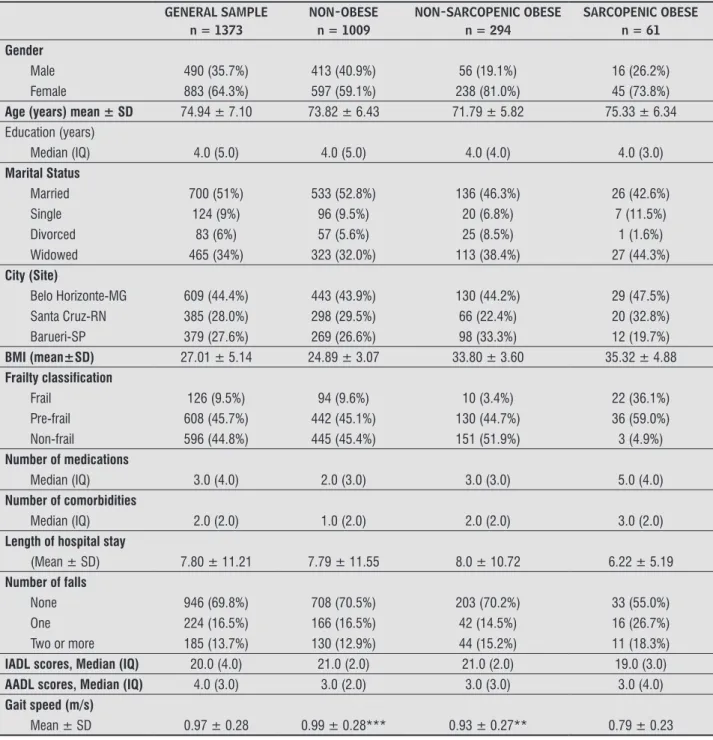
Table 1 shows the characteristics of the sample of 1,373 older adults (mainly women). Seventy-three point five percent (n = 1,009) of participants were considered obese, 21.4% (n = 294) were considered non-sarcopenic obese and 4.5% (n = 61) were considered sarcopenic obese. The overall prevalence of obesity in the sample was 26% (n = 355). Seventeen percent of obese participants were considered sarcopenic.
165 except for gait speed (p < 0.001). There was a greater
proportion of frailty and pre-frailty among sarcopenic obese older adults.
Obesity prevalence was proportionally highest in the city of Barueri (25.9% of the 379 older adults interviewed in the city were obese), followed by Belo
Horizonte (21.3% of 609 older adults) and Santa Cruz (17.1% of 385 older adults). As for sarcopenic obesity, Santa Cruz had the highest prevalence of sarcopenic obese older adults (5.2% of 385 participants), followed by Belo Horizonte (4.7% of 609 interviewees) and Barueri (3.2% of 379 participants).
Table 1 - Sociodemographics, health conditions and functional performance of the sample
GENERAL SAMPLE n = 1373
NON-OBESE n = 1009
NON-SARCOPENIC OBESE n = 294
SARCOPENIC OBESE n = 61 Gender
Male 490 (35.7%) 413 (40.9%) 56 (19.1%) 16 (26.2%)
Female 883 (64.3%) 597 (59.1%) 238 (81.0%) 45 (73.8%)
Age (years) mean ± SD 74.94 ± 7.10 73.82 ± 6.43 71.79 ± 5.82 75.33 ± 6.34 Education (years)
Median (IQ) 4.0 (5.0) 4.0 (5.0) 4.0 (4.0) 4.0 (3.0)
Marital Status
Married 700 (51%) 533 (52.8%) 136 (46.3%) 26 (42.6%)
Single 124 (9%) 96 (9.5%) 20 (6.8%) 7 (11.5%)
Divorced 83 (6%) 57 (5.6%) 25 (8.5%) 1 (1.6%)
Widowed 465 (34%) 323 (32.0%) 113 (38.4%) 27 (44.3%)
City (Site)
Belo Horizonte-MG 609 (44.4%) 443 (43.9%) 130 (44.2%) 29 (47.5%)
Santa Cruz-RN 385 (28.0%) 298 (29.5%) 66 (22.4%) 20 (32.8%)
Barueri-SP 379 (27.6%) 269 (26.6%) 98 (33.3%) 12 (19.7%)
BMI (mean±SD) 27.01 ± 5.14 24.89 ± 3.07 33.80 ± 3.60 35.32 ± 4.88
Frailty classification
Frail 126 (9.5%) 94 (9.6%) 10 (3.4%) 22 (36.1%)
Pre-frail 608 (45.7%) 442 (45.1%) 130 (44.7%) 36 (59.0%)
Non-frail 596 (44.8%) 445 (45.4%) 151 (51.9%) 3 (4.9%)
Number of medications
Median (IQ) 3.0 (4.0) 2.0 (3.0) 3.0 (3.0) 5.0 (4.0)
Number of comorbidities
Median (IQ) 2.0 (2.0) 1.0 (2.0) 2.0 (2.0) 3.0 (2.0)
Length of hospital stay
(Mean ± SD) 7.80 ± 11.21 7.79 ± 11.55 8.0 ± 10.72 6.22 ± 5.19
Number of falls
None 946 (69.8%) 708 (70.5%) 203 (70.2%) 33 (55.0%)
One 224 (16.5%) 166 (16.5%) 42 (14.5%) 16 (26.7%)
Two or more 185 (13.7%) 130 (12.9%) 44 (15.2%) 11 (18.3%)
IADL scores, Median (IQ) 20.0 (4.0) 21.0 (2.0) 21.0 (2.0) 19.0 (3.0)
AADL scores, Median (IQ) 4.0 (3.0) 3.0 (2.0) 3.0 (3.0) 3.0 (4.0)
Gait speed (m/s)
Mean ± SD 0.97 ± 0.28 0.99 ± 0.28*** 0.93 ± 0.27** 0.79 ± 0.23
Note: Abbreviations: SD = Standard Deviation. IQ = Interquartile range. BMI = Body Mass Index. IADL: Instrumental Activities of Daily Living AADL= Advanced Activities of Daily Living.
166
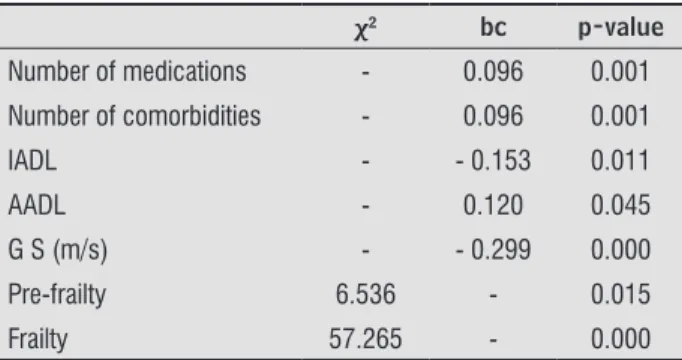
Table 2 shows statistically significant associations between frailty, clinical variables, functional performance (IADL, AADL and gait speed) and sarcopenic obesity.
Table 2 - Association between frailty profiles, variables
related to health conditions and functional perfor-mance, and sarcopenic obesity
χ2 bc p-value
Number of medications - 0.096 0.001
Number of comorbidities - 0.096 0.001
IADL - - 0.153 0.011
AADL - 0.120 0.045
G S (m/s) - - 0.299 0.000
Pre-frailty 6.536 - 0.015
Frailty 57.265 - 0.000
Note: IADL= Instrumental Activities of Daily Living; AADL= Ad-vanced Activities of Daily Living; GS = Gait Speed; χ² = statistical chi-square value; bc = biserial correlation.
Only gait speed was found to significantly predict sarcopenic obesity in older adults (β = -1.906; p < 0.0001; OR = 0.149; 95% CI: 0.051 to 0.434). Thus, an average increase in GS of 0.1 m/sec reduced the likelihood of SO by 85.1%, in average. In the study sample (sarcopenic and non-sarcopenic obese older adults), gait speed varied from 0.14 m/s to 1.67 m/s.
Moreover, the association between sarcopenic obesity and frailty showed that sarcopenic obese older adults were 14.2 times more likely to be pre-fragile (β = 2.65; p < 0.0001; OR=14.21; 95% CI: 4.28 - 47.23) and 112.9 times more likely to be fragile (β = 4.73; p < 0.0001; OR = 112.93; 95% CI: 28.83-442.37) than their counterparts.
Discussion
The findings of this study showed that obesity is a prevalent condition among older adults. The study sample had an obesity rate of 26%, which is higher than the national average for older persons. The national rate is 17.9% for older adults aged 65-74 years and 15.8% for people aged 75 years and older (25). However, if we consider that the mean age of the total sample was 74.94 ± 7.10 years and that there was a predominance of the female gender (64.3%), the obesity rate found
is consistent with that of the female Brazilian population (22.4%) (25).
When compared to the other two cities, the greatest proportion of sarcopenic obese older adults was found in Santa Cruz, RN. However, the former had a greater number of non-sarcopenic obese older adults. This may be due to the fact that Santa Cruz is located in the interior, northeastern part of Brazil, has more disadvantaged social and economic conditions, and lower Human Development Index (HDI) scores, when compared to the other two cities. There is evidence that inhabitants from areas with low social coverage and those exposed to urban violence, lack of hygiene, family breakdown, lack of health services, among others, also have the worst health indicators (26).
The concept of “allostatic load” may be defined as the physical and emotional wear and tear resulting from experiencing stressful events throughout life. It encompasses social, economic, psychological and historical aspects. A greater allostatic load may lead to a higher risk of getting ill, because long-term exposure to stress mediators may result in pathological processes such as abdominal obesity and loss of muscle mass (27).
It is known that the prevalence of sarcopenic obesity varies according to the approach used and the population studied (2). International studies have reported SO ranging from 3% (8) to 12%(9) and
as high as 21% (10) among women. These studies used Dual Energy X Ray Absormetry (DXA). In the first study (8), SO was considered present if skeletal muscle mass values were at least two standard deviations lower than the normal mean for the young and percentage of body fat was above 27% in men and 38% in women. In the second study (9), SO was considered present if skeletal muscle mass values were at least two standard deviations lower than the normal mean for the young and people were in the highest quintile of total body fat. The third study (10) used a regression model to calculate muscle mass in relation to height and fat mass.
167 The use of DXA to assess body composition may bring
higher reliability, because the DXA is able to distinguish fat, bone mass and lean body mass. Nevertheless, the clinical applicability of DXA is restricted and its use in epidemiological studies may be impractical due to cost and displacement limits (28).
In contrast, the SO prevalence found in this study is in agreement with epidemiological studies that used criteria such as obesity and low palmar grip strength. These studies found prevalence rates ranging from 4% to 9 % (2).
This study used PGS as a tool to assess sarcopenic obesity. The European Consensus on sarcopenia recommends the use of PGS measurements as part of a diagnosis algorithm (28) that also includes gait speed and muscle mass. However, the need for muscle mass measurement makes the large scale use of the algorithm difficult. It is worth remembering that sarcopenia diagnosis based on strength rather than on muscle mass may be more clinically and functionally significant for the identification of those older people that are most affected by it (2, 28). This is because muscle strength does not solely depend on muscle mass. In addition, the relationship between muscle mass and muscle strength is not linear (2). Therefore, this measure may become useful in clinical practice because of its greater accessibility and lower cost.
Moreover, low PGS is one of the items that compose the phenotype of frailty, a condition associated with dependency, institutionalization, morbidity and mortality among older adults.(21) The findings of
this study show that frailty is a prevalent condition among the older adults included in the sample and that it is more prevalent among older adults who are classified as sarcopenic obese. Frailty and pre-frailty were associated with SO and SO was found to play a role in the significant increase of the likelihood of becoming frail or pre-frail. This may be linked to the fact that sarcopenia is directly associated with skeletal muscle performance and thus may influence other criteria of the frailty syndrome (29).
This study found associations between SO and IADL and AALD. The relationship between IADL and SO is evidenced in a Chinese study (30) conducted with older adults. Participants who were obese and had reduced strength were found to be at higher risk for deficits in AALD and IADL than participants who were only obese or only had reduced strength. A longitudinal
study conducted in America (14) found that sarcopenic obese individuals at baseline were three times more likely to report difficulties in IADL during follow-up than their counterparts.
Only gait speed was found to significantly predict sarcopenic obesity in older adults. The study showed that increased gait speed significantly reduced the likelihood of being sarcopenic obese. Thus, according to this study, gait speed may be a useful tool for the follow-up of sarcopenic obesity in older adults.
The sarcopenic obese group had a significantly lower mean gait speed than the other two groups. These findings corroborate the European Consensus on sarcopenia, which recommeds the use of gait speed as one of the measures that compose the diagnosis algorithm and uses a cut-off value of ≤ 0.8m/s as indicative of sarcopenia (28).
Although using different walking distances (20 feet, 20 m and 4 m) and different methods for the classification of SO (highest tertiale of fat mass as measured by DXA and low strength of knee extensors; low PGS and BMI > 25Kg/m2; and low strength of
knee extensors and BMI ≥ 30Kg/m2), other studies
have also found similar results, with the sarcopenic obese group showing lower mean gait speed than the other groups (15, 31, 32).
Despite its advantages, such as being a population study with community-dwelling, ethnically diverse older adults of both sexes aged 65 years or older, this study has some limitations. First, data on the nutritional intake and (particularly) body composition, including the relationship between muscle and fat mass, were not collected. Second, although this is a probabilistic sample that includes cities from two different Brazilian regions, the external validity of the study is limited due to the great regional, cultural and socioeconomic diversity of the country.
168
Conclusion
The findings of this study show a higher prevalence of obesity than the national average for older adults. However, this study found a similar prevalence for the same age group and gender of the sample. Our findings also show similar prevalence rates to those observed in other studies that used the same definition of SO.
Given the findings of this study, which showed an association between sarcopenic obesity and frailty among Brazilian older adults, and the fact that SO has been associated with functional deficits and disabilities, it becomes clinically important to identify affected individuals and establish appropriate interventions.
This study also showed that GS may be an extremely useful tool for monitoring the progress of SO in older adults, as increased gait speed significantly reduced the likelihood of being sarcopenic obese.
References
1. Villareal DT, Apolivan CM, Kusshner RF, Kleins S. Obesity in older adults: technical review and position statement of the American Society for Nutrition and NAASO, The Obesity Society. Am J Clin Nutr. 2005;82(5):923-34.
2. Stenholm S, Harris TB, Hantanen T, Visser M, Kritchevsky SB, Ferrucci L. Sarcopenic obesity: definition, cause and consequences. Curr Opin Clin Nutri Metab Care. 2008;11(6): 693-700.
3. Jarosz PA, Bellar A. Sarcopenic Obesity: an emerging cause of frailty in older adults. Ger Nurs. 2008;30(1):64-70.
4. Bouchounville MF, Villareal DT. Sarcopenic obesity: how do we treat it? Curr Opin Endocrinol Diabetes Obes. 2013;20(5):412-9.
5. Cesari M, Kristchevsky SB, Baumgartner R, Atkinson HH, Penninx BWHJ, Lenchik L, et al. Sarcopenia, obesity, and inflammation-results from the trial of Angiotensin Converting Enzyme Inhibition and Novel Cardiovascular Risk Factors study. Am J Clin Nutr. 2005;82(2):428-34.
6. Zamboni M, Mazzali G, Fantin F, Rossi A, Di Francesco V. Sarcopenic obesity: a new category of obesity in the elderly. Nutr Metab Cardiovasc Dis. 2008;18(5):388-95.
7. Doherty T. Invited Review: Aging and sarcopenia. J Appl Physiol (1985). 2003;95(4):1717-27.
8. Baumgartner RN. Body composition in healthy aging. Ann N Y Acad Sci. 2000;904:437-48.
9. Kim TN, Yang SJ, Yoo HJ, Lim KI, Kang HJ, Song W, et al. Prevalence of sarcopenia and sarcopenic obesity in Korean adults: the Korean sarcopenic obesity study. Int J Obes (Lond). 2009;33(8):885-92.
10. Newman AB, Kupelian V, Visser M, Simonsick E, Goodpaster B, Nevitt M, et al. Sarcopenia: Alternative definitions and associations with lower extremity function. J Am J Am Geriatr Soc. 2003;51(11):1602-9.
11. Silva Neto LS, Karnikowiski MGO, Tavares AB, Lima RM. Associação entre sarcopenia, obesidade sarcopênica e força muscular com variáveis relacionadas de qualidade de vida em idosas. Rev Bras Fisioter. 2012;16(5):360-7.
12. Oliveira RJ, Bottaro M, Júnior JT, Farinatti PTV, Bezerra LA, Lima RM. Identification of sarcopenic obesity in postmenopausal women: a cutoff proposal. Braz J Med Biol Res. 2011;44(11):1171-6.
13. Vasconcelos KSS. Exercícios resistidos para idosas com obesidade sarcopênica: Um ensaio clínico aleatorizado [dissertation]. Belo Horizonte: Universidade Federal de Minas Gerais; 2013.
14. Baumgartner RN, Wayne SJ, Waters DL, Jassen I, Gallagher D, Morley JE. Sarcopenic Obesity Predicts Instrumental Activities of Daily Living Disability in the Elderly. Obes Res. 2004;12(12):1995-2004.
15. Bouchard D, Janssen I. Dynapenic-obesity and physical function in older adults. J Gerontol A Biol Sci Med Sci. 2010;65(1):71-7.
169 17. Bruck SMD, Nitrini R, Caramelli P, Bertolucci PHF,
Okamoto IH. Sugestões para o uso do Mini-Exame do Estado Mental no Brasil. Arq Neuro-Psiquiatr. 2003;61(3B):777-81.
18. Reis MM, Arantes PMM. Medida da força de preensão manual – validade e confiabilidade do dinamômetro Saehan. Fisioter Pesqui. 2011;18(2):176-81.
19. Lawton MP, Brody EM. Assessment of older people:
self-maintaining and instrumental activities of daily
living. Gerontologist. Gerontologist. 1969;9(3):179-86. 20. Reuben DB, Laliberte L, Hiris J, Mor V. A hierarchical
exercise scale to measure function at the Advanced Activities of Daily Living (AADL) level. J Am Geriatr Soc. 1990; 38(8): 855-61.
21. Fried LP, Tangen CM, Walson J, Newman AB, Hirsch C, Gottdiener J. Frailty in older adults: evidence for a phenotype. J Gerontol A Biol Sci Med Sci. 2001;56(3):M146-56.
22. Batistoni SST, Neri AL, Cupertino APFB. Validade da
escala de depressão do Center for Epidemiological
Studies entre idosos brasileiros. Rev Saude Publica. 2007;41(4):598-605.
23. Lustosa LP, Pereira DS, Dias RC, Britto RR, Parentoni AN, Pereira LSM. Tradução e adaptação transcultural
do Minnesota Leisure Time Activities Questionnaire em
idosos. Geriatr Gerontol. 2011;5(2):57-65.
24. Lira AS, Chaves Neto A. Coeficientes de correlação para variáveis ordinais e dicotômicas derivados do coeficiente linear de Pearson. Cienc Eng. 2006;15(1/2):45-53.
25. Instituto Brasileiro de Geografia e Estatística – IBGE. Pesquisa de Orçamentos Familiares - POF 2008-2009. Antropometria e estado nutricional de crianças, adolescentes e adultos no Brasil. 2010 [cited 2016 May 20]. Available from: https://tinyurl.com/yd2ahxu7.
26. Maciel ACC, Guerra RO. Influência dos fatores
biopsicossociais sobre a capacidade funcional de
idosos residentes no nordeste do Brasil. Rev Bras Epidemiol. 2007;10(2):178-89.
27. Carvalho SR. A carga alostática: uma revisão. Cad Saude Colet (Rio J). 2007;15(2):257-74.
28. Cruz-Jentoft AJ, Baeyens JP, Bauer JM, Boirie Y, Cederholm T, Landi F, et al. Sarcopenia: European consensus on definition and diagnosis: Report of the European Working Group on Sarcopenia in Older People. Age Ageing. 2010;39(4):412-23.
29. Silva TAA, F Jr A, Pinheiro MM, Szejnfeld VL. Sarcopenia associada ao envelhecimento: Aspectos etiológicos e opções terapêuticas. Rev Bras Reumatol. 2006;46(6):391-7.
30. Yang M, Ding X, Luo L, Hao Q, Dong B. Disability associated with obesity, dynapenia and dynapenic-obesity in chinese older adults. J Am Med Dir Assoc. 2014;15(2):150.e11-6.
31. Yang M, Jiang J, Hao Q, Luo L, Dong B. Dynapenic Obesity and Lower Extremity Function in Elderly Adults. J Am Med Dir Assoc. 2015;16(1):31-6. 32. Stenholm S, Alley D, Bandinelli S, Griswold ME,
Koskinen S, Rantanen T, et al. The effect of obesity combined with low muscle strength on decline in mobility in older persons: results from the InCHIANTI Study. Int J Obes (Lond). 2009;33(6):635-44.
Received on 05/25/2016 Recebido em 25/05/2016
Approved on 05/16/2017