www.clim-past.net/9/307/2013/ doi:10.5194/cp-9-307-2013
© Author(s) 2013. CC Attribution 3.0 License.
Climate
of the Past
Geoscientiic
Geoscientiic
Geoscientiic
Geoscientiic
The Medieval Climate Anomaly and the
Little Ice Age in the eastern Ecuadorian Andes
M.-P. Ledru1, V. Jomelli2, P. Samaniego3, M. Vuille4, S. Hidalgo5, M. Herrera6, and C. Ceron6
1IRD UMR 226 Institut des Sciences de l’Evolution de Montpellier (ISEM) UM2 CNRS IRD Place Eug`ene Bataillon cc 061,
34095 Montpellier cedex, France
2CNRS Universit´e Paris 1, Laboratoire de G´eographie 92195 Meudon, France
3IRD UMR 163 Universit´e Blaise Pascal, CNRS, IRD, Laboratoire Magmas et Volcans, 5 rue Kessler,
63038 Clermont-Ferrand, France
4Department of Atmospheric and Environmental Sciences, University at Albany, State University of New York, Albany,
NY 12222, USA
5Instituto Geof´ısico, Escuela Polit´ecnica Nacional, A. P. 17-2759, Quito, Ecuador 6Dpto Botanica, Universidad Centrale del Ecuador (UCE), Quito, Ecuador
Correspondence to:M.-P. Ledru ([email protected])
Received: 27 July 2012 – Published in Clim. Past Discuss.: 6 September 2012 Revised: 5 January 2013 – Accepted: 9 January 2013 – Published: 5 February 2013
Abstract.To better characterize the climate variability of the last millennium in the high Andes, we analyzed the pollen content of a 1150-yr-old sediment core collected in a bog lo-cated at 3800 m a.s.l. in the p´aramo in the eastern Cordillera in Ecuador. An upslope convective index based on the ra-tio between cloud transported pollen from the Andean for-est to the bog (T) and Poaceae pollen frequencies, related to the edaphic moisture of the p´aramo (P), was defined. This index was used to distinguish changes in the atmospheric moisture from the soil moisture content of the p´aramo and their associated patterns of interdecadal El Ni˜no–Southern Oscillation (ENSO) variability and South American sum-mer monsoon (SASM) activity. Results show that between 850 and 1250 AD, the Medieval Climate Anomaly interval was warm and moist with a high transported pollen/Poaceae pollen (T/P) index linked to high ENSO variability and weak SASM activity. Between 1250 and 1550 AD, a dry climate prevailed, characterized by an abrupt decrease in the T/P in-dex and therefore no upslope cloud convection, related to lower ENSO variability and with significant impact on the floristic composition of the p´aramo. During the Little Ice Age, two phases were observed: first, a wet phase between 1550 and 1750 AD linked to low ENSO variability in the Pa-cific and warm south equatorial Atlantic sea surface temper-atures (SSTs) favored the return of a wet p´aramo, and then
a cold and dry phase between 1750 and 1800 AD associ-ated with low ENSO variability and weak SASM activity resulted in drying of the p´aramo. The current warm period marks the beginning of a climate characterized by high con-vective activity – the highest in the last millennium – and weaker SASM activity modifying the water storage of the p´aramo. Our results show that the p´aramo is progressively losing its capacity for water storage and that the interdecadal variability of both tropical Pacific and Atlantic SSTs matter for Andean climate patterns, although many teleconnection mechanisms are still poorly understood.
1 Introduction
The tropics are a major climate engine for the global water cycle. In the tropical Andes, climate variability is the result of complex interactions between two main ocean–atmosphere systems over the tropical Pacific and Atlantic Oceans and has submitted to strong fluctuations at interannual or decadal scales (Garreaud et al., 2009).
atmosphere and biosphere of the last decades in a general longer-term context of climate variability. The recent in-crease in high-resolution proxy records shows that at least two major perturbations in global climate occurred during the last millennium. The first one, known as the Medieval Climate Anomaly (MCA), is well recognized in both hemi-spheres – although with some differences in timing – be-tween 900 AD and 1250 or 1400 AD, depending on location (Mann et al., 2009; Diaz et al., 2011). The second one, the Little Ice Age (LIA), is characterized by global-scale glacier advance – again with differences in timing of the maximum glacier expansion depending on the exact location – as high-lighted for instance in the Andes, where a maximum advance was recorded around 1630–1680 AD in Bolivia and Peru and around 1730 AD in Ecuador, Colombia and Venezuela (Jomelli et al., 2009). In the southern hemisphere tropics, however, most of the records cover only a short time inter-val, which, combined with the lack of continuous records at interannual to decadal resolution, so far prevented the exam-ining of long-term climate variability (e.g., Neukom and Ger-gis, 2011). This problem is particulary acute in regions such as the tropical Andes where populations strongly depend on mountain water resources (Bradley et al., 2006).
In northern Ecuador, recent measurements on a glacier on the Antizana volcano established that El Ni˜no–Southern Os-cillation (ENSO) is the main driver of the interannual mass balance variations of this glacier (Francou et al., 2004). How-ever, to the north and south, in the Andes of Venezuela and the northeastern Peruvian foothills, past records suggest that tropical Atlantic SST anomalies and related South American summer monsoon (SASM) activity is the major factor driv-ing past changes in mean hydrologic conditions at these sites (Polissar et al., 2006; Reuter et al., 2009).
Past changes in ENSO variability have been reconstructed from lake deposits in southwestern Ecuador using spectral analysis performed on inorganic sediment laminae. Results show that ENSO periodicity was∼15 yr until 7000 cal yr BP and increased in frequency (2 to 8 yr) from 5000 cal yr until 1200 cal yr BP, after which time the periodicity progressively declined (Rodbell et al., 1999; Moy et al., 2002). Lacustrine and coral records from the equatorial Pacific suggest that the last millenium was dominated by La Ni˜na-like/El Ni˜no-like conditions with a cooler/warmer eastern equatorial Pacific and positive/negative radiative forcing during the MCA and LIA, respectively (Cobb et al., 2003; Conroy et al., 2009; Sachs et al., 2009). However, these records are restricted to fairly short time intervals, which makes a comparison with other regional records or long-term estimates of Pacific cli-mate rather difficult. In addition, the response of the neotrop-ical biosphere to changes in equatorial Pacific SST is still poorly understood.
On the continent, temperature reconstructions inferred from Andean glaciers provide evidence for LIA intervals that were much colder than today, which cannot easily be aligned with corresponding El Ni˜no-like climate conditions in the
tropical Pacific (Jomelli et al., 2009). Continuous terrestrial records over the last millennium are still rare in the Andes. In southern Peru, a pollen record confirmed the presence of a sustained drought between 900 AD and the early 17th cen-tury (Chepstow-Lusty et al., 2009) that allowed the Incas to expand their Andean territory due to their ability to use new drought-adapted agricultural practices up to high elevations (Kuentz et al., 2012). Recently, tree-ring climate reconstruc-tions of the last 700 yr from the central Andes also revealed a persistent drought from the 14th to the 16th century and a re-turn to wetter conditions at the beginning of the 17th century, which was then again followed by another long-term drought (Morales et al., 2012). ENSO variability was inferred to ex-plain these changes in moisture conditions on the Altiplano. Further north, in the central Peruvian Andes, an annually resolved lake record covering the past 2300 yr showed the strong impact of the SASM on regional moisture, with hu-mid conditions during the LIA and drought during the MCA and the CWP (Bird et al., 2011).
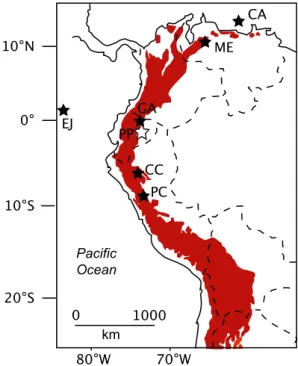
Here we present a high-resolution and continuous new pollen record that spans the last millennium. The Papallacta pollen record is located in northern Ecuador near the city of Papallacta in the eastern Cordillera (Fig. 1). Our aim is to explore the relative importance of two dominant forcing sys-tems and their variability in the past: the SASM, because at Papallacta the seasonality is associated with the northward march of convective activity during the demise phase of the SASM; and ENSO, since the interannual climate variability is primarily driven by ENSO in this part of the high Andes.
2 Modern settings, regional climate and vegetation
Along the Andean Cordillera, Ecuador is divided into two major hydrogeographic regions: the Pacific side, which com-prises 11 % of the hydrologic supply, and the Amazon side with 89 % of the hydrologic supply. The climate in Ecuador is influenced by both Pacific and Atlantic SST (Vuille et al., 2000) with a stronger Pacific influence on the western side of the Andes and an Atlantic influence on the eastern side, thanks to the easterly jet flow which transports moist air masses from the Atlantic to the Amazon Basin (Hasten-rath, 1996). However, ENSO-related changes in tropical Pa-cific SST also affect precipitation variability to the east of the Andes (Garreaud et al., 2009).
Pacific Ocean
0 1000
km
10°N
0°
10°S
20°S EJ
ME CA
CC
PC PP
GA
70°W 80°W
Fig. 1.Map of western South America showing the tropical Andes (in red) and the locations of records discussed in the text (EJ, lake of El Junco; CA, Cariaco Basin; ME, Andes of Merida; GA, bog of Guandera; PP, bog of Papallacta; CC, Cascayunga Cave, PC, lake of Pumacocha).
the northward migration convection is weakened. Interannual variability in precipitation has been related to ENSO. Indeed SST anomalies in the tropical Pacific Ocean play an impor-tant role in mediating the intensity of the SASM over the tropical Andes. El Ni˜no (La Ni˜na) episodes are associated with below (above) average rainfall and warmer (cooler) con-ditions than normal in the Amazon Basin (Marengo and No-bre, 2001; Marengo, 2009). However, as the western Ama-zon features the highest atmospheric moisture content of the whole basin (precipitation ranges between 3000 and 3700 mm yr−1) (Fig. 2), the plant evapotranspiration gradi-ent between the lowlands and the highlands (the glaciers are located at elevations above 5000 m a.s.l.) remains significant enough to allow for an active upslope cloud convection, even during a below-average rainfall year. Consequently, some re-gions of the eastern Cordillera are always wet because of a year-round cloud dripping.
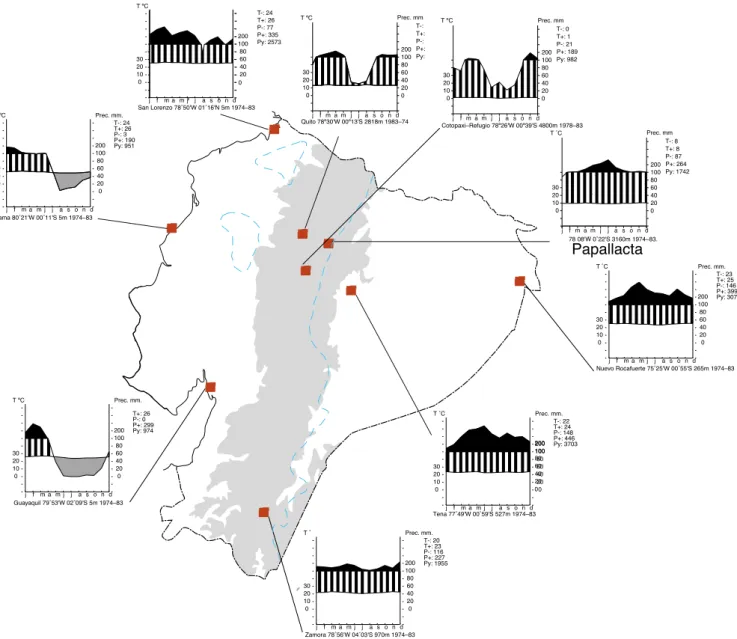
The region delimited by Ecuador is divided into several climatic and vegetation zones as a function of the dominant climate forcing systems at different elevations. Precipitation is influenced by the seasonal displacement of the ITCZ, mov-ing between its southernmost position near the equator and its northernmost position at 10◦N, causing a bimodal precip-itation seasonality in the Ecuadorian Andes. In the western lowlands the bimodal seasonality is strongly affected by the cold Humboldt Current and the upwelling along the coast, in-ducing one rainy season during the austral summer (DJF). On
the eastern side of Ecuador, a region that includes the eastern Cordillera and the Amazon Basin, precipitation is controlled by the seasonal march of convective activity associated with the establishment and demise of the South American Sum-mer Monsoon (SASM) with a dry season centered around the austral summer (JF) and winter (AS) and a rainy season during the austral autumn (MAM) and spring (ON) (Fig. 2).
At Papallacta (00◦22 S, 78◦08 W; 3160 m), near our study area, mean annual temperature (MAT) is 9.6◦C and mean annual precipitation (MAP) is 1700 mm and often appears in the form of rain, hail, and thick fog during JJA (unpub-lished climate data from Instituto NAcional de Meteorologia e HIdrologia, INAMHI). The seasonality is unimodal with a precipitation maximum in MJJ and a minimum in JF, which is different from similar latitudes to the east (e.g., Manaus in the Amazon Basin) and the west (the Pacific coast) where the rainy season peaks during the austral summer (DJF) (CPTEC website). It is also different from the high Andes, where a bi-modal distribution is observed, and from the Pacific coast, where the rainy season is centered on the austral summer (DJF) (Fig. 2). The temperature gradient between the Ama-zon Basin in the lowlands (MAT 25◦C) and the high Andes (0◦C isotherm at approx. 4500 m on Antizana) is character-ized by a steep moist adiabat along the eastern slope of the Cordillera associated with strong convective activity. Con-sequently the MJJ peak of moisture at Papallacta is mainly a local phenomenon caused by mesoscale convective sys-tems (Bendix, 2000; Bendix et al., 2009). In an El Ni˜no year, when the Amazon Basin becomes warmer, upslope convec-tive activity from plant evapotranspiration may be enhanced, producing more cloud drip at high elevations.
The Sucus bog at Papallacta is located near the equator (00◦21′30 S; 78◦11′37 W) at an elevation of 3815 m. The sur-rounding vegetation is composed of the bog, the p´aramo and the Polylepis forest. In the bog, we identified the follow-ing species: Asteraceae Loricaria toyoides, Dorobaea
pin-pinelifolia, Monticalia vaccinioides, Hippochoerissp.,
Xeno-phyllum sp., Werneria sp.; Valerianaceae Valeriana
micro-phylla; LycopodiaceaeHuperziasp., GentianaceaeGentiana
sedifolia, Halemia weddeliana, Gentianella sp.; Poaceae
Cortaderia sericanta, Cortaderia nitida, Calamagrostis
in-termedia, Bromus sp., Cyperaceae Carex lechmanii;
Gun-neraceae Gunnera magellanica; Ranunculaceae Ranuncu-lussp.; ClusiaceaeHypericum laricifolium, Hypericumsp.; Geraniaceae Geranium sp.; Polygonaceae Muehlenbeckia
volcanica; Apiaceae Hydrocotyle, Azorella; Plantaginaceae
Plantago rigida(cushion bog). The p´aramo is a wet
grass-land located between the upper tree line and the permanent snow line. It is a constant, reliable source of high quality wa-ter for Andean regions due to the very high wawa-ter retention capability of the soil. Large cities such as Quito rely almost entirely on surface water from the p´aramo. The p´aramo is located between 3600 and 4000 m with grasses dominated by plants of the Poaceae family including Calamagrostis
30 20 10 0
j f m a m j j a s o n d
200 100 80 60 40 20 0
T ˚C Prec. mm.
T-: 22 T+: 24 P-: 148 P+: 446 Py: 3703
Tena 77˚49'W 00˚59'S 527m 1974–83
80 100 200 0 20 40 60 30 20 10 0
j f m a m j j a s o n d
200 100 80 60 40 20 0
T ˚C Prec. mm.
T-: 23 T+: 25 P-: 146 P+: 399 Py: 3071
Nuevo Rocafuerte 75˚25'W 00˚55'S 265m 1974–83
T ºC Prec. mm
30 20 10 0 0 20 40 60 80 100 200
j f m a m j j a s o n d
Quito 78º30'W 00º13'S 2818m 1983–74 T-: T+: P-: P+: Py: 30 20 10 0
j fm a m j j a s o n d
200 100 80 60 40 20 T ºC
San Lorenzo 78˚50'W 01˚16'N 5m 1974–83
T-: 24 T+: 26 P-: 77 P+: 335 Py: 2573 0 30 20 10 0
j f m a m j j a s o n d
200 100 80 60 40 20 0
T ºC Prec. mm.
T-: 24 T+: 26 P-: 3 P+: 190 Py: 951
Jama 80˚21'W 00˚11'S 5m 1974–83
T˚C Prec. mm
30 20 10 0 0 20 40 60 80 100 200
j f m a m j j a s o n d
Papallacta08'W 0˚ ˚22'S 3160m 1974–83.
T-: 8 T+: 8 P-: 87 P+: 264 Py: 1742 30 20 10 0
j f m a m j j a s o n d
200 100 80 60 40 20 0
T ºC Prec. mm.
T+: 26 P-: 0 P+: 299 Py: 974
Guayaquil 79˚53'W 02˚09'S 5m 1974–83
T ºC Prec. mm
30 20 10 0 0 20 40 60 80 100 200
j f m a m j j a s o n d
Cotopaxi–Refugio 78º26'W 00º39'S 4800m 1978–83 T-: 0 T+: 1 P-: 21 P+: 189 Py: 982 30 20 10 0
j f m a m j j a s o n d
200 100 80 60 40 20 0
T ˚ Prec. mm.
T-: 20 T+: 23 P-: 116 P+: 227 Py: 1955
Zamora 78˚56'W 04˚03'S 970m 1974–83
78
Fig. 2.Map of Ecuador with the 2500 m altitudinal limit (blue line) and climate diagrams drawn for the different regions (from Jorgensen and Ulloa Ulloa, 1994).
shrubs are Asteraceae Diplostephium, Pentacalia and Hy-pericaceae (ex Clusiaceae)Hypericum. The cushion p´aramo located between 4000 and 4500 m mainly hosts Apiaceae
Azorella, PlantaginaceaePlantago, AsteraceaeChuquiraga,
Loricaria, Werneria, and finally the desert p´aramo above
4500 m has Malvaceae Nototriche, Brassicaceae Draba,
AsteraceaeCulcitiumand Apiaceae Azorella.
The forests of Polylepis grow in the p´aramo altitudinal band, i.e., between 3500 and 4300 m a.s.l., with the same cli-matic conditions. These forests are dominated byPolylepis
pauta, although 124 species of trees, shrubs and herbs were
identified along with 25 different ferns (Romoleyroux, 2009). Among the 20 most abundant species areHydrocotyle
bond-plandii, Dysopsis cf.glechomoides, Solanum ruizii,
Mico-nia latifolia,Gunnera magellanica, Rubus coriaceus, Urtica
murens, and Caryophyllaceae (Arenaria andStellaria).
Hu-midity is high, reaching more than 80 % in these forests. The upper montane forest grows between 3000 and
∼3500 m and hosts 2189 species including the follow-ing dominant ones: Alnus, Ambrosia, Clethra, Gynoxys, Hedyosmum, Myrsine, Oreopanax, Podocarpus, Prumno-pitys, Ribes, Styrax, Symplocos, Tibouchina, Weinmannia
(Jorgensen and Ulloa Ulloa, 1994).
3 Material and methods
200 cm of the core that represents the last 1100 yr. Half sedi-ment columns, 100 cm long with a 5-cm diameter were cov-ered by longitudinally split PVC-tubes and wrapped in plas-tic film. Sediment cores were sampled at 2-cm intervals and the samples were sent to different laboratories. Ash layers were identified visually, and 1–2 cm thick samples removed. After drying and sieving, the 100 or 200 µm-size fractions were selected, depending of the granulometry of each sam-ple. Modal estimates of the main components (minerals, glass shards, lithic and pumice fragments) were obtained under a binocular microscope. The fine glass-rich fractions were finely powdered in an agate grinder and then analyzed for major and trace elements by inductively coupled plasma-atomic emission spectroscopy (ICP-AES) at theLaboratoire Domaines Oc´eaniques, Universit´e de Bretagne Occidentale
(Brest, France). Relative standard deviations were≤2 % for major elements, and≤5 % for trace elements. We selected ICP-AES analyses over other analytical methods such as electron microprobe analysis (EMPA) because it allowed us to determine the concentrations of trace elements in the ash samples by correlating these ash layers with known volcanic eruptions in the Ecuadorian Andes.
3.1 Sediment description
The core was mostly composed of brown peat intercalated with three tephra layers (M1, M2 and M3) in the lower half of the 2-m section, described as follows: 0–4 cm, plant fungi; 4– 14 cm, orange peat with fibers; 14–110 cm, brown-black peat; 110–115 cm, M1 ash and peat layer; 115–134 cm, brown-black peat rich in vegetal fibers; 134–136 cm, mix of ash and peat; 136–144 cm, M2 ash tephra (M2a) white, biotite-rich ash; 144–150 cm, tephra (M2b) coarse, gray-white, biotite-rich ash with small ash agglutinations; 150– 178 cm, brown peat with fibers; 178–181 cm, tephra (M3) coarse, crystal-rich ash with peat; 181–200 cm, brown peat with fibers.
The M1 layer (5-cm thick) is composed of fine, yellowish ash with some mixed peat. The mineral components include plagioclase and some traces of amphibole and pyroxene, with abundant glass and pumice shards. The M2 horizon is a dou-ble layer composed of a lower (8-cm thick) and an upper (10-cm thick) horizon. The lower horizon is a gray-white coarse ash, composed of pumice fragments and ash agglutinates, as well as biotite (14 %), plagioclase, pyroxene and quartz. The upper layer is composed of fine, crystal-rich, white ash with abundant plagioclase and biotite crystals, with a small proportion of pumice fragments. Lastly, the M3 layer (3-cm thick) is coarse, crystal-rich ash, which appears to be mixed with peat. Mineral components include plagioclase (30 %), amphibole (25 %) and pyroxene (14 %), as well as pumice (27 %) and lithic (4 %) fragments.
Bulk sample analyses of the glass-rich fractions enabled us to correlate these ash layers with known volcanic erup-tions in the northern Andes. The M2 samples are silica-rich
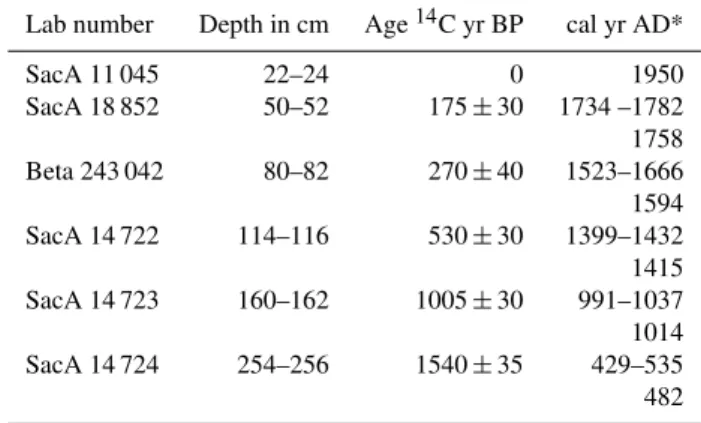
Table 1.Chronology of core PA 1-08. Radiocarbon ages were mea-sured on total organic matter. Calibrated ages were calculated from Calib 6.01 (Stuiver et al., 1998, 2011; J¨oris and Weninger, 1998).
Lab number Depth in cm Age14C yr BP cal yr AD*
SacA 11 045 22–24 0 1950
SacA 18 852 50–52 175±30 1734 –1782 1758 Beta 243 042 80–82 270±40 1523–1666 1594 SacA 14 722 114–116 530±30 1399–1432 1415 SacA 14 723 160–162 1005±30 991–1037 1014 SacA 14 724 254–256 1540±35 429–535 482
* Range at one standard deviation with error multiplier of 1.0; cal=calibrated.
dacites (68–70 wt.% SiO2), whereas M3 samples correspond
to siliceous andesite (60–61 wt.% SiO2). The geochemical
fields for some volcanoes have been described, namely An-tizana (Bourdon et al., 2002), Cotopaxi (Hall and Mothes, 2008), Pichincha (Robin et al., 2010; Samaniego et al., 2010) and Quilotoa volcanoes (Mothes and Hall, 2008) and may be sources of these ashes. Unfortunately, no chemical data were retrieved for sample M1.
3.2 Chronology
Dating control for core PA 1-08 is based on six radiocarbon AMS dates from bulk (Table 1) and three radiocarbon-dated tephra horizons (Table 2). All samples for radiocarbon dating were analyzed at the FrenchLaboratoire de Mesure du
Car-bone 14(LMC14) – UMS 2572 (CEA/DSM – CNRS – IRD
0 500 1000 1500
250
200
150
100
50
0
calibrated dates (yrs)
depth (cm)
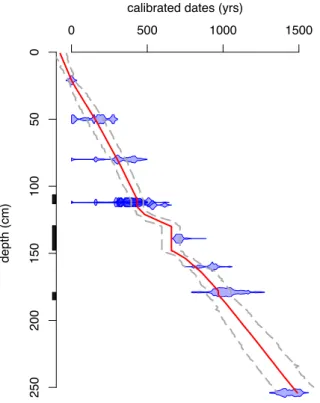
Fig. 3.Bacon age/depth model of core PA 1-08, overlaying the cal-ibrated distributions of the individual dates (blue). Dark grey ar-eas show the 95 % confidence intervals of the models (Blaauw and Christen, 2011). Black rectangles along the depth scale indicate the thickness of the different tephras.
changes in sedimentation rates and has provided a detailed discussion of the ages of the different tephras as reported in Table 2.
The hypothesis of a sediment gap between 130 and 115 cm was discarded because this 15 cm interval, which lasted 300 yr, is well constrained by 3 different dates – one ra-diocarbon date within the interval (530±30 BP), bracketed by 2 dated tephras – and because the presence of relatively high frequencies of Poaceae pollen grains indicates that the p´aramo was still able to prevent the soils from eroding. Therefore, instead a change in sedimentation rate appears more likely for this interval (Figs. 3 and 5).
3.3 Pollen analysis
Pollen samples were prepared using a standard protocol (Fae-gri and Iversen, 1989) and mounted in silicone oil on mi-croscope slides. Pollen analyses were performed under 600x magnification. Pollen grains and spores were identified using our reference pollen collection and pollen keys (Hooghiem-stra, 1984; Ortu˜no, 2008; Kuentz, 2009; Herrera, 2010). A minimum of 300 terrestrial pollen grains was analyzed in each sample. Fern spores and aquatic or water level-related taxa were excluded from the total sum for percentage cal-culation. Spore frequencies were calculated as a proportion
Table 2.Chronology of core PA 1-08 from tephra analyses. The age AD of the eruptions was obtained from the Bacon age model (Fig. 3) after plotting all the published radiocarbon dates (Mothes and Hall, 2008; Robin et al., 2008).
Tephra layer
Depth in cm
Name of the volcano
Date of the eruption (yr BP)
Age AD
M1 110–115 Guagua Pichincha
240±20* 290±20 320±20 330±30 335±20 450±40
1520
M2 130–148 Quilotoa 793±24** 1275
M3 178–181 Guagua Pichincha
1096±15** 975
* All 6 radiocarbon dates obtained for this tephra (Robin et al., 2008) have been plotted in Fig. 3. The resulting age AD indicated in this table was obtained from the age model (Fig. 3) as being the highest probability for the age of the tephra M1. ** Mean age from Mothes and Hall (2008); Robin et al. (2008).
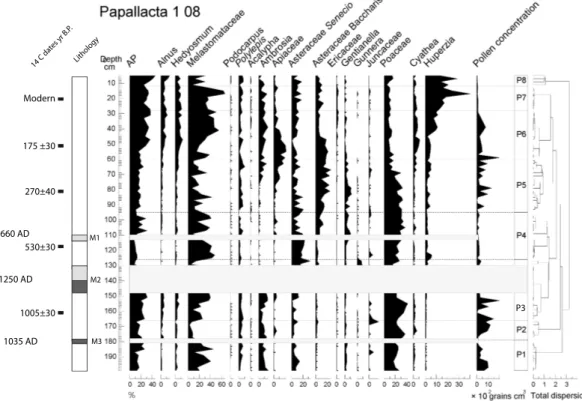
of the total pollen sum. The pollen record was plotted using Psimpol (Bennett, 1994) and divided into zones on the ba-sis of constrained cluster analyba-sis by sum of squares analyba-sis (CONISS) with pollen taxa≥1 % (Grimm, 1987) (Fig. 5). The pollen concentration was calculated using the method of Cour (1974). Sample resolution is∼14 yr.
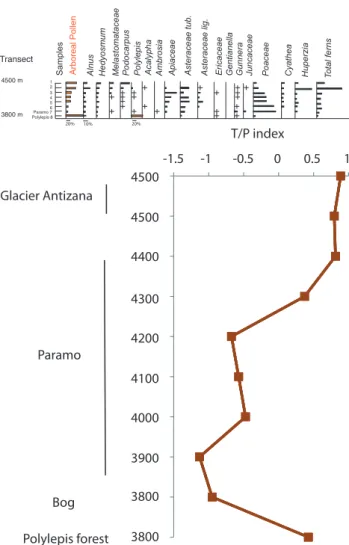
Surface samples consisting of several pinches of the surface layer of soil were collected at 100 m intervals along a transect between the surface of the glacier at 4500 m a.s.l., where two samples were analyzed, and the cor-ing site at 3800 m, plus two samples in thePolylepisforest located at the edge of the bog and in the p´aramo surrounding the bog (Fig. 4a).
3.4 Transported pollen/Poaceae (T/P) ratio as
convection index
Changes in relative abundance between the cloud transported pollen taxa from the Andean forest, Alnus, Hedyosmum,
Podocarpus, and the Poaceae, as a function of edaphic
Papallacta 01-08
Alnus Hedyosmum Melastomataceae Podocarpus Polylepis Acalypha Ambrosia
Samples Arboreal Pollen Apiaceae Asteraceae tub. Asteraceae lig. Ericaceae Gentianella Gunnera Juncaceae Poaceae Cyathea Huperzia Total ferns 1
2 3 4 5 6 Paramo 7 Polylepis 8
Transect
4500 m
3800 m
10%
20% 20%
4500
4500
4400
4300
4200
4100
4000
3900
3800
3800 Glacier Antizana
Paramo
Polylepis forest Bog
-1.5 -1 -0.5 0 0.5 1 T/P index
Fig. 4. (a)Pollen diagram showing the modern pollen rain along a transect between Antizana glacier (4500 m) and Papallacta bog (3800 m) for the main taxa.(b)T/P index of convective acitivity for surface samples along the altitudinal transect.
transported pollen and therefore higher convective transport of the Andean forest pollen grains and significant cloud drip-ping as a source of moisture. Negative values (abundance of Poaceae) suggest the presence of permanent humidity in the soil of the p´aramos.
4 Results
4.1 Modern pollen rain
Results are presented in Fig. 4a and b and discussed from low to high elevations.
The upper montane forest taxa are represented byAlnus,
HedyosmumandPodocarpus. These taxa do not grow in the
area around the bog today but 200 m below, at 3600 m a.s.l. What is extremely surprising is that their highest
frequen-cies were observed at a high elevation, near the glacier. This observation indicates strong pollen transport today from the Andean forest limit at∼3600 m a.s.l., up to the glacier lo-cated at 4500 m a.s.l., as observed in Bolivia (Ortu˜no et al., 2011). This observation confirms the fact that convective ac-tivity can be characterized by the frequency of these three taxa and the use of the index of convective T/P activity defined above.
Ambrosia arborescensis the only species ofAmbrosiathat
grows on the eastern Cordillera at the latitude of Papallacta. It is a herb growing between 3000 and 3400 m a.s.l. in northern Ecuador, in the upper montane forest ecosystem, where MAP ranges between 600 to 1700 mm per year and MAT between 9◦C and 12◦C (Jorgensen and Leon-Yanez, 1999). The plant is insect pollinated, meaning that the pollen grains are not dispersed over long distances.
Polylepis pollen grains are well represented in the
Polylepis forest close to the bog, and are not transported.
For that reason, they are considered as good indicators of the proximity of a forest.
In the bog, modern pollen deposition is defined from the top of the fossil record (Fig. 6) and is characterized mainly by Poaceae, Ericaceae,GeraniellaandHuperzia.
Poaceae and Asteraceae typeSeneciopollen grains char-acterize the p´aramo. Poaceae is mainly represented by
Cala-magrostis,a herb able to retain water in the soil and which
gives the p´aramo its water storage capacity. When Aster-aceae type Senecio becomes dominant, it is interpreted as drier conditions on the p´aramos (Reese and Liu, 2005).
Apiaceae pollen frequencies increase at high elevation. Two genera of the Apiaceae family are able to grow above 4000 m:Oreomyrrhis andicola, a herb that grows at 4500 m
and Ottoa oenanthoides, a herb that grows between 4000
and 4500 m (Jorgensen and Ulloa Ulloa, 1994; Jorgensen and Leon-Yanez, 1999). They are both indicators of cold temper-ature, as the base of the glacier is located at 4500 m a.s.l. to-day. Melastomataceae is an ubiquist shrub or herb.
Hence, changes in Poaceae frequencies are associated with year-round moisture on the p´aramo and the ability of the grassland to store water, while the convection index provides information about changes in the intensity of upslope cloud activity or convective activity related to the temperature gradient between the Amazon Basin and the high-altitude glaciers.
4.2 Fossil record
The results of PA 1-08 pollen record are detailed in Ta-ble 3 and presented in a synthetic figure along a depth scale (Fig. 5) showing the key taxa identified in the sur-face samples (Fig. 4). Four main taxa or groups of taxa are distinguished to characterize either moisture or temper-ature changes on the p´aramo: Poaceae, Apiaceae,Ambrosia
1250 AD
1035 AD Modern
175 ±30
270±40
530±30
1005±30 14 C da
tes yr B .P.
Lithology
M1
M2
M3
P3 1660 AD
Fig. 5.Synthetic pollen diagram of core PA 1-08. Changes in arboreal pollen and 17 key taxa are presented along a depth scale. See detailed lithological description in the text.
0 10 20 30 40 50
800 900 1000 1100 1200 1300 1400 1500 1600 1700 1800 1900 2000
P
ollen %
cal yr AD AP
Poaceae
Ambrosia Apiaceae
Fig. 6.Synthetic pollen diagram of core PA 1-08 showing changes in frequencies of arboreal pollen taxa, Poaceae,Ambrosiaand Api-aceae presented along a timescale. Gray bars indicate volcanic erup-tions.
between 100 and 2000 grains g−1 with the lowest values between∼1250 and 1550 AD.
5 Environmental reconstructions
Today, the upper montane forest grows up to∼3500 m. It never reached the altitude of the bog in the past 3000 yr (Moscol Oliveira and Hooghiemstra, 2010). Therefore, we can assume that in the last 1000 yr all the tree taxa
indica-tors of forest –Alnus, Hedyosmum,Podocarpus– were al-ways transported from their source by cloud convection and deposited on the bog by cloud drip and rainfall.
5.1 The period 850 to 1250 AD
This period includes one volcanic eruption in 975 AD. The high frequencies ofAmbrosiadocument locally humid conditions and warm temperatures. A drier interval occurred between∼990 and 1090 AD whenAmbrosiadecreased dras-tically. Tree taxa are mainly represented by Melastomat-aceae, which also grow as shrubs in the area around the bog. The upper montane forest taxa are well represented in both frequency and concentration, providing evidence of signif-icant convective activity (Fig. 6). Two colder episodes (in-crease in Apiaceae) occurred in∼1030 AD and∼1270 AD. Poaceae frequencies are high and indicate permanent wet soil on the p´aramo and the presence of a wet mean state climate.
5.2 The period 1250 to 1550 AD
This interval includes two volcanic eruptions, one in 1270 AD and one in 1520 AD.
The very low frequencies of transported taxa and
Am-brosia, the dominance of Melastomataceae and Poaceae, and
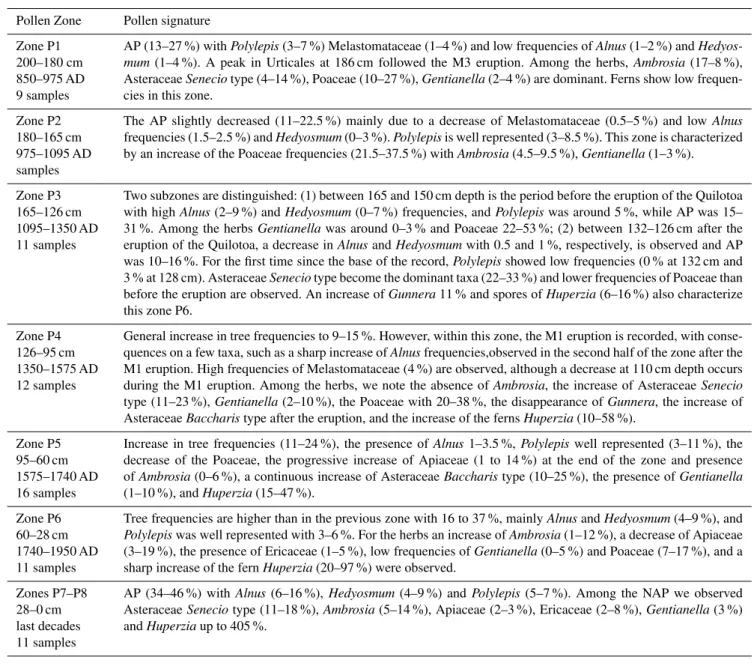
Table 3.Detailed description of the pollen zones defined in Fig. 5.
Pollen Zone Pollen signature
Zone P1 200–180 cm 850–975 AD 9 samples
AP (13–27 %) withPolylepis(3–7 %) Melastomataceae (1–4 %) and low frequencies ofAlnus(1–2 %) and Hedyos-mum(1–4 %). A peak in Urticales at 186 cm followed the M3 eruption. Among the herbs,Ambrosia(17–8 %), AsteraceaeSeneciotype (4–14 %), Poaceae (10–27 %),Gentianella(2–4 %) are dominant. Ferns show low frequen-cies in this zone.
Zone P2 180–165 cm 975–1095 AD samples
The AP slightly decreased (11–22.5 %) mainly due to a decrease of Melastomataceae (0.5–5 %) and lowAlnus frequencies (1.5–2.5 %) andHedyosmum(0–3 %).Polylepisis well represented (3–8.5 %). This zone is characterized by an increase of the Poaceae frequencies (21.5–37.5 %) withAmbrosia(4.5–9.5 %),Gentianella(1–3 %).
Zone P3 165–126 cm 1095–1350 AD 11 samples
Two subzones are distinguished: (1) between 165 and 150 cm depth is the period before the eruption of the Quilotoa with highAlnus(2–9 %) andHedyosmum(0–7 %) frequencies, andPolylepiswas around 5 %, while AP was 15– 31 %. Among the herbsGentianellawas around 0–3 % and Poaceae 22–53 %; (2) between 132–126 cm after the eruption of the Quilotoa, a decrease inAlnusandHedyosmumwith 0.5 and 1 %, respectively, is observed and AP was 10–16 %. For the first time since the base of the record,Polylepisshowed low frequencies (0 % at 132 cm and 3 % at 128 cm). AsteraceaeSeneciotype become the dominant taxa (22–33 %) and lower frequencies of Poaceae than before the eruption are observed. An increase ofGunnera11 % and spores ofHuperzia(6–16 %) also characterize this zone P6.
Zone P4 126–95 cm 1350–1575 AD 12 samples
General increase in tree frequencies to 9–15 %. However, within this zone, the M1 eruption is recorded, with conse-quences on a few taxa, such as a sharp increase ofAlnusfrequencies,observed in the second half of the zone after the M1 eruption. High frequencies of Melastomataceae (4 %) are observed, although a decrease at 110 cm depth occurs during the M1 eruption. Among the herbs, we note the absence ofAmbrosia, the increase of AsteraceaeSenecio type (11–23 %),Gentianella(2–10 %), the Poaceae with 20–38 %, the disappearance ofGunnera, the increase of AsteraceaeBaccharistype after the eruption, and the increase of the fernsHuperzia(10–58 %).
Zone P5 95–60 cm 1575–1740 AD 16 samples
Increase in tree frequencies (11–24 %), the presence ofAlnus1–3.5 %,Polylepiswell represented (3–11 %), the decrease of the Poaceae, the progressive increase of Apiaceae (1 to 14 %) at the end of the zone and presence ofAmbrosia(0–6 %), a continuous increase of AsteraceaeBaccharistype (10–25 %), the presence ofGentianella (1–10 %), andHuperzia(15–47 %).
Zone P6 60–28 cm 1740–1950 AD 11 samples
Tree frequencies are higher than in the previous zone with 16 to 37 %, mainlyAlnusandHedyosmum(4–9 %), and Polylepiswas well represented with 3–6 %. For the herbs an increase ofAmbrosia(1–12 %), a decrease of Apiaceae (3–19 %), the presence of Ericaceae (1–5 %), low frequencies ofGentianella(0–5 %) and Poaceae (7–17 %), and a sharp increase of the fernHuperzia(20–97 %) were observed.
Zones P7–P8 28–0 cm last decades 11 samples
AP (34–46 %) withAlnus(6–16 %),Hedyosmum(4–9 %) andPolylepis(5–7 %). Among the NAP we observed AsteraceaeSeneciotype (11–18 %),Ambrosia(5–14 %), Apiaceae (2–3 %), Ericaceae (2–8 %),Gentianella(3 %) andHuperziaup to 405 %.
by a different landscape suggested by the expansion of the
Seneciotype of Asteraceae. This landscape could also
corre-spond to a post-eruptive situation. However, the long dura-tion of this event (∼300 yr), the absence of tephra, and the slow sedimentation (0.07 cm yr−1) (Fig. 4) during this inter-val support the hypothesis that this anomaly is climatically driven. Poaceae is found at lower frequencies than during the previous interval, also suggesting less moisture. This is the driest interval of the record due to much reduced upslope convective activity (Fig. 7).
5.3 The period 1550 to∼1650 AD
The return to upslope convective activity and a wetter cli-mate is evidenced by the simultaneous increase in tree
fre-quencies, convection index and Poaceae. The presence of the species association of Poaceae, Ericaceae, Geraniella, Ur-ticales,Huperzia,reflects the spectrum of the bog surrounded by the grass p´aramo. A short colder episode occurred dur-ing this interval, as evidenced by the increase in Apiaceae at
∼1550 AD. Both high Poaceae frequencies and convective index indicate humid conditions on the p´aramo.
5.4 The period∼1650 to 1800 AD
% S
and
El Junco Papallacta
Cascayunga
∂ 18 O
higher
lower
con
vec
tiv
e ac
tivit
y
T/ P inde
x
Less More
ENSO v
ar
iabilit
y
1000 1100 1200 1300 1400 1500 1600 1700 1800 1900 2000 higher
lower
rainfall
1000 1100 1200 1300 1400 1500 1600 1700 1800 1900 2000 Year AD
Year AD
MCA LIA CWP
-8
-7
-6
3 6 9 12 -1 -1.5 0 - 0.5 0.5 1
*
*
A
B
C
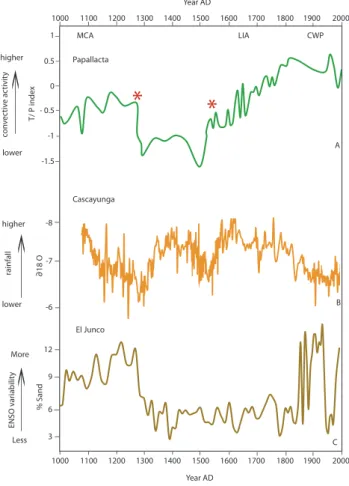
Fig. 7.The past 1000 yr in western South America with (A)the Papallacta T/P index of upslope convective activity calculated from the PA 1-08 pollen record;(B)∂18O cal from Cascayunga, Peru, a record of SASM intensity (Reuter et al., 2009), and(C)% sand from El Junco, Galapagos, a record of El Ni˜no frequency (from Conroy et al., 2009). Red stars show volcanic eruptions at Papallacta.
of Apiaceae documents cooler temperatures. The convection index remained stable throughout the zone. Between 1750 and 1800 AD, the simultaneous reduction ofAmbrosia and Poaceae and the maximum expansion of Apiaceae highlight a change to a drier p´aramo due to a drier and colder cli-mate than before. In fact this period represents the coldest and driest interval of the entire PA 1-08 record.
5.5 The period 1800 to 2008 AD
The progressive reduction of Apiaceae indicates the return of warmer temperatures. The marked increase in tree-pollen frequencies was due to a significant increase in upslope con-vective activity as the position of the upper tree line did not change during this period (Moscol Oliveira and Hooghiem-stra, 2010), which was confirmed by the convection index (Fig. 7). The return ofAmbrosiacharacterized the humid soil around the bog, which was also evidenced by the presence of bog-associated taxa. Poaceae frequencies remained low. This confirms that changes in soil water retention capacity
ob-served in the previous interval are continuing their downward trend. Significant expansion ofHuperzia, high frequencies of upper montane forest trees and a high convection index con-firm the trend toward warmer temperatures in the area and to the significant contribution of upslope convective activity to moisture mean conditions in the high eastern Cordillera.
The period between 1800 and 2008 AD is characterized by the strongest upslope convective activity of the entire record and the lowest water storage in the soil of the p´aramos in the past 1000 yr.
5.6 The impact of volcanic eruptions on the vegetation
None of the three volcanic eruptions recorded in the bog orig-inated from Antizana volcano. The long distance between Quilotoa and the study area (more than 100 km) probably protected it from significant changes in the vegetation and landscape although pre-Colombian sites in northern Ecuador were abandoned after the eruption (Hall and Mothes, 2008). Indeed, the 18-cm thick ash layer from the Quilotoa eruption completely dried up the bog for a decade and slowed down the pollination rates is evidence that the plants were
suffer-ing.Gunnerashowed high frequencies (11 %) after the
depo-sition of the tephra M2. This herb is associated with stagnant water and could be a sign of a change in the drainage of the bog for a decade after the eruption, when the regional climate remained moist. A peak in Urticales (11 %) was observed after the M1 eruption.
5.7 The response of the Polylepis forest
Today thePolylepisforest is well represented in the p´aramo all around the bog. The fossil pollen record shows that the forest was always present and reacted very little to the cli-mate changes that occurred during the last 1000 yr.Polylepis
frequencies decreased from 4 % to 0.2 % in the years fol-lowing the eruption, but returned to their initial values quite rapidly.
activity increased significantly and temperatures became pro-gressively warmer while the p´aramo remained dry, docu-menting the reduced water storage in the soil, in spite of the high convective activity.
6 Discussion
Among these five climate intervals, the MCA, the LIA, and the CWP are clearly visible in the Papallacta pollen record. They are characterized by significant variability of rainfall and temperature with pronounced century-scale changes in the mean state climate during the MCA, one intermediate pe-riod between the MCA and the LIA, the two-step LIA, and the CWP.
To detect the major factors influencing precipitation and temperature variability at Papallacta, either related to Pa-cific or Atlantic SSTs, we plotted the convective index with changes in the ratio of tychoplanktonic to epiphytic diatoms – the T/E index, associated to changes in number of El Ni˜no events from the El Junco lacustrine record in the Galapagos (Conroy et al., 2009) – and changes in precipitation strictly linked to SASM activity from the Cascayunga speleothem record in northeastern Peru (Reuter et al., 2009). These com-parisons reveal a remarkable link between the Papallacta con-vective index and the eastern equatorial Pacific SST T/E in-dex for the first part of the time interval (until∼1500 AD) and between the Papallacta convective index and the east-ern Andes isotopic record for the second half of the inter-val (Fig. 7). High inter-values of T/E index were related to a high number of El Ni˜no events. However, modern climate analy-ses show that during the positive phase of ENSO, when tem-peratures are warmer in the equatorial Pacific, a drier climate is observed in the Ecuadorian Andes (Vuille et al., 2000; Gar-reaud et al., 2009). Therefore the link between a high number of El Ni˜no events and a moist climate in the Ecuadorian An-des is questionable. In addition, at El Junco, the diatom-based eastern equatorial Pacific SST T/E index does not reveal nei-ther the La Ni˜na-like MCA nor the El Ni˜no-like LIA (Cobb et al., 2003; Sachs et al., 2009). The terms La Ni˜na-like or El Ni˜no-like have been broadly used to refer to higher La Ni˜na or El Ni˜no frequencies (Sachs et al., 2009) or increased oc-currence of La Ni˜na or El Ni˜no events within a given time interval (Cobb et al., 2003). However, we know for instance that during the LIA glaciers expanded in the tropical Andes, which is inconsistent with an increase in El Ni˜no events, as according to modern observations, this would favour glacier retreat (Jomelli et al., 2009). Garreaud and Battisti (1999) as-sociated the term El Ni˜no-like to longer periods of variability on interdecadal timescales with major effects on the patterns of seasonality. Here we will refer to “ENSO variability” to discuss changes in equatorial Pacific SST, even though our focus is on interdecadal scales in the sense of Garreaud and Battisti (1999).
This interpretation is supported by recent results obtained from spectral analysis based on tree-ring records in the cen-tral Andes (Morales et al., 2012). These results show that ENSO variability is more important for long-term climate characterization than considering separately the number of El Ni˜no and La Ni˜na events. Consequently, we interpret the remarkable link between the T/P index at Papallacta and the T/E index at El Junco as reflecting the influence of Pacific SST variability rather than the just the number of El Ni˜no events.
6.1 The medieval climate anomaly
Early in the millennium, the tropical Pacific was shown to be cooler, consistent with La Ni˜na-like conditions (Cobb et al., 2003). Therefore, one would expect an expansion of An-tizana Glacier between 900 and 1200 AD (Francou et al., 2004). However, a downslope shift in the glacier front was not confirmed by the pollen record. On the other hand, mod-ern climate observations also show that during a negative SOI or La Ni˜na events winter (JJA) and summer (DJF) mois-ture increases on the p´aramo. Consequently, it appears that at Papallacta, the high convective index in phase with the increased ENSO frequency reveals an increase in moisture induced by a decadal-scale modulation of ENSO-related cli-mate variability. In addition, high Poaceae frequencies in-dicate a permanently wet soil on the p´aramo. The MCA is characterized by a warm northern equatorial Atlantic (Haug et al., 2001) and a cool south equatorial Atlantic (Polis-sar et al., 2006) (Fig. 1). These conditions led to a north-ern migration of the ITCZ and a weakened SASM, and re-sulted in decreased rainfall in the Amazon Basin during the wet season (DJF) (Cohen et al., 2009; Reuter et al., 2009). Our results show that at the elevation of Papallacta, the lack of moisture induced by a weakened SASM was prob-ably counterbalanced by moisture transport induced by high ENSO variability.
Model reconstructions show a division between the north-ern and southnorth-ern tropical Andes during the MCA, with wet-ter/drier climate to the north/south (positive/negative soil anomaly) in agreement with our results (Seager et al., 2008; Diaz et al., 2011). Consequently under negative soil moisture conditions, the southern p´aramo would have been drastically reduced in size. This out-of-phase behavior is an important aspect to take into consideration when projecting impacts of anthropogenic climate change on the future water supply from the p´aramo.
6.2 The period 1250 to 1550 AD
convection that is likely specific to the eastern Cordillera. Comparison between the convective index and ENSO vari-ability shows a decrease in both phenomena (Fig. 7). The combined effect of a weaker SASM (Reuter et al., 2009; Bird et al., 2011; Vuille et al., 2012) and low ENSO vari-ability at the beginning of the interval (Conroy et al., 2009) created particularly dry conditions at Papallacta that modi-fied the landscape. After 1300 AD, ENSO variability was still low when the SASM became stronger (Bird et al., 2011). The presence of both Poaceae and Asteraceae taxa document that the p´aramo was drier, but still functioning as a wet grassland. More to the south, in the central Andes, frequent extreme droughts were observed until 1400 AD and less frequent ex-treme droughts until 1600 AD (Morales et al., 2012), both of which were attributed to low ENSO variability. In the south-ern Andes the period between 1250 and 1400 AD has been identified as the driest phase of the MCA with a weak corre-lation with ENSO (Boucher et al., 2011; Neukom and Gergis, 2012). Our results confirm that this extreme drought dom-inated climatic conditions from the equator to the southern Andes during this time period.
6.3 The Little Ice Age
In the equatorial Pacific the time interval corresponding to the LIA, ∼1500 to 1800 AD, is characterized by warmer SST associated with El Ni˜no-like conditions (Sachs et al., 2009). Today, at high elevations in Ecuador, an El Ni˜no event is associated with warmer temperatures and a negative glacier mass balance (Francou et al., 2004). However, glacier retreat due to mean state El Ni˜no-like conditions would cause an upslope shift of the altitudinal vegetation band, which is not the case at Papallacta. On the contrary, the growth of Api-aceae reached the lower altitude of 3800 m a.s.l., indicating a downslope shift of the glacier and a decrease in temperature. Given the high convective index and low ENSO variability between 1550 and 1800 AD (Fig. 7), we conclude that the wetter climatic conditions observed at Papallacta are a re-sult of both low interdecadal ENSO variability and stronger SASM activity rather than due to a trend toward a more El Ni˜no-like mean state (Sachs et al., 2009).
In the Atlantic, a cool northern equatorial basin (Haug et al., 2001) and warm conditions in the southern equato-rial Atlantic (Polissar et al., 2006) caused a southward shift of the ITCZ. This century-scale ocean-atmosphere coupling was characterized by an intensification of the SASM and in-creased precipitation in tropical South America, (Vimeux et al., 2009; Bird et al., 2011) and particularly a wetter Ama-zon Basin (Cohen et al., 2009; Vuille et al., 2012) and the presence of increased moisture along the eastern Cordillera in northern South America, reaching at least as far south as southern Peru (Reuter et al., 2009; Bird et al., 2011). Be-tween 1550 and 1650 AD, the combined effect of a stronger SASM and low ENSO variability (Fig. 7) favored the most humid conditions of the last 1000 yr, with a maximum ice
expansion between 1750 and 1800 AD characterized by a∼
1◦C drop in temperature and a 20 % increase in precipitation (Jomelli et al., 2009).
At Papallacta, this pattern ended in ∼1800 AD. Indeed, the sharp decrease in Poaceae frequencies (Fig. 6) indicates drier conditions on the p´aramo linked to a decrease in the soil moisture conditions. This interval included the driest and coldest phase at Papallacta. A weakened SASM system, re-lated to the beginning of the northward shift of the ITCZ (Haug et al., 2001), and strong upslope convection as the Amazon Basin was very wet, associated with low ENSO fre-quencies, characterized the climate system during the second part of the LIA.
6.4 The Current Warm Period
After 1800 AD, the abrupt increase in the convective index, which reached its highest values in the last 1000 yr, reflects the sharp increase in the intensity of cloud condensation up to high elevations. Here the movement of the vegetation belt, characterized by the progressive retreat of Apiaceae and the return of warmer temperatures in the bog, was again in phase with the retreat of the glacier Antizana.
The warming of the Pacific and the increase in ENSO variability (Conroy et al., 2009; Morales et al., 2012) led to significant glacier retreat after 1800 AD (Francou et al., 2000; Jomelli, et al., 2009, 2011). The continuous decrease in Poaceae documents drier soil and changes in precipita-tion regimes under the combined effect of a weaker SASM and higher ENSO variability. The p´aramo drastically weak-ened, progressively losing its ability to store water although atmospheric moisture was high.
At the elevation of the glacier, a two-step warming, with a slow phase that lasted until 1880 AD, and a more rapid warm-ing since 1880, was observed (Jomelli et al., 2009, 2011). A high convective index reaching its highest values, also recorded in our modern pollen samples (Fig. 4b), is proba-bly evidence for a precipitation increase during the last two centuries. This precipitation increase, however, was insuffi-cient to induce a glacial advance. On the contrary, glaciers started to retreat after 1800 AD, in conjunction with the dustrial warming and under the combined effect of an in-crease in ENSO variability, higher local convective activity, and a weaker overall SASM.
7 Conclusions
distribution at high elevations. The MCA was characterized by strong Pacific SST variability and a weaker SASM until 1250 AD, while during the period between the MCA and the LIA, 1250 to 1550 AD, low ENSO frequencies and a cool southern tropical Atlantic led to a drier p´aramo. During the LIA, two phases were observed: the first one between 1550 and 1650 AD, linked to low ENSO variability in the Pacific and warm south equatorial Atlantic SSTs, favored the return of a wet p´aramo, while the second period between 1650 and 1800 AD, associated with low ENSO variability and weak SASM activity, resulted in drying of the p´aramo soils. The CWP marked the beginning of a climate characterized by high ENSO frequencies – the highest in the last millennium – and weak SASM activity which lead to accelerated glacier retreat (Favier et al., 2004) and weakened the p´aramo. In ad-dition, our results show that the p´aramo started to weaken in 1650 AD during the cold phase of the LIA and did not re-cover during the CWP, hence losing some of its high water retention capacity. Our results also show that the interdecadal variability of both tropical Pacific and Atlantic SSTs matters for the northern Andean climate, with interdecadal Pacific variability providing the dominant forcing until 1500 AD and Atlantic interdecadal variability dominating thereafter.
In the 21st century, areas of increased and decreased pre-cipitation are projected for the tropical Andes, although these are spatially incoherent (Urrutia and Vuille, 2009). Along the eastern slopes of the Andes the observed increase in convec-tive activity (this study), the projected warming at higher al-titudes (Bradley et al., 2006) and the predicted increase in precipitation up to 2000 m a.s.l. (Urrutia and Vuille, 2009) will challenge socio-economic activities, including the sup-ply of drinking water, and water for agriculture and for hy-dropower production. Indeed, the accelerated melting of An-dean glaciers is not the only threat to water storage in the 21st century; the change in the hydrology of the p´aramo, which started at the end of the 18th century, will have much more drastic long-term impacts on water supplies to communities living in the tropical Andes and in all hydrologically related lowlands (Buytaert et al., 2006).
Acknowledgements. This research is part of the UR GREAT ICE program at IRD, ANR ESCARCEL and ANR EL PASO. Financial support was provided by IRD and the French ANR. All radiocarbon dates were measured at theLaboratoire de Mesure du Carbone 14 (LMC14) – UMS 2572 (CEA/DSM CNRS IRD IRSN). We thank theMinisterio del Ambiente del Ecuadorfor permitting and facilitating our fieldwork at Papallacta, the INAMHI for providing climate data, Laurent Bremond and Charly Favier for discussing the age model, Vera Markgraf and anonymous referee 2 for their constructive and helpful review, and we are grateful to Boromir and J¨org Bogumil for their help and support during fieldwork.
Edited by: E. Zorita
References
Bendix, J.: Precipitation dynamics in Ecuador and northern Peru during the 1991/92 El Ni˜no: a remote sensing perspective, Int. J. Remote Sens., 21, 533–548, 2000.
Bendix, J., Trachte, K., Cermak, J., Rollenbeck, R., and Nauss, T.: Formation of convective clouds at the foothills of the tropical eastern Andes (South Ecuador), J. Appl. Meteorol. Climatol., 48, 1682–1695, 2009.
Bennett, K. D.: “Psimpoll” version 2.23: a C program for analysing pollen data and plotting pollen diagrams. INQUA Commission for the study of the Holocene: Working group on data-handling methods, Newsletter, 11, 4–6, 1994.
Bird, B. W., Abbott, M. B., Vuille, M., Rodbell, D. T., Stansell, N. D., and Rosenmeier, M. F.: A 2,300-year-long annually resolved record of the South American summer monsoon from the Peru-vian Andes, Proc. Natl. Acad. Sci., 108, 8583–8588, 2011. Blaauw, M. and Christen, J. A.: Flexible paleoclimate age-depth
models using an autoregressive gamma process, Bayesian Anal-ysis, 6, 457–474, 2011.
Boucher, ´E., Guiot, J., and Chapron, E.: A millennial multi-proxy reconstruction of summer PDSI for Southern South America, Clim. Past, 7, 957–974, doi:10.5194/cp-7-957-2011, 2011. Bourdon, E., Eissen, J. P., Monzier, M., Robin, C., Martin, H.,
Cot-ten, J., and Hall, M. L.: Adakite- like lavas from Antisana Vol-cano (Ecuador): evidence for slab melt metasomatism beneath the Andean Northern Volcanic Zone, J. Petrol., 43, 199–217, 2002.
Bradley, R. S., Vuille, M., Diaz, H. F., and Vergara, W.: Threats to water supplies in the tropical Andes, Science, 312, 1755–1756, 2006.
Buytaert, W., C´elleri, R., De Bievre, B., Cisneros, F., Wyseure, G., Decckers, J., and Hostede, R.: Human impact on the hydrology of the Andean paramos, Earth Sci. Rev., 79, 53–72, 2006. Chepstow-Lusty, A. J., Frogley, M. R., Bauer, B. S., Leng, M. J.,
Boessenkool, K. P., Carcaillet, C., Ali, A. A., and Gioda, A.: Putting the rise of the Inca Empire within a climatic and land management context, Clim. Past, 5, 375–388, doi:10.5194/cp-5-375-2009, 2009.
Cobb, K. M., Charles, C. D., Cheng, H., and Edwards, L.: El Ni˜no/Southern Oscillation and tropical Pacific climate during the last millennium, Nature, 424, 271–276, 2003.
Cohen, M. C. L., Behling, H., Lara, R. J., Smith, C. B., Matos, H. R. S., and Vedel, V.: Impact of sea-level and climatic changes on the Amazon coastal wetlands during the late Holocene, Veg. Hist. Archaeobot., 18, 425–439, 2009.
Conroy, J. L., Restrepo, A., Overpeck, J. T., Steinitz-Kannan, M., Cole, J. E., Bush, M. B., and Colinvaux, P. A.: Unprecedented recent warming of surface temperatures in the eastern tropical Pacific Ocean, Nat. Geosci., 2, 46–50, 2009.
Cour, P.: Nouvelle techniques de d´etection des flux et des retomb´ees polliniques: ´Etude de la sedimentation des pollens et des spores `a la surface du sol, Pollen et Spores, XVI, 103–141, 1974. Diaz, H. F., Trigo, R., Hughes, M. K., Mann, M. E., Xoplaki, E., and
Barriopedro, D.: Spatial and temporal characteristics of climate in medieval times revisited, B. Am. Meteorol. Soc., 92, 1487– 1500, 2011.
Favier, V., Wagnon, P., and Ribstein, P.: Glaciers of the outer and inner tropics: A different behaviour but a common re-sponse to climatic forcing, Geophys. Res. Lett., 31, L16403, doi:10.1029/2004GL020654, 2004.
Francou, B., Ram´ırez, E., C´aceres, B., and Mendoza, J.: Glacier evolution in the tropical Andes during the last decades of the 20th century: Chacaltaya, Bolivia, and Antizana, Ecuador, Ambio, 29, 416–422, 2000.
Francou, B., Vuille, M., Favier, V., and C´aceres, B.: New evi-dence for an ENSO impact on low-latitude glaciers: Antizana 15, Andes of Ecuador, 0◦28′S, J. Geophys. Res., 109, D18106, doi:10.1029/2003JD004484, 2004.
Garreaud, R. D. and Battisti, D. S.: Interannual (ENSO) and inter-decadal (ENSO-like) variability in the southern hemisphere tro-pospheric circulation, J. Climate, 12, 2113–2123, 1999. Garreaud, R. D., Vuille, M., Compagnucci, R., and Marengo, J.:
Present-day South American climate, Palaeogeogr. Palaeocl., 281, 180–195, doi:10.1016/j.palaeo.2007.10.032, 2009. Grimm, E. C.: CONISS: a FORTRAN 77 program for
stratigraph-ically constrained cluster analysis by the method of incremental sum of squares, Comput. Geosci., 13, 13–35, 1987.
Hall, M. A. and Mothes, P. A.: Volcanic impediments in the progres-sive development of pre-columbian civilizations in the Ecuado-rian Andes, J. Volcanol. Geotherm. Res., 176, 344–355, 2008. Hastenrath, S.: Climate dynamics of the Tropics, Kluwer Academy,
Dordrecht, 488 pp., 1995.
Haug, G. H., Hughen, K. A., Sigman, D. M., Peterson, L. C., and R¨ohl, U.: Southward migration of the intertropical convergence zone through the Holocene, Science, 293, 1304–1306, 2001. Herrera, M.: Polen y esporas del Bosque de Papallacta, Biologia,
Universidad Centrale del Ecuador (UCE), Quito, 120 pp., 2010. Hooghiemstra, H.: Vegetational and climatic history of the high
plain of Bogot´a, Colombia: A continuous record of the last 3.5 million years, J. Cramer, Vaduz, 1984.
Jomelli, V., Favier, V., Rabatel, A., Brunstein, D., Hoffmann, G., and Francou, B.: Fluctuations of glaciers in the tropical Andes over the last millennium and paleoclimatic implications: A re-view, Palaeogeogr. Palaeocl., 281, 269–282, 2009.
Jomelli, V., Khodri, M., Favier, V., Brunstein, D., Ledru, M.-P., Wagnon, P., Blard, P.-H., Sicart, J.- E., Braucher, R., Grancher, D., Bourl`es, D., Braconnot, P., and Vuille, M.: Irregular tropi-cal glacier retreat over the Holocene epoch driven by progressive warming, Nature, 474, 196–199, 2011.
Jorgensen, P. M. and Leon-Yanez, S.: Catalogue of the vascular plants of Ecuador, Missouri Botanical Garden, Saint Louis Mis-souri USA, 1999.
Jorgensen, P. M. and Ulloa Ulloa, C.: Seed plants of the high An-des of Ecuador. A check list. Dpt of Systematic Botany, Univ. of Aarhus in coll. with Dpto Ciencias Biologicas, PUCE, Quito, Ecuador, 1994.
J¨oris, O. and Weninger, B.: Extension of the14C calibration curve to ca. 40,000 cal BC by synchronizing Greenland18O/16O ice core records and North Atlantic foraminifera profiles: A comparison with U/Th coral data, Radiocarbon, 40, 495–504, 1998. Kuentz, A.: Dynamiques actuelle et holoc`ene de la puna (Andes
s`eches du P´erou) `a partir des observations de terrain, de la car-tographie (SIG) et de la palynologie (r´egion du Nevado Corop-una), Universit´e Blaise Pascal, Clermont-Ferrand, 256 pp., 2009.
Kuentz, A., Ledru, M.-P., and Thouret, J. C.: Environmental changes in the highland of the western Andean Cordillera (south Peru) during the Holocene, The Holocene, 22, 1215–1226, 2012. Liu, K.-B., Reese, C. A., and Thompson, L. G.: Ice-core pollen record of climatic changes in the central Andes during the last 400 yr, Quaternary Res., 64, 272–278, 2005.
Mann, M. E., Zhang, Z., Rutherford, S., Bradley, R. S., Hughes, M. K., Shindell, D. T., Ammann, C., Faluvegi, G., and Ni, F.: Global signatures and dynamical origins of the Little Ice Age and Medieval Climate Anomaly, Science, 326, 1256–1260, 2009. Marengo, J. A.: Long-term trends and cycles in the
hydrometeorol-ogy of the Amazon basin since the late 1920’s, Hydrol. Process., 23, 3236–3244, 2009.
Marengo, J. A. and Nobre, C. A.: General characteristics and vari-ability of climate in the Amazon basin and its links to the global climate system, The biogeochemistry of the Amazon Basin, edited by: Mcclain, M. E., Victoria, R. L., and Richey, J. E., Ox-ford University Press, 2001.
Morales, M. S., Christie, D. A., Villalba, R., Argollo, J., Pacajes, J., Silva, J. S., Alvarez, C. A., Llancabure, J. C., and Soliz Gam-boa, C. C.: Precipitation changes in the South American Alti-plano since 1300 AD reconstructed by tree-rings, Clim. Past, 8, 653–666, doi:10.5194/cp-8-653-2012, 2012.
Moscol Oliveira, M. and Hooghiemstra, H.: Three millennia upper forest line changes in northern Ecuador: Pollen records and al-titudinal vegetation distributions, Rev. Palaeobot. Palynol., 163, 113–126, 2010.
Mothes, P. A. and Hall, M. L.: The plinian fallout associated with Quilotoa’s 800 yr BP eruption, Ecuadorian Andes, J. Volcanol. Geotherm. Res., 176, 56–69, 2008.
Moy, C. M., Seltzer, G. O., Rodbell, D. T., and Anderson, D. M.: Variability of El Ni˜no/Southern Oscillation activity at millennial timescales during the Holocene epoch, Nature, 420, 162–165, 2002.
Neukom, R. and Gergis, J.: Southern Hemisphere high-resolution palaeoclimate records of the last 2000 years, The Holocene, 22, 501–524, 2012.
Ortu˜no, T.: Relation v´eg´etation pollen climat dans les ´ecor´egions de Bolivie. Master FENEC, University of Montpellier 2, France, 45 pp., 2008.
Ortu˜no, T., Ledru, M.-P., Cheddadi, R., Kuentz, A., Favier, C., and Beck, S.: Modern pollen rain, vegetation and climate in Bolivian ecoregions, Rev. Palaeobot. Palynol., 165, 61–74, 2011. Polissar, P. J., Abbott, M. B., Wolfe, A. P., Bezada, M., Rull, V., and
Bradley, R. S.: Solar modulation of Little Ice Age climate in the tropical Andes, Proc. Natl. Acad. Sci., 103, 8937–8942, 2006. Reese, C. A. and Liu, K.-B.: A modern pollen rain study from the
central Andes region of South America, J. Biogeogr., 32, 709– 718, 2005.
Reuter, J., Stott, L., Khider, D., Sinha, A., Cheng, H., and Edwards, R. L.: A new perspective on the hydroclimate variability in north-ern South America during the Little Ice Age, Geophys. Res. Lett., 36, L21706, doi:10.1029/2009GL041051, 2009.
Robin, C., Samaniego, P., Le Pennec, J.-L., Mothes, P. A., and Van Der Plicht, J.: Late Holocene phases of dome growth and plinian activity at Guagua Pichincha volcano (Ecuador), J. Vol-canol. Geotherm. Res., 176, 7–15, 2008.
constraints on the evolution of the Pichincha volcanic com-plex (Ecuador), B. Volcanol., 72, 1109–1129, 2010.
Rodbell, D. T., Seltzer, G. O., Anderson, D. M., Abbott, M. B., En-field, D. B., and Newman, J. H.: An∼15,000-year record of El Ni˜no-driven alluviation in southwestern Ecuador, Science, 283, 516–520, 1999.
Romoleyroux, K.: Extensi´on y Biodiversidad flor´ıstica de los Bosques dePolylepisen Oyacachi, Noreste del Ecuador Diciem-bre 2008–Junio 2009, project report, PUCE, Quito, Ecuador, 2009.
Sachs, J. P., Sachse, D., Smittenberg, R. H., Zhang, Z., Battisti, D. S., and Golubic, S.: Southward movement of the Pacific in-tertropical convergence zone ad 1400–1850, Nat. Geosci., 2, 519–525, 2009.
Samaniego, P., Robin, C., Chazot, G., Bourdon, E., and Cotten, J.: Evolving metasomatic agent in the Northern Andean sub-duction zone, deduced from magma composition of the long-lived Pichincha volcanic complex (Ecuador), Contrib. Mineral. Petr., 160, 239–260, 2010.
Seager, R., Burgman, R., Kushnir, Y., Clement, A. C., Cook, E. R., Naik, N., and Miller, J.: Tropical Pacific forcing of North Ameri-can medieval megadroughts: Testing the concept with an atmop-shere model forced by coral-reconstructed SSTs, J. Climate, 21, 6175–6190, 2008.
Stuiver, M., Reimer, P. J., Bard, E., Beck, J. W., Burr, G. S., Hughen, K. A., Kromer, B., McCormac, F. G., and Van Der Plicht, J.: Int-cal 98 radiocarbonage Int-calibration 24,000–0 Int-cal BP, Radiocarbon, 40, 1127–1151, 1998.
Stuiver, M., Reimer, P. J., and Reimer, R.: Calib radiocarbon calibration program rev.6.0.1., available at: http://calib.Qub.Ac, Uk/calib, Radiocarbon, 35, 215–230, 2011.
Urrutia, R. and Vuille, M.: Climate change projections for the trop-ical Andes using a regional climate model: Temperature and pre-cipitation simulations for the end of the 21st century, J. Geophys. Res., 114, D02108, doi:10.1029/2008JD011021, 2009.
Vimeux, F., Ginot, P., Schwikowski, M., Vuille, M., Hoffmann, G., Thompson, L. G., and Schotterer, U.: Climate variability during the last 1000 years inferred from Andean ice cores: A review of methodology and recent results, Palaeogeogr. Palaeocl., 281, 229–241, 2009.
Vuille, M., Bradley, R. S., and Keimig, F.: Climatic variability in the Andes of Ecuador and its relation to tropical Pacific and Atlantic sea surface temperature anomalies, J. Climate, 13, 2520–2535, 2000.