CPD
9, 507–523, 2013Temperature changes of the past
2000 yr
Q. Ge et al.
Title Page
Abstract Introduction
Conclusions References
Tables Figures
◭ ◮
◭ ◮
Back Close
Full Screen / Esc
Printer-friendly Version Interactive Discussion
Discussion
P
a
per
|
Dis
cussion
P
a
per
|
Discussion
P
a
per
|
Discussio
n
P
a
per
|
Clim. Past Discuss., 9, 507–523, 2013 www.clim-past-discuss.net/9/507/2013/ doi:10.5194/cpd-9-507-2013
© Author(s) 2013. CC Attribution 3.0 License.
Climate of the Past Discussions
This discussion paper is/has been under review for the journal Climate of the Past (CP). Please refer to the corresponding final paper in CP if available.
Temperature changes of the past 2000 yr
in China and comparison with Northern
Hemisphere
Q. Ge, Z. Hao, J. Zheng, and X. Shao
Institute of Geographic Sciences and Natural Resources Research, Chinese Academy of Sciences, 11A Datun Road, Chaoyang District, Beijing 100101, China
Received: 12 December 2012 – Accepted: 13 January 2013 – Published: 24 January 2013 Correspondence to: Z. Hao ([email protected])
CPD
9, 507–523, 2013Temperature changes of the past
2000 yr
Q. Ge et al.
Title Page
Abstract Introduction
Conclusions References
Tables Figures
◭ ◮
◭ ◮
Back Close
Full Screen / Esc
Printer-friendly Version Interactive Discussion
Discussion
P
a
per
|
Dis
cussion
P
a
per
|
Discussion
P
a
per
|
Discussio
n
P
a
per
|
Abstract
In this paper, we use principal components and partial least squares regression anal-ysis to reconstruct a composite profile of temperature variations in China, and the as-sociated uncertainties, at a decadal resolution over the past 2000 yr. Our aim is to contribute a new temperature time series to the paleoclimatic strand of the Asia2K
5
working group, which is part of the PAGES (Past Global Changes) project. The recon-struction was developed using proxy temperature data, with relatively high confidence levels, from five locations across China, and an observed temperature dataset pro-vided by Chinese Meteorological Administration covering the decades from the 1870s to the 1990s. Relative to the 1870s–1990s climatology, our two reconstructions both
10
show three warm intervals during the 270s–390s, 1080s–1210s, and after the 1920s; temperatures in the 260s–400s, 560s–730s and 970s–1250s were comparable with those of the Present Warm Period. Temperature variations over China are typically in phase with those of the Northern Hemisphere (NH) after 1100, a period which covers the Medieval Climate Anomaly, Little Ice Age, and Present Warm Period. The recent
15
rapid warming trend that developed between the 1840s and the 1930s occurred at a rate of 0.91◦C/100 yr. The temperature di
fference between the cold spell (−0.74◦C
in the 1650s) during the Little Ice Age, and the warm peak of the Present Warm Period (0.08◦C in the 1990s) is 0.82◦C at a centennial time scale.
1 Introduction
20
The use of multiple types of proxy data to reconstruct temperature records covering the past few millennia over large geographic regions is a relatively new area of scientific re-search (National Rere-search Council, 2006). Regional reconstructions that increase the spatial coverage of individual datasets would be a major step towards the development of a more accurate dataset (PAGES, 2009) that would reduce the uncertainties
asso-25
CPD
9, 507–523, 2013Temperature changes of the past
2000 yr
Q. Ge et al.
Title Page
Abstract Introduction
Conclusions References
Tables Figures
◭ ◮
◭ ◮
Back Close
Full Screen / Esc
Printer-friendly Version Interactive Discussion
Discussion
P
a
per
|
Dis
cussion
P
a
per
|
Discussion
P
a
per
|
Discussio
n
P
a
per
|
patterns of global temperature changes (Mann et al., 2009). Consequently, the Past Global Changes (PAGES) project established eight regional working groups to form a collaborative global network that aims to synthesize data on climate variability from the past 2000 yr. During the Asia2k workshop held on 9–12 January, 2012, the paleo-climate scientists of China were assigned the task of completing the reconstruction of
5
the time series of temperature changes during the past 2000 yr. Their results will con-tribute to the meaningful analysis of temperature change in the Northern Hemisphere (NH), and to a better understanding of geographical differences between neighboring areas.
Since the 1970s, scientists have reconstructed a number of time series showing
sur-10
face temperature variations in China over the last two millennia using natural proxies, such as tree rings, ice cores, lake sediments, and stalagmites, as well as archaeolog-ical evidence and historarchaeolog-ical documents (Chu, 1973; Shao and Wu, 1994; Yao et al., 1996; Zhang, 1996). Based on these temperature proxies, two composite temperature reconstructions covering the whole of China for the past 2000 yr were derived by Yang
15
et al. (2002) and Wang et al. (2007). However, the limited availability of temperature proxies and reconstruction approaches led to differences between the two reconstruc-tions. In recent decades, there has been an increasing number of reconstructions at individual sites, or over small areas, based on natural proxies, allowing proxy records to be updated, and providing the opportunity to reappraise previous reconstructions
20
of past temperatures in China using the enlarged proxy dataset and new spatial and temporal statistical techniques that are now available.
The uncertainties associated with the reconstructed temperature record for China over the past 2000 yr have been evaluated (Ge et al., 2010), and coherent temperature records from five regions (Northeast, Central East, Southeast, and Northwest China,
25
CPD
9, 507–523, 2013Temperature changes of the past
2000 yr
Q. Ge et al.
Title Page
Abstract Introduction
Conclusions References
Tables Figures
◭ ◮
◭ ◮
Back Close
Full Screen / Esc
Printer-friendly Version Interactive Discussion
Discussion
P
a
per
|
Dis
cussion
P
a
per
|
Discussion
P
a
per
|
Discussio
n
P
a
per
|
reconstructions. We will also compare the temperature record at a centennial timescale with that of the NH, in particular, during the Medieval Climate Anomaly (MCA), the Little Ice Age (LIA), and the Present Warm Period (PWP), and identify the differences and similarities between the patterns of temperature changes seen in China and the NH.
2 Data and methods
5
Ge et al. (2010) divided China into five regions: Northeast (NE), Central East (CE), South East (SE), Northwest (NW), and the Tibet Plateau (TP), based on their geo-graphic locations and temperature characteristics, to systematically evaluate the simi-larities and differences in the temperature record at the inter-regional scale. The tem-perature anomalies with respect to the 1900s–1950s climatology, at a decadal
resolu-10
tion, in NE from AD 0s to AD 1980s, CE from AD 0s to AD 1990s, and SE from AD 1470s to AD 1950s will be the focus of this study. Among them, the data from NE and SE were extended to the 1990s based on the warm/cold records obtained from his-torical documents (Hao et al., 2011). In TP and NW, some of the original temperature proxies have been updated (Thompson et al., 2000, 2003, 2006; Shen et al., 2001;
15
Wang et al., 2006; Liu et al., 2006; Zhu et al., 2008; Liu et al., 2011 in TP, 2005 in NW), and we were able to re-evaluate the records of temperature change in these two regions using the method of Ge et al. (2010). The decadal temperature time series runs from the 0s to the 1990s in TP and from the 900s to the 1990s in NW. As the start point of the records varied from region to region, the procedure used to reconstruct
20
the temperature record for the whole of China was divided three sections based on the available datasets; i.e. TP, CE, and NE were used for the period from the 0s to the 890s, TP, CE, NW, and NE between the 900s and the 1460s, and all five regions from the 1470s to the 1990s.
The annual temperature changes from the 1870s to the 1990s were obtained from
25
CPD
9, 507–523, 2013Temperature changes of the past
2000 yr
Q. Ge et al.
Title Page
Abstract Introduction
Conclusions References
Tables Figures
◭ ◮
◭ ◮
Back Close
Full Screen / Esc
Printer-friendly Version Interactive Discussion
Discussion
P
a
per
|
Dis
cussion
P
a
per
|
Discussion
P
a
per
|
Discussio
n
P
a
per
|
China covering 711 stations, and among these the data were available from 165 sta-tions before and after 1951, 165 stasta-tions after 1951, and 381 stasta-tions before 1951 (Lin et al., 1995). The mean decadal values from this dataset between the 1870s and 1990s were used to develop the reconstruction model and in the calibration and verification of the temperatures.
5
We reconstructed the temperature profiles using the PLS and PCR approaches, which are the two most commonly used methods for biased regression analysis. PLS usually requires fewer components and gives a lower prediction error than PCR, and was recommended for the quantitative reconstruction of paleoenvironmental data by Birks (1995). The optimal (selected) number of PLS components is estimated by
leave-10
one-out cross-validation (Michaelsen, 1987) on the basis of the low prediction error sum-of-square and high predictedR2. We used MINITAB to perform the PLS and PCR
analysis, and the results are listed in Table 1. The predictors are the reconstructed temperature series from the five regions at a decadal time resolution (from Ge et al., 2010). The predictand for the model fitting from the 1870s to the 1990s was the mean
15
decadal temperature for China calculated by the CMA. For the PCR method, the first two components were selected to build the regression models, and their cumulative contribution rate of variance was 86 % during the period 0s–890s, 75 % during the 900s–1460s, and 73 % during the 1470s–1990s. To resolve the problem of inhomo-geneity within the reconstructions caused by the variation in the number of predictors
20
analyzed, we adjusted the mean value and variance to the same level as the common period; i.e. the 1470s to the 1990s.
3 Results
Figure 2 contains a plot of the decadal temperature variations (with respect to the mean value for the period 0s–1990s), and the centennial temperature signal smoothed by a
5-25
CPD
9, 507–523, 2013Temperature changes of the past
2000 yr
Q. Ge et al.
Title Page
Abstract Introduction
Conclusions References
Tables Figures
◭ ◮
◭ ◮
Back Close
Full Screen / Esc
Printer-friendly Version Interactive Discussion
Discussion
P
a
per
|
Dis
cussion
P
a
per
|
Discussion
P
a
per
|
Discussio
n
P
a
per
|
here have a temporal resolution of 1–30 yr (Ge et al., 2010), it is more appropriate to consider variations in the temperature signal over a centennial time scale. Relative to the referenced climatology from the 1870s to the 1990s, the PCR reconstruction con-tained three warm intervals (270s–390s, 1080s–1210s, and 1920s–1990s) and three cold intervals (0s–260s, 400s–1070s, and 1220s–1910s). The amplitude of the
tem-5
perature change (difference from low to high) was 1.51◦C. Two warm episodes that
appear to be similar to the 20th century climatology are centered on the periods from the 270s to the 390s, and from the 1080s to the 1210s. The PLS centennial recon-struction shows four warm intervals (0s–410s, 540s–730s, 960s–1260s, and after the 1920s) and three cold intervals (420s–530s, 740s–950s, and 1270s-1910s, which was
10
interrupted by a short warm period from 1730s-1760s). The amplitude of temperature variations during the past 2000 yr was 1.48◦C, which is close to seen in the PCR
re-construction. The 20th century was the fourth warmest period in this sequence, with the warmest three (in ascending order) being the 260s–400s, 970s–1250s, and 560s– 730s.
15
By comparing the results from the two reconstructions, several periods of consistent warming or cooling can be identified; e.g. warming periods between the 270s–390s, 1080s–1210s, and after the 1920s, and cooling periods between the 420s–530s, 740s-950s, and 1270s–1910s. The correlation coefficient between the two reconstructions is 0.90, and exceeds the 95 % confidence level. The temperature difference between
20
the two reconstructions was less than 0.2◦C in 40 % of the decades (data points),
while significant differences (ca. 0.4◦C) in 20 % of the decades were evident between
the 120s–170s, 620s–740s, 1010s–1060s, 1200s–1280s, and 1720s–1770s. These results indicate that differences in reconstruction methods and the predictive ability of the fitting models could affect the pattern of temperature variations; e.g. PCR was more
25
CPD
9, 507–523, 2013Temperature changes of the past
2000 yr
Q. Ge et al.
Title Page
Abstract Introduction
Conclusions References
Tables Figures
◭ ◮
◭ ◮
Back Close
Full Screen / Esc
Printer-friendly Version Interactive Discussion
Discussion
P
a
per
|
Dis
cussion
P
a
per
|
Discussion
P
a
per
|
Discussio
n
P
a
per
|
were high in some periods, where the original sources of temperature data were in-consistent. In addition, PLS has higher variance explanation and has a higher variation amplitude than PCR, and so may go some way towards alleviating the problem of the underestimation of low frequency variations inherent in other reconstruction meth-ods (e.g. Christiansen et al., 2009). And the third, those perimeth-ods with large differences
5
(>0.4◦C) and uncertainties all occurred in the warming intervals, which indicated that
the proxies could well reflect the cold climate conditions, while for the warm climate, they did not show consistent temperature trend.
4 Comparison with other reconstructions
We compared our composite temperature record with two series published previously
10
by other Chinese paleoclimatologists. First, Yang et al. (2002) developed three se-ries that presented temperature variations (standard deviation rather than temperature anomaly) based on nine individual temperature reconstructions (four from the Tibet Plateau, two from Eastern China, and other three from outside of China mainland) from multi-proxy records that were analyzed using three different statistical methods.
Sec-15
ond, Wang et al. (2007) divided China into 10 subregions based on regional climate and temperature changes. The temperature series for each subregion were reconstructed individually before the 10 series were combined to generate the temperature series for the entire country using area-weighted subregional temperature records. However, the important climatic periods of the MCA (1000s–1250s) and the LIA (1700s–1850s) are
20
not represented consistently by these two studies because of differences in the recon-struction methods and proxies used. Compared with Yang et al. (2002), our reconstruc-tion used new, recently published, temperature proxies, especially from Eastern China, with a higher spatial resolution. Figure 3 plots these temperature anomalies (with re-spect to the mean value of the climatology between the 1870s and 1960s) smoothed by
25
CPD
9, 507–523, 2013Temperature changes of the past
2000 yr
Q. Ge et al.
Title Page
Abstract Introduction
Conclusions References
Tables Figures
◭ ◮
◭ ◮
Back Close
Full Screen / Esc
Printer-friendly Version Interactive Discussion
Discussion
P
a
per
|
Dis
cussion
P
a
per
|
Discussion
P
a
per
|
Discussio
n
P
a
per
|
and Wang et al. (2007), are 0.33 (0.42) from the 0s to the 1990s, and 0.67 (0.48) from the 1000s to the 1990s, respectively. All correlation coefficients exceed the α=0.01 significance level. From the 1600s to the 1990s, the four series show good agreement with each other, and all present the warming trends from the LIA to the PWP well, de-spite the different warming rates per century. For example, the correlation coefficient
5
is 0.98 between Wang et al. (2007) and PCR, and 0.89 between Yang et al. (2002) and PCR, while it is 0.76 between Wang et al. (2007) and PLS, and 0.82 between Yang et al. (2002) and PLS. However, large difference can be detected in the period between the 1000s and 1400s, which indicates that temperature reconstructions for the MCA still contain large uncertainties due to the low number of proxy samples. For example, the
10
correlation coefficient is 0.03 between Wang et al. (2007) and PCR, and−0.2 between
Yang et al. (2002) and PCR, while it is 0.24 between Wang et al. (2007) and PLS, and
−0.03 between Yang et al. (2002) and PLS. However, three of the four series (except
Wang et al., 2007) show that, in terms of the past 2000 yr, temperature levels during the 20th century have not been especially unusual, and in particular, temperatures
dur-15
ing the period 1000s–1250s were closely comparable, although the timing of the peak warm period varied among them. Seeing from the procedure of temperature variations, our reconstructions more clearly identified the warming peak during the MCA than did Wang et al. (2007), and also increased the amplitude of the temperature variations from the 1000s to the 1990s. When compared with Yang et al. (2002), our reconstructions
20
showed a longer Roman Warm Period, which ended in the 410s, and provided absolute temperature values rather than relative temperature variations (standard deviation).
We will now consider the consistency of temperature variations between China, its neighboring areas, and the NH. Patterns of temperature variation and their associ-ated uncertainty for most of the NH reconstructions were analyzed in the National
25
CPD
9, 507–523, 2013Temperature changes of the past
2000 yr
Q. Ge et al.
Title Page
Abstract Introduction
Conclusions References
Tables Figures
◭ ◮
◭ ◮
Back Close
Full Screen / Esc
Printer-friendly Version Interactive Discussion
Discussion
P
a
per
|
Dis
cussion
P
a
per
|
Discussion
P
a
per
|
Discussio
n
P
a
per
|
Ljungqvist, 2010; Mcshane and Wyner, 2011; Christiansen and Ljungqvist, 2012). We selected four temperature series from these studies to compare with our PLS recon-structions, and we refer to them below by the author’s surname (first letter of surname for two or three authors) and year of publication, as follows: MZH2008 (EIV land recon-struction in Mann et al., 2008), Ljungqvist2010, MW2011, and CL2012. In Fig. 3, the
5
smoothed 200-yr correlation coefficients show that the PLS reconstruction is closely correlated with MZH2008, Ljungqvist2010, MW2011, and CL2012 from the 1100s to the 1990s; the highest correlation coefficient was 0.81 between the PLS reconstruction and Ljungqvist2010. These findings indicate that the pattern of temperature changes in China is consistent with that in the NH after the 1100s, and the warming trend
dur-10
ing the PWP in both the NH and China started at the middle of the 19th century. In particular, the four NH temperature reconstructions all show that temperatures during the MCA seem to have reached, or exceeded, those of the PWP. Before the 1100s, China is well correlated with the NH during two periods, namely the 400s–700s and the 820s–1100s. For example, the coefficient is 0.81 between our PLS reconstruction
15
and Ljungqvist2010 from the 400s to the 700s, and 0.78 from the 760s to the 1060s. It is worth noting that a unique warm episode occurred in China during the 540s–730s, during which temperatures approached those of the 20th century.
In addition, a comparison between our PLS reconstruction and the Mongolian tem-perature record inferred from the chronology of tree-ring widths in a Siberian Pine,
20
showed an interesting, and very close, agreement after 1500 (i.e. the cold spell in the 1500s–1600s, warmth in the 1700s, cold spell in the 1800s, and sustained warmth in the 1900s; D’Arrigo et al., 2001). A comparison, starting in the 9th century, between the PLS reconstruction, and springtime temperatures based on phenological data from the flowering of cherry trees in Kyoto, Japan (Aono and Kazui, 2008), shows the same
25
CPD
9, 507–523, 2013Temperature changes of the past
2000 yr
Q. Ge et al.
Title Page
Abstract Introduction
Conclusions References
Tables Figures
◭ ◮
◭ ◮
Back Close
Full Screen / Esc
Printer-friendly Version Interactive Discussion
Discussion
P
a
per
|
Dis
cussion
P
a
per
|
Discussion
P
a
per
|
Discussio
n
P
a
per
|
beginning of the 16th century, and the PWP warming during the 20th century, within China, its neighboring areas, and the NH.
5 Conclusions
Our PCR and PLS temperature reconstructions for China over the past 2000 years show several key decadal-scale characteristics, including three warm intervals
cov-5
ering the 270s–390s, 1080s–1210s, and after the 1920s, and three cold spells dur-ing the 420s–530s, 740s–950s, and 1270s–1910s. We found that the warmdur-ing ob-served during the 20th century is not particularly unusual within the context of the past 2000 yr, and other notable periods of comparable warmth occurred during the 260s–400s, 560s–730s, and 970s–1250s, but are associated with large uncertainties.
10
The most two coldest periods were centered at 1610s–1650s and 1810s–1840s. The difference between the minimum temperature in the LIA and the maximum tempera-ture in the PWP was 0.8◦C in the PLS reconstruction, and 1.0◦C in the PCR
recon-struction on a centennial time scale. The recent century of rapid warming between the 1840s and 1930s occurred at a rate of 0.82◦C 100 yr−1in the PCR reconstruction and
15
0.91◦C 100 yr−1in the PLS reconstruction, and represents a transition period from the
LIA to PWP.
The typical variations in temperature during the MCA, LIA, and PWP in China were consistent with those in the NH, although the exact timings differed. Before the 1100s, only two periods (the 0s–410s and the 720s–810s) have inconsistent temperature
20
changing procedures, but the warming during the 560s–730s in China was more pro-nounced than in the NH. After the 1500s, the pattern of temperature variation in China is in good agreement with neighboring areas, including Mongolia and Japan, in terms of the timing of cold spells and warm intervals, and a coherent trend is also evident in the cooling of the 1800s and warming in the 1900s. However, before the 1500s,
25
CPD
9, 507–523, 2013Temperature changes of the past
2000 yr
Q. Ge et al.
Title Page
Abstract Introduction
Conclusions References
Tables Figures
◭ ◮
◭ ◮
Back Close
Full Screen / Esc
Printer-friendly Version Interactive Discussion
Discussion
P
a
per
|
Dis
cussion
P
a
per
|
Discussion
P
a
per
|
Discussio
n
P
a
per
|
increase the accuracy of the reconstruction, at least in East Asia, and especially during the MCA.
Acknowledgements. This research was supported by grants to IGSNRR from the Ministry of Science and Technology of the People’s Republic of China (2010CB950100), the Chinese Academy of Sciences (XDA05080100), and the National Natural Science Foundation of China
5
(41071029).
References
Aono, Y. and Kazui, K.: Phenological data series of cherry tree flowering in Kyoto, Japan, and its application to reconstruction of springtime temperatures since the 9th century, Int. J. Cli-matol., 28, 905–914, 2008.
10
Birks, H. J. B.: Quantitative paleoenvironmental reconstruction, in: Statistical Modeling of Qua-ternary Science Data, edited by: Maddy, D. and Brew, J. S., Cambridge, UK, 161–254, 1995. Christiansen, B. and Ljungqvist, F. C.: The extra-tropical Northern Hemisphere temperature in
the last two millennia: reconstructions of low-frequency variability, Clim. Past, 8, 765–786, doi:10.5194/cp-8-765-2012, 2012.
15
Christiansen, B., Schmith, T., and Thejll, P.: A surrogate ensemble study of climate reconstruc-tion methods: stochasticity and robustness, J. Climate, 22, 951–976, 2009.
Chu, K.: A preliminary study on the climatic fluctuations during the last 5000 years in China, Sci. China Ser. A, 16, 226–256, 1973.
D’Arrigo, R., Jacoby, G., Frank, D., Pederson, N., Cook, E., Buckley, B., Nachin, B., Mijiddorj, R.,
20
and Dugarjav, C.: 1738 years of Mongolian temperature variability inferred from a tree-ring width chronology of Siberian Pine, Geophys. Res. Lett., 28, 543–546, 2001.
Ge, Q. S., Zheng, J. Y., Hao, Z. X., Shao, X. M., Wang, W. C., and Luterbacher, J.: Temperature variation through 2000 years in China: an uncertainty analysis of reconstruction and regional difference, Geophys. Res. Lett., 37, L03703, doi:10.1029/2009GL041281, 2010.
25
Hao, Z. X., Zheng, J. Y., and Ge, Q. S.: Historical analogues of the 2008 extreme snow event over Central and Southern China, Clim. Res., 50, 161–170, doi:10.3354/cr01052, 2011. Jansen, E., Overpeck, J., Briffa, K. R., Duplessy, J.-C., Joos, F., Masson-Delmotte, V., Olago, D.,
Otto-Bliesner, B., Peltier, W. R., Rahmstorf, S., Ramesh, R., Raynaud, D., Rind, D., Solom-ina, O., Villalba, R., and Zhang, D.: Palaeoclimate, in: Climate Change 2007: The Physical
CPD
9, 507–523, 2013Temperature changes of the past
2000 yr
Q. Ge et al.
Title Page
Abstract Introduction
Conclusions References
Tables Figures
◭ ◮
◭ ◮
Back Close
Full Screen / Esc
Printer-friendly Version Interactive Discussion
Discussion
P
a
per
|
Dis
cussion
P
a
per
|
Discussion
P
a
per
|
Discussio
n
P
a
per
|
Science Basis. Contribution of Working Group I to the Fourth Assessment Report of the In-tergovernmental Panel on Climate Change, edited by: Solomon, S., Qin, D., Manning, M., Chen, Z., Marquis, M., Averyt, K. B., Tignor, M., and Miller, H. L., Cambridge University Press, Cambridge, UK and New York, NY, USA, 2007.
Lin, X. C., Yu, S. Q., and Tang, G. L.: Series of average air temperature over China for the last
5
100-year period, Sci. Atmos. Sinica, 19, 525–534, 1995.
Liu, X. H., Qin, D. H., Shao, X. M., Chen, T., and Ren, J. W.: Temperature variations recovered from tree-rings in the middle Qilian Mountain over the last millennium, Sci. China Ser. D, 48, 521–529, 2005.
Liu, Y., Cai, Q. F., Song, H. M., An, Z. S., and Linderholm, H. W.: Amplitudes, rates, periodicities
10
and causes of temperature variations in the past 2485 years and future trends over the central-eastern Tibetan Plateau, Chinese Sci. Bull., 56, 2986–2994, doi:10.1007/s11434-011-4713-7, 2011,
Liu, Z., Henderson, A., and Huang, Y.: Alkenone-based reconstruction of late-Holocene surface temperature and salinity changes in Lake Qinghai, China, Geophys. Res. Lett., 33, L09707,
15
doi:10.1029/2006GL026151, 2006
Ljungqvist, F. C.: A new reconstruction of temperature variability in the extra-tropical Northern Hemisphere during the last two millennia, Geogr. Ann. A, 92, 339–351, 2010
Mann, M. E., Zhang, Z., Hughes, M. K., Bradley, R. S., Miller, S. K., Rutherford, S., and Ni, F. B.: Proxy-based reconstructions of hemispheric and global surface temperature variations over
20
the past two millennia, P. Natl. Acad. Sci. USA, 105, 13252–13257, 2008.
Mann, M. E., Zhang, Z., Rutherford, S., Bradley, R. S., Hughes, M. K., Shindell, D., Ammann, C., Faluvegi, G., and Ni, F.: Global signatures and dynamical origins of the Little Ice Age and Medieval Climate Anomaly, Science, 326, 1256–1260, 2009.
Mcshane, B. B. and Wyner, A. J.: A statistical analysis of multiple temperature proxies: are
25
reconstructions of surface temperatures over the last 1000 years reliable, Ann. Appl. Stat., 5, 5–44, 2011.
Michaelsen, J.: Cross-validation in statistical climate forecast models, J. Clim. Appl. Meteorol., 26, 1589–1600, 1987.
National Research Council: Surface Temperature Reconstructions for the Last 2000 Years, The
30
National Academies Press, Washington, DC, 141 pp., 2006
CPD
9, 507–523, 2013Temperature changes of the past
2000 yr
Q. Ge et al.
Title Page
Abstract Introduction
Conclusions References
Tables Figures
◭ ◮
◭ ◮
Back Close
Full Screen / Esc
Printer-friendly Version Interactive Discussion
Discussion
P
a
per
|
Dis
cussion
P
a
per
|
Discussion
P
a
per
|
Discussio
n
P
a
per
|
Shao, X. M. and Wu, X. D.: Tree-ring chronologies forPinus armandi Franch from Huashan, China, Acta Geogr. Sin., 49, 174–181, 1994.
Shen, J., Zhang, E. L., and Xia, W. L.: Records from lake sediments of the Qinghai Lake to mirror climatic and environmental changes of the past about 1000 year, Quaternary Sci. Rev., 21, 508–513, 2001.
5
Tang, G. L., Ding, Y. H., Wang, S. W., Ren, G. Y., Liu, H. B., and Zhang, L.: Comparative analysis of the time series of surface air temperature over China for the last 100 years, Adv. Clim. Change Res., 5, 71–78. 2009.
Thompson, L. G., Mosley-Thompson, E., Davis, M. E., Lin, P. N., Henderson, K., and Mash-iotta, T. A.: Tropical glacier and ice core evidence of climate change on annual to millennial
10
time scales, Climatic Change, 59, 137–155, 2001
Thompson, L. G., Yao, T., Mosley-Thompson, E., Davis, M. E., Henderson, K. A., and Lin, P. N.: A high-resolution millennial record of the South Asian Monsoon from Himalayan ice cores, Science, 289, 1916–1919, 2000.
Thompson, L. G., Yao, T., Davis, M. E., Mosley-Thompson, E., Mashiotta, T. A., Lin, P. N.,
15
Mikhalenko, V. N., and Zagorodnov, V. S.: Holocene climate variability archived in the Puruo-gangri ice cap on the central Tibetan Plateau, Ann. Glaciol., 43, 61–69, 2006.
Wang, N. L., Yao, T. D., Pu, J. C., Zhang, Y. L., and Sun, W. Z.: Climatic and environmental changes over the last millennium recorded in the Malan ice core from the northern Tibetan Plateau, Sci. China Ser. D, 49, 1079–1089, 2006.
20
Wang, S. W., Wen, X. Y., Luo, Y., Dong, W. J., Zhao, Z. C., and Yang, B.: Reconstruction of temperature series of China for the last 1000 years, Chinese Sci. Bull., 52, 3272–3280, 2007.
Yang, B., Braeuning, A., Johnson, K. R., and Shi, Y. F.: General characteristics of tem-perature variation in China during the last two millennia, Geophys. Res. Lett., 29, 1324,
25
doi:10.1029/2001GL014485, 2002.
Yao, T., Thompson, L. G., Mosley-Thompson, E, Yang, Z., Zhang, X., and Lin, P.: Climatological significance ofδ18O in north Tibetan ice cores, J. Geophys. Res., 101, 29531–29537. 1996. Zhang, P. Y.: Climate change in China during historical times, Scientific and Technological
Press, Jinan, China, 435–436, 1996.
30
CPD
9, 507–523, 2013Temperature changes of the past
2000 yr
Q. Ge et al.
Title Page
Abstract Introduction
Conclusions References
Tables Figures
◭ ◮
◭ ◮
Back Close
Full Screen / Esc
Printer-friendly Version Interactive Discussion
Discussion
P
a
per
|
Dis
cussion
P
a
per
|
Discussion
P
a
per
|
Discussio
n
P
a
per
|
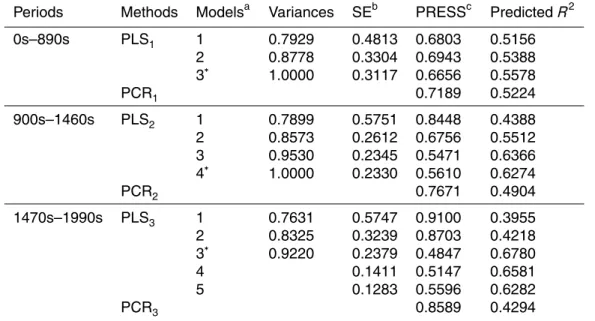
Table 1.Selected number of components from the PLS regression and the first two components from the PCR between proxies and observations. Verifications are based on the leave-one-out cross-validation method.
Periods Methods Modelsa Variances SEb PRESSc PredictedR2
0s–890s PLS1 1 0.7929 0.4813 0.6803 0.5156 2 0.8778 0.3304 0.6943 0.5388 3∗ 1.0000 0.3117 0.6656 0.5578
PCR1 0.7189 0.5224 900s–1460s PLS2 1 0.7899 0.5751 0.8448 0.4388 2 0.8573 0.2612 0.6756 0.5512 3 0.9530 0.2345 0.5471 0.6366 4∗ 1.0000 0.2330 0.5610 0.6274
PCR2 0.7671 0.4904 1470s–1990s PLS3 1 0.7631 0.5747 0.9100 0.3955 2 0.8325 0.3239 0.8703 0.4218 3∗ 0.9220 0.2379 0.4847 0.6780
4 0.1411 0.5147 0.6581 5 0.1283 0.5596 0.6282 PCR3 0.8589 0.4294
aAsterisks indicate the model with the highest predictedR2.
bSE
=standard error.
cPRESS
CPD
9, 507–523, 2013Temperature changes of the past
2000 yr
Q. Ge et al.
Title Page
Abstract Introduction
Conclusions References
Tables Figures
◭ ◮
◭ ◮
Back Close
Full Screen / Esc
Printer-friendly Version Interactive Discussion
Discussion
P
a
per
|
Dis
cussion
P
a
per
|
Discussion
P
a
per
|
Discussio
n
P
a
per
|
Fig. 1.The spatial distribution of the cited temperature proxies series and temperature changes at a centennial time scale (5-point FFT filter) in five regions of China (Northeast, Central East, South East, Northwest, and the Tibet Plateau). The y-axes show the temperature departure from 1900–1950 average. The decadal series are from Ge et al. (2010) and updated for the Tibet Plateau and Northwest China.
CPD
9, 507–523, 2013Temperature changes of the past
2000 yr
Q. Ge et al.
Title Page
Abstract Introduction
Conclusions References
Tables Figures
◭ ◮
◭ ◮
Back Close
Full Screen / Esc
Printer-friendly Version Interactive Discussion
Discussion
P
a
per
|
Dis
cussion
P
a
per
|
Discussion
P
a
per
|
Discussio
n
P
a
per
|
Fig. 2.Ensemble temperature reconstructions based on PLS (red line) and PCR (blue line) methods at decadal (slim lines) and centennial time scales (solid lines, smoothed by a 5-point FFT filter) along with uncertainties at the 95 % confidence level (shaded areas). The referenced value is the mean temperatures from the 1870s to the 1990s. The green line indicates the observed average air temperature.
CPD
9, 507–523, 2013Temperature changes of the past
2000 yr
Q. Ge et al.
Title Page
Abstract Introduction
Conclusions References
Tables Figures
◭ ◮
◭ ◮
Back Close
Full Screen / Esc
Printer-friendly Version Interactive Discussion
Discussion
P
a
per
|
Dis
cussion
P
a
per
|
Discussion
P
a
per
|
Discussio
n
P
a
per
|
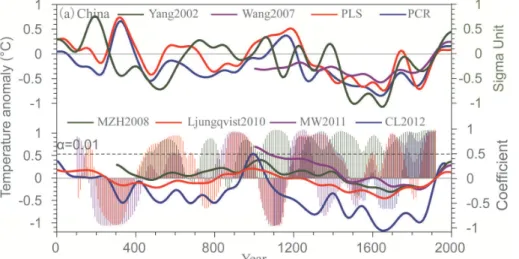
α
Fig. 3. Comparison of temperature reconstructions in China and the Northern Hemisphere. The referenced period is from the 1870s to the 1960s. The right y-axis marked with sigma unit is for Yang et al. (2002) series. The color lines are smoothed by a 5-point FFT filter, and color bars are 200-yr moving coefficients between PLS reconstruction and the corresponding NH reconstructions. The dotted line indicates theα=0.01 significance level.