Gene Expression Profile in the Liver of BALB/c
Mice Infected with
Fasciola hepatica
Jose Rojas-Caraballo1, Julio López-Abán1, Pedro Fernández-Soto1, Belén Vicente1, Francisco Collía2, Antonio Muro1*
1Instituto de Investigación Biomédica de Salamanca—Centro de Investigación de Enfermedades Tropicales de la Universidad de Salamanca (IBSAL-CIETUS), Facultad de Farmacia, Universidad de Salamanca, Salamanca, Castilla y León, España,2Departamento de Anatomía e Histología Humanas, Facultad de Medicina, Universidad de Salamanca, Salamanca, Castilla y León, España
*ama@usal.es
Abstract
Background
Fasciola hepaticainfection still remains one of the helminthic neglected tropical diseases (NTDs). It has a huge worldwide distribution, affecting mainly cattle and, sometimes, human beings. In addition to data reported about the immunological response induced by
helmin-thic infections and that induced byFasciola hepatica, little is known about the gene
expres-sion profile in its organ target, the liver, which is where adult worms are established and live for long periods of time, causing its characteristic pathology. In the present work, we study
both the early and late gene expression profiles in the livers of mice infected withF.hepatica
metacercariae using a microarray-based methodology.
Methodology
A total of 9 female-6-week-old BALB/c mice (Charles River Laboratories, Barcelona, Spain) weighing 20 to 35 g were used for the experiments. Two groups of BALB/c mice were orally
infected with sevenF.hepaticametacercariae, and the other group remained untreated and
served as a control. Mice were humanely euthanized and necropsied for liver recovery, his-tological assessment of hepatic damage, RNA isolation, microarray design and gene expression analysis on the day of infection (t0), seven days post-infection (t7) and twenty-one days post-infection (t21).
Results
We found thatF.hepaticainfection induces the differential expression of 128 genes in the
liver in the early stage of infection and 308 genes in the late stage, and most of them are up-regulated. The Ingenuity Pathway Analysis revealed significant changes in the pathways related to metabolism, biosynthesis and signaling as well as genes implicated in inducing liver-toxicity, injury and death.
OPEN ACCESS
Citation:Rojas-Caraballo J, López-Abán J, Fernández-Soto P, Vicente B, Collía F, Muro A (2015) Gene Expression Profile in the Liver of BALB/c Mice Infected withFasciola hepatica. PLoS ONE 10(8): e0134910. doi:10.1371/journal.pone.0134910
Editor:Patricia Talamas-Rohana, Centro de Investigacion y de Estudios Avanzados del Instituto Politecnico Nacional, MEXICO
Received:April 20, 2015
Accepted:July 15, 2015
Published:August 6, 2015
Copyright:© 2015 Rojas-Caraballo et al. This is an open access article distributed under the terms of the
Creative Commons Attribution License, which permits unrestricted use, distribution, and reproduction in any medium, provided the original author and source are credited.
Data Availability Statement:All relevant data are within the paper and its Supporting Information files.
Funding:The present study was supported by Fundación Ramón Areces, Madrid-Spain; Grant number: XV-2010-2013. (www.fundacionareces.es). The funders had no role in study design, data collection and analysis, decision to publish, or preparation of the manuscript.
Conclusion
The present study provides us insights at the molecular level about the underlying
mecha-nisms used byF.hepatica, leading to liver damage and its subsequent pathophysiology.
The expression pattern obtained here could also be used to explain the lack of association
between infection withF.hepaticaand cholangiocarcinoma. However, more studies should
be performed to confirm this hypothesis.
Introduction
Fasciolosis is considered one of the most widespread foodborne and waterborne trematodiasis worldwide. It is caused by flukes of the genusFasciola, beingFasciola hepaticaandFasciola giganticathe both species responsible for the disease, which mainly affects ruminants but can also affect humans, causing important economic losses in developing countries (estimated at over 3 billion dollars per year) [1,2]. Human fasciolosis is distributed in countries from South America (Andean countries), the Middle East (Egypt and Iran), the Asian continent and sub-Saharan Africa, where it is estimated that up to 17 million people are infected, and close to 170 million people live in areas with a high risk of infection [3–6].F.hepaticainfection occurs in the definitive host (animal and human) by a series of successful successive events, which determines the acute and chronic phases of fasciolosis, as follows:i)oral ingestion of some aquatic plants or water contaminated with the larval stages ofF.hepatica, the metacercariae;ii)excystment in the duodenum and migration through the intestinal wall, peritoneal cavity and Glisson’s capsule; andiii)entry into the liver parenchyma and establishment in the biliary ducts [7].
The acute phase is characterized by the process of migration, which causes liver and abdomi-nal peritoneum damage as the parasites move across these tissues. Some characteristic frequent symptoms at this stage include fever, abdominal pain and gastrointestinal disorders, but some respiratory-associated clinical disorders could appear, such as cough, dyspnea and chest pain [7,
8]. The chronic phase of fasciolosis is typically characterized by the establishment and matura-tion ofF.hepaticaworms into the biliary ducts of its definitive host. This stage of infection could last from several months to years. ChronicF.hepaticainfection causes hepatomegaly, gall-bladder and biliary duct thickening and dilatation, leading to cholangitis, cholecystitis and, usu-ally, the obstruction of the biliary ducts, causing hepatic dysfunction in some cases [7–9].
In the present study we are interested in testing the gene expression profile at both early (7 days, the parasite is still considered newly excysted juvenile, the macroscopic lesions in the liver starts to be evident and the immunomodulation induced by the parasite begins) and late (21 days, which corresponds to parasite migration through the hepatic parenchyma and subse-quent establishment of mature adults in the liver) stage of infection. However, literature reports concerning precise chronobiology ofF.hepaticadevelopment and migration in mice is still scarce and it could be variable from one mouse to another and also from one strain to another. There are previous reports in the literature describing some aspects from the chronobiology of
F.hepaticain mice [10,11].
effective vaccine represents one strategy for reducing the risk of infection. However, there are no commercial vaccines available even though significant progress has been made in the attempts to develop effective vaccines against infections that are caused by parasites. To date, only a few vaccines have been successfully tested against helminthic infection in animals [17–19].
Although the pathophysiology and immune response induced byF.hepaticainfection has been well characterized, little is known about the precise cellular and molecular mechanisms that lead to such pathology. A deeper understanding of the molecular mechanisms by whichF.
hepaticainfection occurs and induces liver pathology has become a priority for not only select-ing new drug-alternatives for treatment but also in the search for new vaccine candidates. In the present study, we used the mouse as experimental model due to its high susceptibility to acquire the infection to investigate the gene expression profile in the livers of mice that were orally infected withF.hepaticametacercariae at different times of infection using a microar-ray-based methodology to identify the set of genes involved in causing liver damage.
Materials and Methods
Ethics Statement
The animal procedures in this study complied with the Spanish (Real Decreto RD53/2013) and European Union (European Directive 2010/63/CE) guidelines regarding animal experimenta-tion for the protecexperimenta-tion and humane use of laboratory animals. The University of Salamanca’s accredited Animal Experimentation Facilities (Registration number PAE/SA/001) were used for such procedures. The University of Salamanca’s Ethics Committee also approved the proce-dures that were used in this study (Permit Number: 8402). The animals’health status was mon-itored throughout the experiments by a health surveillance program according to Federation of European Laboratory Animal Science Associations (FELASA) guidelines. All efforts were made to minimize suffering.
Experimental design, mice and parasites
A time-course experiment to investigate the gene expression profile over time in the liver of mice infected withF.hepaticametacercariae for three-different experimental groups was per-formed. We are interested in testing the gene expression profile at both early (7 days) and late (21 days) stage of infection. We also find interesting to investigate the immunological changes and the damage induced byF.hepaticaduring its migration through the host’s tissues by study-ing the transcriptome profile at this stages of infection.
Female, 6 week-old BALB/c mice (Charles River Laboratories, Barcelona, Spain) weighing 20 to 35 g were used for the experiments. Animals were maintained in the University of Sala-manca’s animal care facility and kept in plastic boxes with food and waterad libitum. The ani-mals were used in experiments after a period of 7 days of adaptation in captivity, with regular 12 h light–dark periods at 20°C (seeS1 File: NC3Rs ARRIVE Guidelines Checklist).F.hepatica
metacercariae were provided by Ridgeway Research Ltd (Gloucestershire, UK) and stored at 4°C on 0.4% carboxymethylcellulose until use. Metacercariae viability was confirmed by micro-scope observation before infection.
A total of 9 BALB/c mice were used in the present study and were randomly allocated into three experimental groups. Six mice were each orally infected with a volume of 30μL of PBS
solution containing fiveF.hepaticametacercariae and served as experimental groups. Three additional mice were used as uninfected controls and were orally administered with a volume of 30μL of PBS. The ssize.fdr package for R was used to estimate the sample size, taking into
Mice were humanely euthanized with an intraperitoneal injection of pentobarbital (60mg/ kg), according to standardized protocols supplied by the University of Salamanca’s Ethics Committee, at the beginning of the experiment (n = 3; uninfected controls; t0), at 7 days post infection (p.i) (n = 3; t7) and at 21 days p.i. (n = 3; t21). Procedures were carried out at Univer-sity of Salamanca’s Animal Experimentation Facility laboratories. To assess the success of the infection, an ELISA assay was carried out to detect specific antibodies raised against the excre-tory/secretory antigen fromF.hepaticaat the time of necropsy. The physical condition of ani-mals was daily monitored (twice a day) by our trained and qualified personnel on handling of animals used for experimentation.
The livers from each mouse were collected, visually examined and then preserved in either formalin or RNAlater solution for histological analysis and RNA isolation, respectively.
Histological Assessment
Representative samples were collected from the right and left liver lobes from each mouse to perform the histopathological studies, and both macroscopic and microscopic lesions were examined. These samples were fixed in 10% neutral-buffered formalin and embedded in paraf-fin wax. Sections (4μm) were stained with hematoxylin and eosin to determine the liver
dam-age areas.
RNA isolation, cDNA synthesis and array hybridization
Total RNA was isolated from liver tissues (40 mg) using the Gen Elute Mammalian Total RNA Miniprep Kit (Sigma, San Louis, USA), according to the manufacturer’s instructions. The RNA concentration was quantified using a NanoDrop ND-1000 spectrophotometer (NanoDrop Technologies), and the quality of each sample was assessed using an Agilent 2100 Bioanalyzer (Agilent Tech, Palo Alto, CA, USA) on the basis of the RNA integrity number (RIN). The sam-ples selected for further analysis had integrity factors (RIN) in the range of 7.3–10. Therefore, a total of nine individual liver RNA samples were used for cDNA synthesis and microarray analy-sis. Labeling and hybridizations were performed according to protocols from Affymetrix. Briefly, 100–300 ng of total RNA was amplified and labeled using the Ambion WT Expression Kit for Affymetrix GeneChip (Invitrogen) and then hybridized to the GeneChip Mouse Gene 1.0 ST Array (Lot. No. 4138271; Affymetrix). Washing and scanning were performed using the GeneChip Instrument System of Affymetrix (GeneChip Hybridization Oven 640, GeneChip Fluidics Station 450 and GeneChip Scanner 3000 7G). The 169-format GeneChip Mouse Gene 1.0 ST Array contained approximately 25 probes that were designed across the full length of 28,853 well-annotated genes for mouse. The design of the array was based on the February 2006 mouse genome sequence (UCSC mm8, NCBI build 36) with comprehensive coverage of RefSeq (http://www.affymetrix.com/support), putative complete CDS GenBank transcripts, all Ensembl transcript classes and synthetically mapped full-length mRNAs and RefSeq NMs from humans and rats. The GeneChip Mouse Gene 1.0 ST Array has 100 percent coverage of NM sequences present in the April 3, 2007 RefSeq database (http://www.affymetrix.com/support).
Microarray data analysis
After hybridization, scanning, and image acquisition, the data extracted from the raw images were analysed using the Expression Console software (Affymetrix), which enables probe set summarization as well as preliminary data quality evaluation. The resulting data (.CEL files) were further analyzed using the Babelomics V4.2 platform [21], which is freely accessible at
perfect match (PM) values using a robust multi-array average (RMA) methodology [22]. The intensity signal was standardized across arrays via the quantile normalization algorithm [23]. A comparison in the gene expression profile at each experimental time point was investi-gated, thus the following comparisons were performed: t0vst7, t0vst21 and t7vst21. It is worth to note that in the present study we do not provide the gene expression profile values at any individual time but we reported comparisons amongst the different times of sampling. Dif-ferential gene expression assessment of all comparisons was performed using Limma moder-ated t-statistics [24], reporting a t-test statistic for each gene together with its corresponding p-value (generally called raw p-p-values). These raw p-p-values were further corrected for multiple testing to minimize the number offalse positivesin the study. In this analysis, we used the con-ventional multiple testing p-value correction procedures proposed by Benjamini & Hochberg [25] to derive adjusted p-values. For functional profiling, each of the comparisons used here (t0
vst7; t0vst21 and t7vst21) were analysed using logistic regression models to identify the func-tional blocks that were enriched in any of the conditions [26,27].
Finally, the functional blocks from two databases, GO Biological Process (http://www. geneontology.org) and KEGG Pathways (http://www.genome.jp/kegg/), were used in the study. The Ingenuity Pathways Analysis (IPA) software v6.0 (Ingenuity Systems,www.ingenuity. com) was used to organize the genes that were regulated during the infection into networks of interacting molecules. The gene identifiers of the genes with a statistically significant change in expression (p-value<0.05) and with a calculated positive or negative fold change of at least
two-fold were uploaded in the software. These genes, called focus genes, were overlaid onto a global molecular network that was developed from the information contained in Ingenuity’s Knowledge Base. The networks were then algorithmically generated based on their connectiv-ity. Each network is assigned a score, a numerical value that ranks the networks according to how relevant they are to the genes in the uploaded dataset, which is determined according to the number of focus genes and size of the network. In addition, IPA was used for a functional analysis to identify the biological functions that were most significant to the uploaded datasets. The right tailed Fisher’s exact test was used to calculate a p-value for the probability that each biological function assigned to that dataset is due to chance alone.
PCR
RNA from each of the biological samples was reserved for reverse-transcription PCR to vali-date a subset of the microarray data. Total RNA from each mouse liver sample was reverse transcribed using the 1st Strand cDNA Synthesis Kit for RT-PCR (AMV) (Cat. no.
1148318801, Roche) in a volume of 20μL according to the manufacturer’s instructions. The
Results
Experimental infection
To assess the success of the experimental infection, an ELISA assay was carried out at the time of necropsy. As expected, absence of IgG antibodies was detected in 3/3 mice belonging to uninfected-control groups. At 7 days p.i, we detected low IgG levels in 3/3 mice, and at 21 days p.i we detected high IgG levels in 3/3 mice (Data not shown). All mice used in this study (9/9) remained alive during the whole time-course experiment. According to our health surveillance program according to Federation of European Laboratory Animal Science Associations (FELASA) guidelines, the status health of all animals used here was optimal during the experi-mentation phase. We do not evidence any symptoms of severe pain, excessive distress, suffer-ing or an impedsuffer-ing death in any of the animals.
Histological analysis
The livers from mice belonging to each experimental group were histologically assessed to compare the hepatic damage progress during the experimental infection. At 7 days p.i, we observed thin whitish tracts and spots in the liver parenchyma. A microscopic analysis revealed abundant infiltrates of neutrophils, eosinophils and macrophages in the section of migration tracts, which can be attributed to the wandering of immature flukes. At 21 days p.i, we observed severe liver tissue damage, bile duct enlargement, superficial scars, and irregular yellowish-white areas on the liver surface and into the parenchyma. A microscopic analysis revealed extensive areas of necrosis, fibrosis, cholangitis and granulomas in the liver parenchyma with diffuse infiltration of eosinophils, macrophages, lymphocytes and plasma cells (Fig 1).
Data normalization and pre-processing
The data discussed in this publication have been deposited in NCBI’s Gene Expression Omni-bus [28] and are accessible through GEO Series accession number GSE69588 (http://www. ncbi.nlm.nih.gov/geo/query/acc.cgi?acc=GSE69588). All samples could be read and pre-pro-cessed appropriately. The box plots showing intensity distribution for each of the arrays in this study and data distributions before and after normalization are shown inS1 Fig. The normal-ized data for each of the probe-sets on the GeneChip Mouse Gene 1.0 ST Array were filtered for significant signal and normalized to uninfected controls, reducing the data set to 28,853 genes, of which, 5,631 were shown to be differentially expressed. Genes that were differentially expressed were chosen according to the following criteria:i)at least ± 2-fold change in their expression compared to the uninfected control group andii)a statisticpvalue<0.05.
Fasciola hepatica
infection induces changes in the gene expression in
the liver
In the present study, we investigated the gene expression profile in the livers of mice from infection withF.hepaticametacercariae at 7- and 21-days post-infection, which corresponds to parasite migration through the hepatic parenchyma and subsequent establishment of mature adults in the liver, respectively.
Interestingly, only 5 genes were differentially expressed (p<0.05) when comparing t0vst7
and none of those genes presented a fold change value equal or higher than ± 2. Comparison between t7vst21 allowed for the identification of 1,993 genes that were differentially expressed (p<0.05). However only 128 of those genes presented a fold change value equal or higher
was performed. Only 436 of those genes presented a fold change value equal or higher than ± 2; 202 of them were down-regulated and 234 up-regulated (Fig 2A).
Intersection unit tests (IUTs) using Venn diagrams show the numbers of genes that are dif-ferentially expressed at different times of infection (t7vst21 and t0vst21), as can be seen in
Fig 2B and 2C. It is worth noting thatF.hepaticainfection mostly induces up-regulation of genes at any time of infection. A complete list of all the genes that are differentially expressed in both early and late infection is given inS2 Table.
Gene ontology (GO) and pathway analysis
The GO and pathway analysis was performed using Babelomics V4.2 and Ingenuity Pathway Analysis, making comparisons between infection at t7 and t21 to the uninfected control group. In both cases (comparisons between t7vst21 and t0vst21), we found the following pattern
Fig 1. Macro and microscopic hepatic lesion of mice infected orally with 7 metacercariae ofF. hepatica.(A, B) Uninfected control. Micrography section of a migration tract with infiltrates (C) and the liver with whitish tracts and spots in the parenchyma (D) at 7 days p.i (t7). Liver parenchyma with extensive areas of necrosis, fibrosis, cholangitis and granulomas with infiltrates (E) and severe macroscopic damage (F) at 21 days p.i (t21).
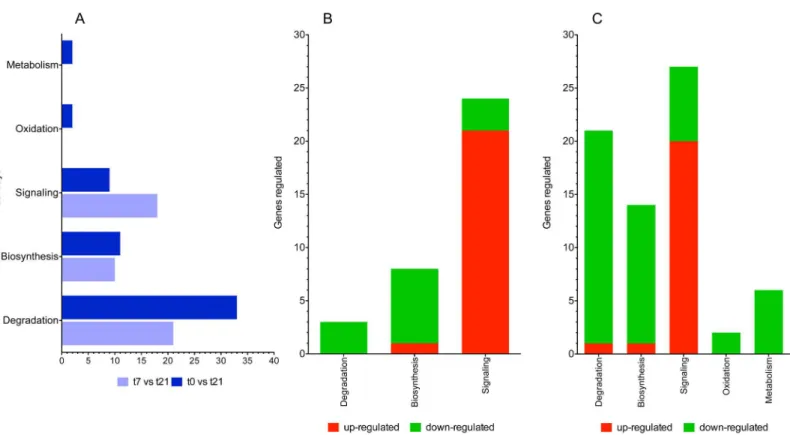
concerning the number of genes being differentially expressed in canonical pathways: degradation>biosynthesis>signaling. Comparison between t7vst21 revealed 64 canonical
pathways with ap-value<0.05, whereas comparison between t0vst21 revealed 69.
Compari-son between t0vst21 also showed an increase in the number of pathways that are associated with degradation and a reduction in the signaling-associated pathways (Fig 3A). Strong down-regulation was observed in both cases in pathways associated with degradation and biosynthe-sis, whereas up-regulation was achieved in the signaling pathways (Fig 3B and 3C). The path-ways associated with oxidation and metabolism was only present in the comparison between t0
vst21, which was accompanied by a strong down-regulation (Fig 3C). The number of genes that were differentially expressed (both up- and down-regulated) is greatest at t21.
At this stage of infection,F.hepaticainduces the alteration of a greater number of pathways as well as the differential expression of a greater number of genes. It is evident that strong down-regulation is achieved duringF.hepaticainfection in terms of the degradation, biosyn-thesis, oxidation and metabolism pathways in both early and late infection (Fig 4A). However, strong up-regulation is observed in pathways related to signaling in both stages of infection (Fig 4B).
Fig 2. The number of genes differentially expressed as a result of infection withF.hepaticametacercariae.(A) A Venn diagram representing the differentially expressed genes obtained from statistical analyses of two groups (t7vst21 and t0vst21; Significant Analysis of Microarrays SAM test, false discovery rate at 5%). The figure represents the numbers of probe sets that are differently expressed between the three groups (untreated controls t0, infected and sacrificed at 7 days p.i (t7), and infected and sacrificed at 21 days p.i (t21)) and shared among the analyses (t7vst21, and t0vst21). (B) Down-regulated genes. (C) Up-Down-regulated genes. Down-Down-regulated genes are represented as green bars and up-Down-regulated genes as red bars.
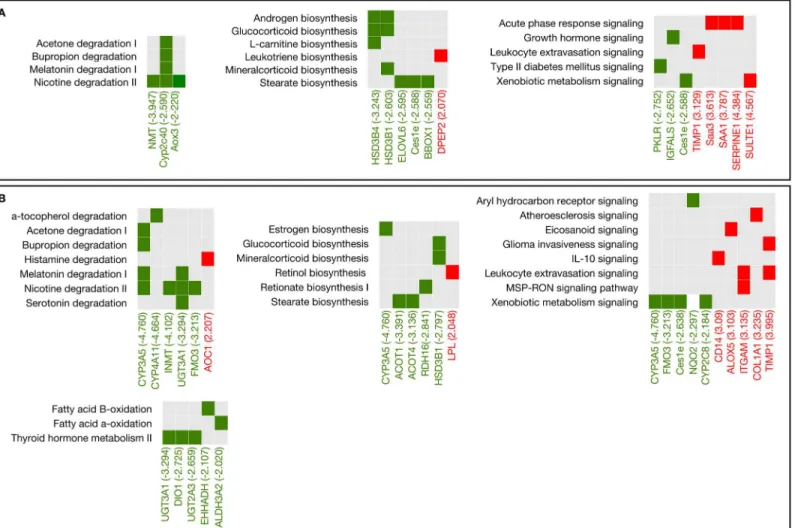
Concerning the degradation and biosynthesis pathways, we observed a strong down-regula-tion of several genes that belong to the cytochrome P450 (e.g., CYP3A5, Cyp2c40, CYP4F12, and CYP2C8), glucoronosyltransferases (e.g., UGT3A1, UGT2A3, UGT2B17, UGT2B28), car-boxylesterase (Ces1e), fatty-acid elongase (ELOVL), aldehyde dehydrogenase (ALDH) and other degradation-associated genes, such as arylformamidase (AFMID) and aldehyde oxidase (Aox3). Analysis of the signaling pathways also revealed up-regulation of many genes, includ-ing the chemokine C-X-C motif receptor 4 (CXCR4), tumor necrosis factor receptor family (TNFRSF), suppressor of cytokine signaling (SOCS), CD14 molecule (CD14) and metallopro-tease inhibitor (TIMO), amongst others.Table 1shows the significant genes (down- and up-regulated) that are associated with the canonical pathways related to degradation, biosynthesis and signaling at 21 days after the infection.
Identifying genes involved in causing hepatic toxicity
The Ingenuity Pathway Analysis tool, "Tox functions", was used to identify a subset of genes and biological functions that are implicated in causing hepatic toxicity. We identified a strong up-regulation of several genes that promote hepatic toxicity in both stages of infection (t7vst21 and t0vst21). In the first stage of infection, five genes that are associated to liver damage, liver necrosis and liver proliferation were identified. Down-regulation was completely absent at this point of infection (Table 2). At 21 days post-infection, we identified a total of 11 regulated genes that were associated with liver damage, liver necrosis and liver fibrosis, and most of them are up-regulated. Strikingly, down-regulation was observed in only 1 gene at this stage of infection (Table 2). We also used the build-up networks and pathways from the Ingenuity Pathway
Fig 3. Representative canonical pathways study using the ingenuity pathway analysis (IPA) tool.(A) A comparison of the numbers of pathways that are statistically significant is shown for each point (t7 vs t21 and t0 vs t21). (B) The numbers of genes that are differentially expressed in each of the pathways are depicted for t7 vs t21 and (C) t0 vs t21. Down-regulation is shown in green and up-regulation in red.
Analysis tool to investigate the relationships between the most significant associated-functions related to the hepatic damage and those individual genes involved in causing liver necrosis and the death of hepatic cells. As inFig 5, there is a complex interaction, which mainly involves up-regulated genes. Such up-regulation directly induces the activation pathways that lead to liver necrosis, which is mainly through the genes SERPINE1, CD14, FOS, HMOX1, MYC, Mt1, SOCS3, A2M and SELP. Beyond the active participation of these genes in causing liver necrosis, they are also involved in the interaction network, causing hepatic cell death, liver proliferation, increased liver damage, liver hepatitis, hepatic fibrosis, hepatic cholestasis and liver steatosis.
Up-regulation determines hepatic injury in
F
.
hepatica
infection
ChronicF.hepaticainfection causes severe liver damage, including hepatic abscesses, hepatic necrosis and the subsequent destruction of the hepatic parenchyma, leading to clinical manifes-tations, such as anemia, abdominal disorders and hepatic dysfunction. Here, we identified 20 regulated-genes as the most relevant genes that are associated with such damage; 13 of them are up-regulated and 7 are down-regulated. The aforementioned regulated-genes were then
Fig 4. The most representative pathways and the associated differentially expressed genes in two stages of the infection.(A) Comparison between t7 (seven days post-infection) vs t21 (21 days post-infection). (B). Comparison between t0 (Uninfected) vs t21 (21 days post-infection). The fold change of each gene is shown in parentheses. Red squares represent the genes that are up-regulated, belonging to each signaling pathway, green squares represent genes that are down-regulated, whereas gray squares indicate the absence of those genes in that pathway.
Table 1. Genes associated with pathways related to degradation, biosynthesis and signaling.
Pathway/Gene symbol Gene description Fold change p-value
Degradation
CYP3A5 Cytochrome P450, family 3, subfamily A, polypeptide 5 -4.760 1.52E-03
CYP4A11 Cytochrome P450, family 4, subfamily A, polypeptide 11 -4.664 8.20E-04
INMT Indolethylenamine N-methyltransferase -4.100 2.28E-04
UGT3A1 UDP glucoronosyltransferase 3 family, polypeptide A1 -3.294 2.79E-04
FMO3 Flavin containing monooxygenase 3 -3.213 1.22E-04
AFMID Arylformamidase -2.749 7.45E-06
UGT2A3 UDP glucoronosyltransferase 2 family, polypeptide A3 -2.659 1.99E-04
Cyp2c40 Cytochrome P450, family 1, subfamily c, polypeptide 40 -2.469 9.51E-05
UGT2B17 UDP glucoronosyltransferase 2 family, polypeptide B17 -2.438 1.44E-03
LIPG Lipase, endothelial -2.434 2.33E-04
CYP4F12 Cytochrome P450, family 4, subfamily F, polypeptide 12 -2.340 2.92E-04
MGLL Monoglyceride lipase -2.314 1.07E-06
SULT1B1 Sulfurotransferase family, cytosolic 1B, member 1 -2.284 2.88E-04
CYP2C8 Cytochrome P450, family 2, subfamily C, polypeptide 8 -2.184 1.43E-03
MAOB Monoamine oxidase B -2.174 1.11E-04
Aox3 Aldehyde oxidase 3 -2.120 3.38E-05
EHHADH Enoyl-CoA, hydratase/3-hydroxyacyl CoA -2.107 1.69E-04
ALDH3A2 Aldehyde dehydrogenase 3 family, member a2 -2.020 3.76E-08
UGT2B28 UDP glucoronosyltransferase 2 family, polypeptide B28 -2.007 2.38E-04
Biosynthesis
CYP3A5 Cytochrome P450, family 3, subfamily A, polypeptide 5 -4.760 1.52E-03
ACOT1 Acyl-CoA thioesterase 1 -3.391 1.01E-04
ACOT4 RDH16 Acyl-CoA thioesterase 4 Retinol dehydrogenase 16 -3.136–2.841 7.33E-06 5.52E-05
HSD3B1 Hydroxy-delta-5-steroid dehydrogenase, 3 beta-isomerase 1 -2.797 1.03E-03
AFMID Arylformamidase -2.749 7.45E-06
SDR9C7 Short chain dehydrogenase/reductase family 9C, member 7 -2.639 2.88E-04
Ces1e Carboxylesterase 1E -2.638 1.62E-04
BBOX1 Butyrobetaine, 2-oxoglutarate dioxygenase -2.635 1.66E-04
Cyp2c40 Cytochrome P450, family 1, subfamily c, polypeptide 40 -2.469 9.51E-05
LIPG Lipase, endothelial -2.434 2.33E-04
ELOVL6 ELOVL fatty acid elongase 6 -2.376 8.21E-04
CYP2C8 Cytochrome P450, family 2, subfamily C, polypeptide 8 -2.184 1.43E-03
LPL Lipoprotein lipase 2.048 2.46E-05
Signaling
CYP3A5 Cytochrome P450, family 3, subfamily A, polypeptide 5 -4.760 1.52E-03
FMO3 Flavin containing monooxygenase 3 -3.213 1.22E-04
Ces1e Carboxylesterase 1E -2.638 1.62E-04
NQO2 NAD(P)H dehydrogenase, quinone 2 -2.297 2.33E-06
CYP2C8 Cytochrome P450, family 2, subfamily C, polypeptide 8 -2.184 1.43E-03
ALDH3A2 Aldehyde dehydrogenase 3 family, member a2 -2.020 3.76E-08
LPL Lipoprotein lipase 2.048 2.46E-05
CXCR4 Chemokine (C-X-C motif) receptor 4 2.052 3.85E-04
NCF1 Neutrophil cytosolic factor 1 2.087 7.51E-05
ACTA2 Actin, alpha 2, smooth muscle, aorta 2.109 5.03E-04
TNFRSF12A Tumor necrosis factor receptor superfamily, member 12A 2.122 3.49E-04
MYC v-myc avian myelocytomatosis viral oncogene homolog 2.180 1.61E-04
classified into subsets according to their functionality, including liver necrosis, liver damage, fatty acid oxidation and metabolism, among others. Ten genes were functionally assigned as necrosis and liver damage genes; most of those genes (9 of them) were up-regulated, and only 1 was down-regulated (Table 3). In addition to the biological functions associated with liver damage, we also identified other genes that are related to fatty acid oxidation and metabolism (e.g., Peroxisome Proliferative Activated Receptor, Alpha (PPARA) and Solute Carrier Family 22 (Organic Cation/Carnitine Transporter), Member 5 (SLC22A5)), lipid and vitamin metabo-lism and small molecule biochemistry (e.g., Solute Carrier Family 23 (Ascorbic Acid Trans-porter), Member 1 (SLC23A1), Retinol Dehydrogenase 16 (RDH16), and ATP-binding cassette, sub-family G, member 8 (ABCG8)).
PCR for microarray validation
The PCR expression patterns agreed with those obtained in the microarrays. Six genes were randomly selected for such confirmation (three up-regulated genes and three down-regulated ones). As inFig 6, all genes that were up-regulated had a higher band intensity in the group of mice infected withF.hepaticametacercariae compared to the uninfected group, whereas the down-regulated genes had lower band intensity in the infected group.
Discussion
In the present study, we used microarray-based methodology to assess the gene expression pro-file in the livers of mice infected withF.hepaticametacercariae, which was combined with his-tological analysis to identify the differential expression of the genes that are associated with inducing liver damage as well as to evaluate the hepatic damage during the infection. With respect to gross examination of the liver, we observed enlargement together with hemorrhages on the liver surface, which were mainly associated with inflammatory reactions and fibrosis, and two-thirds of the hepatic tissue was affected. We also observed areas with a high density of lymphocytes, which were mainly marked by the migration of juvenile flukes. These anomalies
Table 1. (Continued)
Pathway/Gene symbol Gene description Fold change p-value
SOCS3 Suppressor of cytokine signaling 3 2.199 9.27E-08
RPL13A Ribosomal protein L13a 2.253 1.32E-05
SELP Selectin P 2.266 1.21E-03
COL3A1 Collagen, type III, alpha 1 2.347 9.96E-06
FOS FBJ murine osteosarcoma viral oncogene homolog 2.553 5.57E-04
ALOX15 Arachidonate 15-lipoxygenase 2.562 3.18E-04
COL1A2 Collagen, type I, alpha 2 2.605 5.71E-05
IL1R2 Interleukin 1 receptor, type II 2.692 2.64E-04
HMOX1 Heme oxygenase 1 2.816 4.24E-06
CD14 CD14 molecule 3.094 1.19E-04
ALOX5AP Arachidonate 5-lipoxygenase-activating protein 3.103 1.02E-05
ITGAM Integrin, alpha M 3.135 1.24E-04
COL1A1 Collagen, type I, alpha 1 3.235 7.40E-06
TIMP1 TIMO metalloprotease inhibitor 1 3.995 7.07E-05
Only those genes with both a p-value<0.05 and a fold change±2 are included. Genes in this analysis belong to the comparison between t0 (uninfected mice) and t21 (mice infected and necropsied at 21 days after infection).
have also been observed in other fasciolosis models, and the highest damage takes place in the chronic phase of the disease [9,29]. On the other hand, the infection caused byF.hepaticaalso induced significant changes in the gene expression profile in the livers of affected mice com-pared with the untreated control group. Out of 28,853 probe-genes in the array, the expression of 3,775 (13.1%) was changed at ap-value<0.05, and 327 of them (8.7%) at a fold change
equal to ± 2. The immune response induced byF.hepaticahas been well studied in different experimental models, resulting in a highly Th2-dependent response with an increase in not only the number of eosinophils and antibodies, such as IgG1 and IgE, but also in the Th2-cyto-kine associated profile, including IL-4, IL-5 and IL-10 [30]. Concerning immune response, in the present study we identified the differential expression of several relevant genes associated with such immune response induced byF.hepatica. We found up-regulation of genes
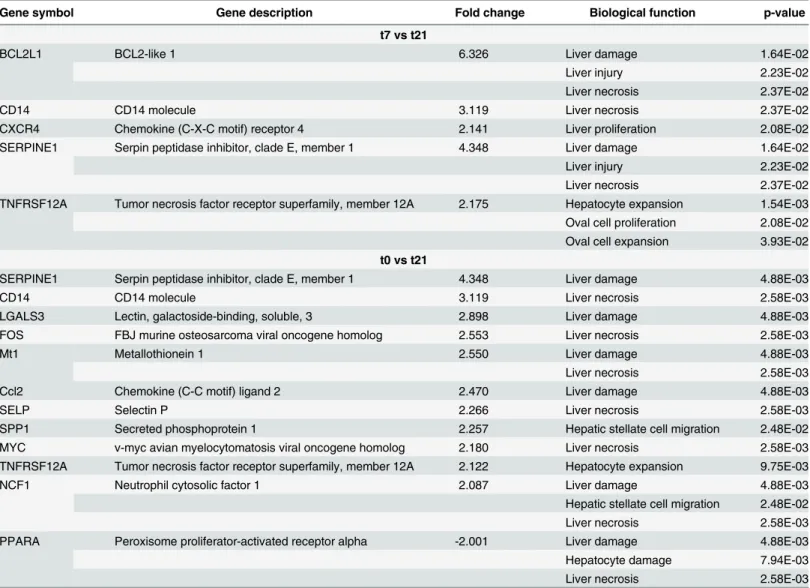
Table 2. Biological function and genes involved in causing hepatic toxicity followed byFasciola hepaticainfection assessed using the Tox Func-tion from the Ingenuity Pathway Analysis tool.
Gene symbol Gene description Fold change Biological function p-value
t7 vs t21
BCL2L1 BCL2-like 1 6.326 Liver damage 1.64E-02
Liver injury 2.23E-02
Liver necrosis 2.37E-02
CD14 CD14 molecule 3.119 Liver necrosis 2.37E-02
CXCR4 Chemokine (C-X-C motif) receptor 4 2.141 Liver proliferation 2.08E-02
SERPINE1 Serpin peptidase inhibitor, clade E, member 1 4.348 Liver damage 1.64E-02
Liver injury 2.23E-02
Liver necrosis 2.37E-02
TNFRSF12A Tumor necrosis factor receptor superfamily, member 12A 2.175 Hepatocyte expansion 1.54E-03 Oval cell proliferation 2.08E-02 Oval cell expansion 3.93E-02 t0 vs t21
SERPINE1 Serpin peptidase inhibitor, clade E, member 1 4.348 Liver damage 4.88E-03
CD14 CD14 molecule 3.119 Liver necrosis 2.58E-03
LGALS3 Lectin, galactoside-binding, soluble, 3 2.898 Liver damage 4.88E-03
FOS FBJ murine osteosarcoma viral oncogene homolog 2.553 Liver necrosis 2.58E-03
Mt1 Metallothionein 1 2.550 Liver damage 4.88E-03
Liver necrosis 2.58E-03
Ccl2 Chemokine (C-C motif) ligand 2 2.470 Liver damage 4.88E-03
SELP Selectin P 2.266 Liver necrosis 2.58E-03
SPP1 Secreted phosphoprotein 1 2.257 Hepatic stellate cell migration 2.48E-02
MYC v-myc avian myelocytomatosis viral oncogene homolog 2.180 Liver necrosis 2.58E-03
TNFRSF12A Tumor necrosis factor receptor superfamily, member 12A 2.122 Hepatocyte expansion 9.75E-03
NCF1 Neutrophil cytosolic factor 1 2.087 Liver damage 4.88E-03
Hepatic stellate cell migration 2.48E-02
Liver necrosis 2.58E-03
PPARA Peroxisome proliferator-activated receptor alpha -2.001 Liver damage 4.88E-03
Hepatocyte damage 7.94E-03
Liver necrosis 2.58E-03
The fold change of each gene and significance of each biological function are also shown. The following comparisons were made:i). t7 (mice infected and necropsied at 7 days post-infection) vs t21 (mice infected and necropsied at 21 days post-infection) andii). t0 (uninfected mice) vs t21 (mice infected and necropsied at 21 days post-infection).
associated with the innate immune response, such as TLR1, TLR3 and TLR4 and also up-regu-lation of costimulatory molecules, such as CD81 and CD84 and cytokines such as IL-1 and IL5. These results are in concordance with those obtained by [31], who also investigated the gene expression profile in sheeps experimentally infected withF.hepatica.
However, little is known about the gene expression profile duringF.hepaticainfection, and the genes involved in causing liver injury and the subsequent liver pathology responsible for the clinical manifestations of the disease have not been identified. To date, there are only two reports in the literature about the use of microarray and RNA-seq-based experiments afterF.
hepaticainfection using the rat and the sheep as infection model [31,32].
Fig 5. Gene networks associated with hepatic damage.The Ingenuity Pathway Analysis tool was used to identify significant genes that are related to hepatic damage as well as to build up interaction networks amongst them with the most significant associated-functions related to hepatic damage. Solid lines denote direct interactions and dotted-arrows predict activation pathways. The color red indicates up-regulation. The data used for such network construction were the comparison between t0 (uninfected) and t21 (21 days post-infection), which is where the most significant differential expression of genes occurs.
Table 3. Genes involved in causing damage and liver necrosis according to the Ingenuity Pathway Analysis tool.
Biological function/ Gene symbol Gene description Fold change p-value
Liver damage
SERPINE1 Serpin peptidase inhibitor, clade E, member 1 4.348 5.40E-05
LGALS3 Lectin, galactoside-binding, soluble, 3 2.898 3.88E-05
Mt1 Metallothionein 1 2.550 9.11E-04
Ccl2 Chemokine (C-C motif) ligand 2 2.470 1.38E-03
NCF1 Neutrophil cytosolic factor 1 2.087 7.51E-05
PPARA Peroxisome proliferator-activated receptor alpha -2.001 2.99E-04
Liver necrosis
SERPINE1 Serpin peptidase inhibitor, clade E, member 1 4.348 5.40E-05
CD14 CD14 molecule 3.119 1.19E-04
FOS FBJ murine osteosarcoma viral oncogene homolog 2.553 5.57E-04
Mt1 Metallothionein 1 2.550 9.11E-04
SELP Selectin P 2.266 1.21E-03
MYC v-myc avian myelocytomatosis viral oncogene homolog 2.180 1.61E-04
NCF1 Neutrophil cytosolic factor 1 2.087 7.51E-05
PPARA Peroxisome proliferator-activated receptor alpha -2.001 2.99E-04
Fatty acid oxidation
SLC22A5 Solute carrier family 22, member A5 -2.224 6.69E-04
SLC25A3 Solute carrier family 25A, member 23 -2.158 5.15E-04
PPARA Peroxisome proliferator-activated receptor alpha -2.001 2.99E-04
The fold change and significance of each gene are also shown. Regulated genes correspond to the comparison between t0 (uninfected mice)vst21 (mice infected and necropsied at 21 days post-infection).
doi:10.1371/journal.pone.0134910.t003
Fig 6. The microarray was validated with PCR reactions.(A) PCR amplification from liver RNA samples for the selected genes at time t0 (before any treatment). (B) PCR amplification at t21 (21 days after oral infection of mice withF.hepaticametacercariae). Three up-regulated genes and three down-regulated genes were randomly chosen for PCR amplification. The corresponding PCR for each gene was performed using each biological sample obtained at t0 and t21. The results are representative of three individual experiments. MWM: molecular weight marker.
More recently, a draft genome forF.hepaticahas been published and time-course of gene expression was performed to investigate those mechanisms used byF.hepaticato successfully adapt and survive into the mammalian host by using RNAseq-based methodology [33]. A pro-gressive differential expression of a large number of genes as the parasite grows and migrates into the mammalian host has been found, with predominance of cathepsins which involvement during infection has been widely studied. Another important issue concerning the success ofF.
hepaticaestablishment in the mammalian host is related with a very sophisticated anti-oxidant system essential not only for the detoxification of reactive oxygen and nitrogen species but also as defense against superoxide and nitric oxide produced by cell of the mammalian host. Genes encoding superoxide dismutase (SOD), glutathione transferases (GSTs) and fatty acid binding proteins (FABPs) are within the most important anti-oxidants expressed byF.hepatica. Such detoxification pathway comprises three main phases; phase I (activation), phase II (conjugation) and phase III (efflux). The last phase has also several implications in reducing anti-helminthic drug activity, bioavailability and has also been linked to triclabendazole resistance [33].
It is well known than the liver is an organ where the biotransformation of xenobiotics and drugs occurs, and it is implicated in a number of biological functions, including carbohydrate metabolism, fatty-acid metabolism, protein metabolism, hormone metabolism and the storage of glycogen and vitamins. The liver also has immunological and defense mechanisms through the action of the Kupffer cells, sinusoidal endothelial cells and natural killer cells [34].
Here, we identified a strong down-regulation in the pathways that are associated with degra-dation, biosynthesis and signaling fromF.hepaticainfection at 21 days after the experimental challenge. Several genes belonging to the cytochrome P450 family (CYP) were found to be highly down-regulated in such pathways, especially the CYP3A5 gene (cytochrome P450, fam-ily 3, subfamfam-ily A, polypeptide 5).
The study of the CYP450 system has previously been described to understand the resis-tance/susceptibility to triclabendazole of someF.hepaticaisolates by usingin vitro experi-ments, demonstrating that such resistance/susceptibility is altered by the inhibition of
triclabendazole metabolism from the addition of some inhibitors, including the CYP450 inhibi-tor, ketoconazole [35–37]. Furtherin vivoexperiments also demonstrated that resistance to tri-clabendazole was diminished by the alteration in drug metabolism with CYP450 inhibitors [38,
39], confirming the importance of the CYP450 system inF.hepaticasusceptibility/resistance. However, others have reported increased activity of the isoenzyme CYP2A5 in the livers of mice that were experimentally challenged withF.hepaticaand has also been correlated with liver injury, cell death and hepatocyte proliferation [40]. Our study also demonstrated a corre-lation between the regucorre-lation of the CYP3A5 gene and time after infection, and there was more enhanced down-regulation with infection. Other studies have also investigated the participa-tion of the CYP450 family enzymes as mediators in the formaparticipa-tion of oxysterols, products of cholesterol oxidation that could induce cholangiocarcinogenesis in the infection caused by the liver flukeOpisthorchis viverrini[41–43]. Oxysterols have also been associated with the devel-opment of other pathologies and various cancer types [44–46]. Induction of cholangiocarcino-genesis byO.viverrinihas also been associated with a down-regulation of galectin-3, a B-galactoside binding lectin [47]. By contrast, we found up-regulation of the LGALS3 gene, which correlates with the progression of theF.hepaticainfection. We do not find any correla-tion between the regulacorrela-tion of the CYP family genes, oxysterols andF.hepaticainfection. Reports concerning oxysterols andF.hepaticaare also scarce, which is in accordance with the absence of cholangiocarcinogenesis caused by the liver flukeF.hepatica.
SELP>LGALS3>CCL2>MCF1>PPARA. To date, available reports concerning the
regu-lation of those genes and the precise role leading to liver damage in parasite-associated infec-tions are very limited. SERPINE1 (serpin peptidase inhibitor, clade E) member 1 gene has an important role in liver function because it is a potent inhibitor of tissue plasminogen activator (tPA), leading to the inhibition of fibrinolysis, a natural process that causes the formation of blood clots [48]. The most relevant biological pathways associated with the SERPINE1 gene are hepatic fibrosis, hepatic stellate cell activation and the coagulation system.
In summary, we have identified, for the first time, the gene expression pattern induced for
F.hepaticainfection using a microarray-based methodology, leading to the identification of those genes that are associated with liver injury and hepatic toxicity as well as those implicated in the degradation, metabolism, signaling and oxidation pathways. The results obtained here could provide information and insights about the molecular pathways in the successful estab-lishment of infection at least in a murine model. Taking into account the results obtained here, they could be useful to study and compare the gene expression profile caused byF.hepaticain other experimental or naturally-infected models.
The expression pattern obtained here, with CYP3A5 down-regulation expression gene (cytochrome P450 family) and LGALS3 up-regulation expression gene (galectine 3), could also be used to explain the lack of association between infection withF.hepaticaand cholangiocar-cinoma. However, more studies are needed to confirm this hypothesis.
Supporting Information
S1 Fig. Raw data file (.CEL files) where background-adjusted, normalized and log-trans-formed of the perfect match (PM) values using a robust multi-array average methodology (RMA).Box plots showing the global normalized expression values for each RNA sample in non-normalized data (A) and normalized data (B).
(EPS)
S1 File. The NC3Rs ARRIVE Guidelines Checklist. (PDF)
S1 Table. Specific primer sequence for the PCR amplification of selected genes that are up-and down-regulated.Primers were designed using Primer-Blast software and amplification was conducted by using a touch-down PCR reaction. The free ImageJ software was used or the quantitative digital analysis of image data from electrophoresis gels.
(DOCX)
S2 Table. Genes differentially expressed in the livers of mice that are infected withF.hepatica metacercariae.Comparisons between t0vst7, t7vst21 and t0vst21 were performed. All of the genes with a statistic p-value<0.05, regardless of its fold change value, are listed in this table.
(XLSX)
Author Contributions
Conceived and designed the experiments: JRC AM JLA. Performed the experiments: JRC JLA PFS BV FC. Analyzed the data: JRC JLA PFS. Contributed reagents/materials/analysis tools: BV. Wrote the paper: JRC PFS AM.
References
2. Keiser J, Utzinger J. Food-borne trematodiases. Clinical microbiology reviews. 2009 Jul; 22(3):466–83. doi:10.1128/CMR.00012-09PMID:19597009
3. Furst T, Keiser J, Utzinger J. Global burden of human food-borne trematodiasis: a systematic review and meta-analysis. The Lancet Infectious diseases. 2012 Mar; 12(3):210–21. doi: 10.1016/S1473-3099(11)70294-8PMID:22108757
4. Hotez PJ, Savioli L, Fenwick A. Neglected tropical diseases of the Middle East and North Africa: review of their prevalence, distribution, and opportunities for control. PLoS neglected tropical diseases. 2012; 6(2):e1475. doi:10.1371/journal.pntd.0001475PMID:22389729
5. Mas-Coma S, Valero MA, Bargues MD. Chapter 2. Fasciola, lymnaeids and human fascioliasis, with a global overview on disease transmission, epidemiology, evolutionary genetics, molecular epidemiology and control. Advances in parasitology. 2009; 69:41–146. doi:10.1016/S0065-308X(09)69002-3PMID:
19622408
6. Mas-Coma MS, Esteban JG, Bargues MD. Epidemiology of human fascioliasis: a review and proposed new classification. Bulletin of the World Health Organization. 1999; 77(4):340–6. PMID:10327713
7. Dalton JP. Fasciolosis. Wallingford, UK: CABI Publishing; 1999.
8. Ashrafi K, Bargues MD, O'Neill S, Mas-Coma S. Fascioliasis: A worldwide parasitic disease of impor-tance in travel medicine. Travel medicine and infectious disease. 2014 Sep 28.
9. Marcos LA, Yi P, Machicado A, Andrade R, Samalvides F, Sanchez J, et al. Hepatic fibrosis and Fas-ciola hepatica infection in cattle. Journal of helminthology. 2007 Dec; 81(4):381–6. PMID:17958928
10. Bennett CE. Fasciola hepatica: development of caecal epithelium during migration in the mouse. Experimental parasitology. 1975 Jun; 37(3):426–41. PMID:1126424
11. Dawes B. On the growth and maturation of Fasciola hepatica L. in the mouse. Journal of helminthology. 1962; 36:11–38. PMID:13884021
12. Fairweather I. Triclabendazole: new skills to unravel an old(ish) enigma. Journal of helminthology. 2005 Sep; 79(3):227–34. PMID:16153316
13. Fairweather I. Triclabendazole progress report, 2005–2009: an advancement of learning? Journal of helminthology. 2009 Jun; 83(2):139–50. doi:10.1017/S0022149X09321173PMID:19366485
14. Moll L, Gaasenbeek CP, Vellema P, Borgsteede FH. Resistance of Fasciola hepatica against triclaben-dazole in cattle and sheep in The netherlands. Veterinary parasitology. 2000 Jul 24; 91(1–2):153–8. PMID:10889368
15. Olaechea F, Lovera V, Larroza M, Raffo F, Cabrera R. Resistance of Fasciola hepatica against tricla-bendazole in cattle in Patagonia (Argentina). Veterinary parasitology. 2011 Jun 10; 178(3–4):364–6. doi:10.1016/j.vetpar.2010.12.047PMID:21277090
16. Ortiz P, Scarcella S, Cerna C, Rosales C, Cabrera M, Guzman M, et al. Resistance of Fasciola hepatica against Triclabendazole in cattle in Cajamarca (Peru): a clinical trial and an in vivo efficacy test in sheep. Veterinary parasitology. 2013 Jul 1; 195(1–2):118–21. doi:10.1016/j.vetpar.2013.01.001PMID:
23352107
17. Hillyer GV. Fasciola antigens as vaccines against fascioliasis and schistosomiasis. Journal of helmin-thology. 2005 Sep; 79(3):241–7. PMID:16153318
18. Hotez PJ, Bethony JM, Diemert DJ, Pearson M, Loukas A. Developing vaccines to combat hookworm infection and intestinal schistosomiasis. Nature reviews Microbiology. 2010 Nov; 8(11):814–26. doi:10. 1038/nrmicro2438PMID:20948553
19. Dalton JP, Robinson MW, Mulcahy G, O'Neill SM, Donnelly S. Immunomodulatory molecules of Fas-ciola hepatica: candidates for both vaccine and immunotherapeutic development. Veterinary parasitol-ogy. 2013 Aug 1; 195(3–4):272–85. doi:10.1016/j.vetpar.2013.04.008PMID:23623183
20. Orr MP, L. Sample Size Estimation while Controlling False Discovery Rate for Microarray. The R Jour-nal. 2009; 1(1):47–53.
21. Medina I, Carbonell J, Pulido L, Madeira SC, Goetz S, Conesa A, et al. Babelomics: an integrative plat-form for the analysis of transcriptomics, proteomics and genomic data with advanced functional profil-ing. Nucleic acids research. 2010 Jul; 38(Web Server issue):W210–3. doi:10.1093/nar/gkq388PMID:
20478823
22. Irizarry RA, Hobbs B, Collin F, Beazer-Barclay YD, Antonellis KJ, Scherf U, et al. Exploration, normali-zation, and summaries of high density oligonucleotide array probe level data. Biostatistics. 2003 Apr; 4 (2):249–64. PMID:12925520
24. Smyth GK. Limma: Linear Models for Microarray Data. Bioinformatics and Computational Biology Solu-tions using R and Bioconductor. New York: Springer; 2005. p. 397–420.
25. Benjamini Y, Drai D, Elmer G, Kafkafi N, Golani I. Controlling the false discovery rate in behavior genet-ics research. Behavioural brain research. 2001 Nov 1; 125(1–2):279–84. PMID:11682119
26. Sartor MA, Leikauf GD, Medvedovic M. LRpath: a logistic regression approach for identifying enriched biological groups in gene expression data. Bioinformatics. 2009 Jan 15; 25(2):211–7. doi:10.1093/
bioinformatics/btn592PMID:19038984
27. Montaner D, Dopazo J. Multidimensional gene set analysis of genomic data. PloS one. 2010; 5(4): e10348. doi:10.1371/journal.pone.0010348PMID:20436964
28. Edgar R, Domrachev M, Lash AE. Gene Expression Omnibus: NCBI gene expression and hybridization array data repository. Nucleic acids research. 2002 Jan 1; 30(1):207–10. PMID:11752295
29. Talukder S, Bhuiyan MJ, Hossain MM, Uddin M, Howlader MR. Pathological investigation of liver fluke infection of slaughtered black Bengal goat in a selected area of Bangladesh. Bangladesh Journal of Veterinary Medicine. 2010; 8(1):35–40.
30. Flynn RJ, Mulcahy G, Elsheikha HM. Coordinating innate and adaptive immunity in Fasciola hepatica infection: implications for control. Veterinary parasitology. 2010 May 11; 169(3–4):235–40. doi:10. 1016/j.vetpar.2010.02.015PMID:20219284
31. Alvarez CA, Ansell BRE, Hall RS, Gasser RB, Young ND, Jex AR, et al. Transcriptional analysis identi-fies key genes involved in metabolism, fibrosis/tissue repair and the immune response against Fasciola hepatica in sheep liver. Parasites and Vectors. 2015 February; 8(124):1–14.
32. Wesolowska A, Jaros S, Norbury LJ, Jaros D, Zygner W, Wedrychowicz H. Microarray analysis of rat immune responses to liver fluke infection following vaccination with Fasciola hepatica phosphoglycer-ate kinase. Experimental parasitology. 2013 May; 134(1):33–8. doi:10.1016/j.exppara.2013.01.013 PMID:23376446
33. Cwiklinski K, Dalton JP, Dufresne PJ, La Course J, Williams DJ, Hodgkinson J, et al. The Fasciola hepatica genome: gene duplication and polymorphism reveals adaptation to the host environment and the capacity for rapid evolution. Genome biology. 2015; 16:71. doi:10.1186/s13059-015-0632-2PMID:
25887684
34. Ramadori G, Moriconi F, Malik I, Dudas J. Physiology and pathophysiology of liver inflammation, dam-age and repair. Journal of physiology and pharmacology: an official journal of the Polish Physiological Society. 2008 Aug; 59 Suppl 1:107–17.
35. Devine C, Brennan GP, Lanusse CE, Alvarez LI, Trudgett A, Hoey E, et al. Inhibition of cytochrome P450-mediated metabolism enhances ex vivo susceptibility of Fasciola hepatica to triclabendazole. Parasitology. 2010 Apr; 137(5):871–80. doi:10.1017/S003118200999148XPMID:20025819
36. Devine C, Brennan GP, Lanusse CE, Alvarez LI, Trudgett A, Hoey E, et al. Inhibition of triclabendazole metabolism in vitro by ketoconazole increases disruption to the tegument of a triclabendazole-resistant isolate of Fasciola hepatica. Parasitology research. 2011 Oct; 109(4):981–95. doi: 10.1007/s00436-011-2304-9PMID:21442257
37. Devine C, Brennan GP, Lanusse CE, Alvarez LI, Trudgett A, Hoey E, et al. Piperonyl butoxide enhances triclabendazole action against triclabendazole-resistant Fasciola hepatica. Parasitology. 2011 Feb; 138(2):224–36. doi:10.1017/S0031182010001125PMID:20946692
38. Devine C, Brennan GP, Lanusse CE, Alvarez LI, Trudgett A, Hoey E, et al. Enhancement of triclaben-dazole action in vivo against a triclabentriclaben-dazole-resistant isolate of Fasciola hepatica by co-treatment with ketoconazole. Veterinary parasitology. 2011 May 11; 177(3–4):305–15. doi:10.1016/j.vetpar. 2010.12.002PMID:21208747
39. Devine C, Brennan GP, Lanusse CE, Alvarez LI, Trudgett A, Hoey E, et al. Potentiation of triclabenda-zole action in vivo against a triclabendatriclabenda-zole-resistant isolate of Fasciola hepatica following its co-administration with the metabolic inhibitor, ketoconazole. Veterinary parasitology. 2012 Feb 28; 184 (1):37–47. doi:10.1016/j.vetpar.2011.08.006PMID:21872399
40. Montero R, Gentile GJ, Frederick L, McMannis J, Murphy T, Silva G, et al. Induced expression of CYP2A5 in inflamed trematode-infested mouse liver. Mutagenesis. 1999 Mar; 14(2):217–20. PMID:
10229924
41. Jusakul A, Loilome W, Namwat N, Haigh WG, Kuver R, Dechakhamphu S, et al. Liver fluke-induced hepatic oxysterols stimulate DNA damage and apoptosis in cultured human cholangiocytes. Mutation research. 2012 Mar 1; 731(1–2):48–57. doi:10.1016/j.mrfmmm.2011.10.009PMID:22044627 42. Loilome W, Yongvanit P, Wongkham C, Tepsiri N, Sripa B, Sithithaworn P, et al. Altered gene
43. Yoon JH, Canbay AE, Werneburg NW, Lee SP, Gores GJ. Oxysterols induce cyclooxygenase-2 expression in cholangiocytes: implications for biliary tract carcinogenesis. Hepatology. 2004 Mar; 39 (3):732–8. PMID:14999691
44. Biasi F, Mascia C, Astegiano M, Chiarpotto E, Nano M, Vizio B, et al. Pro-oxidant and proapoptotic effects of cholesterol oxidation products on human colonic epithelial cells: a potential mechanism of inflammatory bowel disease progression. Free radical biology & medicine. 2009 Dec 15; 47(12):1731– 41.
45. Linseisen J, Wolfram G, Miller AB. Plasma 7beta-hydroxycholesterol as a possible predictor of lung cancer risk. Cancer epidemiology, biomarkers & prevention: a publication of the American Association for Cancer Research, cosponsored by the American Society of Preventive Oncology. 2002 Dec; 11 (12):1630–7.
46. Silva J, Beckedorf A, Bieberich E. Osteoblast-derived oxysterol is a migration-inducing factor for human breast cancer cells. The Journal of biological chemistry. 2003 Jul 11; 278(28):25376–85. PMID:
12734199
47. Junking M, Wongkham C, Sripa B, Sawanyawisuth K, Araki N, Wongkham S. Decreased expression of galectin-3 is associated with metastatic potential of liver fluke-associated cholangiocarcinoma. Euro-pean journal of cancer. 2008 Mar; 44(4):619–26. doi:10.1016/j.ejca.2008.01.014PMID:18272359