Tribology in Industry
www.tribology.fink.rs
A Comparative Experimental Analysis of
Tribological Properties Between Commercial
Mineral Oil and Neat Castor Oil using Taguchi
Method in Boundary Lubrication Regime
S. Bhaumik
a, S.D Pathak
aaDepartment of Mechanical Engineering, SRM University, Kattankulathur, Chennai, India 603203.
Keywords:
Neat castor oil (NCO)
Commercial mineral oil (MCO) Antiwear properties (AW) Scuffing behaviour
Extreme pressure properties (EP) Viscosity
Flash point Fire point Taguchi analysis
A B S T R A C T
The present work aims to carry out a comparative experimental analysis of tribological properties of 372cSt mineral oil and 229cSt castor oil. The antiwear and extreme pressure properties of both the oils have been analysed according to ASTM G 99 and ASTM D-2783 standards. The surfaces of the balls and pins after tribo tests have been analysed using Scanning Electron Microscope (SEM) images. The present test results predict that the antiwear and extreme pressure properties in case of the selected commercially available mineral oil are better than neat castor oil. Both coefficient of friction and frictional force increased by 16-42 % and 16-35 % respectively in case of neat castor oil as compared with that of the mineral oil. The load carrying capacity in case of mineral oil has been found to be 250 kg while in case of castor oil it has been found to be 126 kg. SEM images show a higher plastic deformation in case of castor oil as compared to the mineral oil. Both mineral oil and castor oil showed surface deteriorations and increase in roughness after 40 hrs of intermittent running during scuffing test. Thus, the present investigation indicates that the tribological properties of neat castor are inferior to that of mineral oil although close observation of the results shows that both AW and EP properties of neat castor oil are much closer to that of commercial mineral oil. Thus, the present work would help in formulating castor oil based new bio lubricants with better anti wear and extreme pressure properties.
© 6 Published by Faculty of Engineering Corresponding author:
Shubrajit Bhaumik, Department of Mechanical Engineering,
SRM University, Chennai, India. E-mail: [email protected]
1. INTRODUCTION
Lubrication is one of the most important factors in all process plants. With the increase in higher production rate the usage of lubricants has also increased during the past few years. Mineral oil
has been used for a long time but now with the increase in environmental issues researchers are trying to develop eco-friendly lubricants, among which vegetable oils are of real interest because of their biodegradability, higher lubricity, suitably lower coefficient of friction and
R
E
S
E
A
R
C
frictional force, lower volatility, ease of availability and lesser cost. But the main question is, whether the vegetable oils can be used in their pure form or they need to be blended with other lubricants or addition of micro or nano-additivants. In almost all the investigations that have been reported [1,2] the vegetable oils have been blended with other lubricants or with different additives [3-5] and experiments have been carried out for the blended mixture. Jayadas [6] compared the tribological properties between coconut oil (both neat and additivated) and two stroke engine oil and observed a considerable reduction in wear in case of additive based coconut as compared to the two stroke oil. Bekal et al. [7] studied the tribological behaviour of neat pongamia oil, a blend of pongamia oil with mineral oil and neat mineral oil and predicted that the best results were obtained using the neat pongamia oil both as fuel and lubricant. The experiments were carried out with an objective of using pongamia oil as an alternative to mineral oil in IC engines. Ossia et al. [8] investigated the lubricity properties of eicosavoic acid in castor oil and the results were compared with those of zinc dialkyl dithiophosphate (ZDTP) and octadecanoic acid and found the former to have better tribological properties than the later additives. The increase in the use of vegetable oils as potential cutting fluids has been reported by many investigators. Elmunafi et al. [9] investigated the performance of minimum quantity lubrication using castor oil and predicted better performance of castor oil in terms of tool life. Results of eminent researchers [10,11,12,14] predict the superior performance of
vegetable oils in both boundary and
hydrodynamic regimes. This superior anti wear behaviour of vegetable oil is due to the strong film formation tendency of vegetable oils with lubricated surfaces which is the result of the amphiphilic nature [13,14]. Sanchez et al. [15] characterized many formulation based on castor oil and other biogenic thickeners and compared them with traditional lithium grease. They predicted that castor oil provided lower co-efficient of friction as compared with the traditional lithium based grease.
The present work investigates the tribological properties of commercially available mineral oil and neat castor oil. No additives have been added to the castor oil. The main objective of the present work is to find the tribo-efficiency of neat castor
oil with respect to commercially available mineral oil. The present work would help in developing new biodegradable castor oil lubricants.
2. MATERIALS AND EXPERIMENTAL PROCEDURE
2.1 Base oils
Commercial mineral oil (MCO) and neat castor oil (NCO) have been chosen. Mineral oil with viscosity of 372cSt is selected as very commonly used lubricant oil in heavy gear boxes in process plants. Castor oil has been chosen as it is biodegradable, non-edible and is easily available. Both these oils were procured from local vendors in Chennai, India.
2.2 Pin material
EN24 is a common gear-material. It has been used in untreated state (24 HRc) as pin material for pin-on-disc tribometer. The pins were of 10 mm diameter and 30 mm in length.
2.3 Antiwear test
A pin-on-disc (Make: Magnum, Model No. TE-POD-165LE) tribometer has been used to analyse the antiwear property of both mineral oil and castor oil. EN31 disc (hardness 58-60 HRc) is used as disk material. In order to maintain thin /boundary lubrication [16], oil was supplied dropwise at a rate of one drop per five seconds. Tests were conducted under different loads and velocity (rpm). All the samples were cleaned with acetone before and after the experiments. Each test was performed five times and an average value of the test result has been shown.
2.4 Extreme pressure test
2.5 Scuffing test
In order to compare the scuffing resistivity of MCO and NCO, in-house scuffing equipment was fabricated. A 1Hp 440v AC power motor is used to supply power to the test-rig and the speed is controlled using the variable frequency controller. The motor and the driving shaft are connected with the help of couplings. A weight hanger is provided on the driven shaft. The idle gear set was greased for smooth operation. It had to be ensured that the idle set does not wear out sooner than the test pair. After ensuring proper lubrication in all the bearings and the gear set, the test pair was given drop lubrication for boundary lubrication. This condition was monitored and assured every time the machine was operated. After arranging the drop lubrication, the ac drive controller was powered on from the three phase power supply. The experiments were conducted at 140 KN, 40 hours. The tooth flanks were inspected after every regular interval (40-45 minutes) for scuffing marks.
2.6 Viscosity, fire and flash point tests
Viscosity, fire and flash points are important properties of any lubricant. In the present work viscosity was measured using a Redwood viscometer and fire and flash points were measured using Pensky martin closed cup method (castor oil) and Cleveland open cup method (mineral oil).
2.7 Design of experiments for pin-on-disc
Taguchi design of experiment technique enables us to model the experiments and analyse the influence of various parameters. In the present work, load and rpm have been considered as design parameters. The coefficient of friction and frictional force have been considered as outputs or responses. Three levels within the operating range of parameters have been selected for each of the factors. In the present work, L9 orthogonal array has been considered for experiments as shown in Table 1.
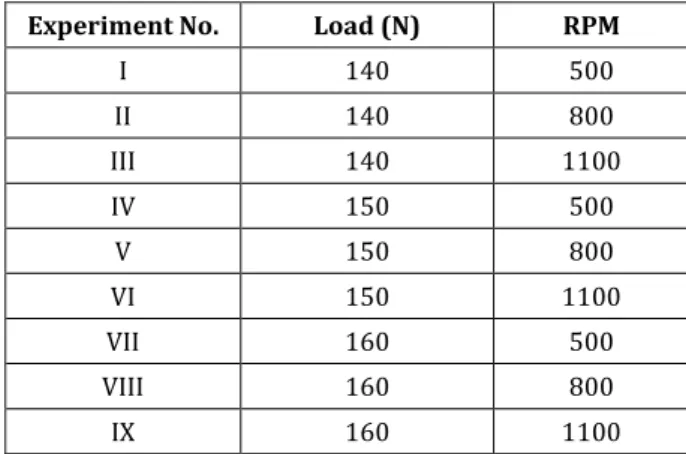
Table 1. L9 orthogonal array.
Experiment No. Load (N) RPM
I 140 500
II 140 800
III 140 1100
IV 150 500
V 150 800
VI 150 1100
VII 160 500
VIII 160 800
IX 160 1100
2.8 ANOVA analysis
The purpose of analysis of variance (ANOVA) is to predict the significant factors affecting the responses and thus, has been used in this work.
3. RESULTS
3.1 Analysis of Viscosity, Flash and Fire Points
Viscosity is an important factor in determining the formation of lubricant film. In the present work, the viscosity has been measured at 40 ⁰C and 100 ⁰C using Redwood viscometer. As observed from Table 2, the viscosity of neat castor oil is less than mineral oil but both flash and fire points in case of castor oil is higher than mineral oil.
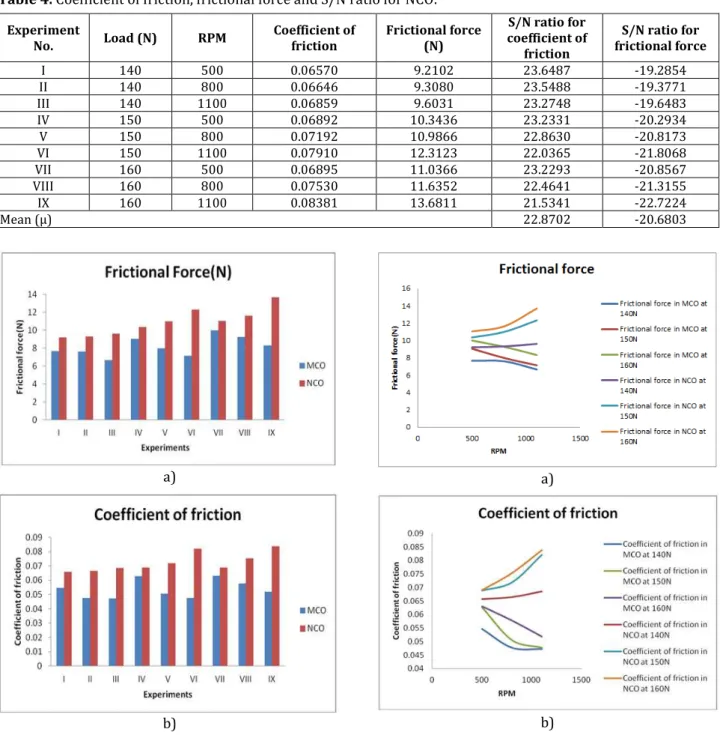
3.2 Antiwear test
The antiwear tests were carried out using a pin-on-disc tribometer. As observed from Fig. 1 and Fig. 2, both frictional force and coefficient of friction in case of mineral oil are less as compare to neat castor oil. Further, it can also be observed that the coefficient of friction and frictional force decreases with the increase in speed while in case of castor oil both coefficient of friction and frictional force increases with the increase in speed for each load (Fig. 2).
Table 2. Properties of mineral oil and castor oil.
Lubricants Viscosity at 40 ⁰C (cSt) Viscosity at 100 ⁰C (cSt) Flash point ⁰C Fire Point ⁰C Viscosity Index
Mineral oil 372.31 47.17 210 220 187
Table 3. Coefficient of friction, frictional force and S/N ratio for MCO.
Experiment
No. Load (N) RPM
Coefficient of friction
Frictional force (N)
S/N ratio for coefficient of
friction
S/N ratio for frictional force
I 140 500 0.0546 7.65306 25.2561 -17.6767
II 140 800 0.0477 7.58950 26.4296 -17.6043
III 140 1100 0.0472 6.65402 26.5212 -16.4617
IV 150 500 0.0627 9.04590 24.0546 -19.1290
V 150 800 0.0505 7.97130 25.9342 -18.0306
VI 150 1100 0.0477 7.13687 26.4296 -17.0702
VII 160 500 0.0630 9.98930 24.0132 -19.9907
VIII 160 800 0.0578 9.26080 24.7614 -19.3330
IX 160 1100 0.0519 8.31480 25.6967 -18.3970
Mean µ 25.4551 -18.1881
Table 4. Coefficient of friction, frictional force and S/N ratio for NCO.
Experiment
No. Load (N) RPM
Coefficient of friction
Frictional force (N)
S/N ratio for coefficient of
friction
S/N ratio for frictional force
I 140 500 0.06570 9.2102 23.6487 -19.2854
II 140 800 0.06646 9.3080 23.5488 -19.3771
III 140 1100 0.06859 9.6031 23.2748 -19.6483
IV 150 500 0.06892 10.3436 23.2331 -20.2934
V 150 800 0.07192 10.9866 22.8630 -20.8173
VI 150 1100 0.07910 12.3123 22.0365 -21.8068
VII 160 500 0.06895 11.0366 23.2293 -20.8567
VIII 160 800 0.07530 11.6352 22.4641 -21.3155
IX 160 1100 0.08381 13.6811 21.5341 -22.7224
Mean µ 22.8702 -20.6803
a)
b)
Fig. 1. a) Frictional force; b) Co-efficient of friction.
a)
b)
As stated earlier, three levels L9 orthogonal array has been considered for experimentations. The experimental values along with the design matrix are shown in Table 3 and Table 4. The S/N ratio is calculated based on quality of characteristics. The objective function of this investigation is to minimise the coefficient of friction and frictional force between two interacting surfaces. Thus, the smaller (the best) S/N ratio is indicative according to the formula:
S
Nratio η =- log n∑i= n y (1)
where n – no. of experiments, y - no. of response value. Minitab 16.2.4 software was used to estimate the parameters shown in the present work.
a)
b)
c)
d)
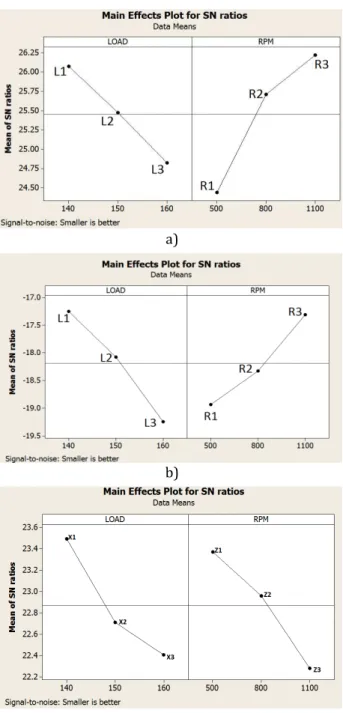
Fig. 3. Factor effect diagram for a) coefficient of friction in case of mineral; b) frictional force in case of MCO; c) coefficient of friction in case of castor oil; d) frictional force in case of NCO.
As observed from Fig. 3, the optimum level setting of parameters are L1-R3 for co-efficient of friction and frictional force in case of mineral oil and X1-Z1 for coefficient of friction and frictional force in case of castor oil.
The predicted S/N ratio η using the optimal
levels of control parameters can be calculated as:
�
′= �
�+ ∑
�=��
�− �
�(2)
where: ηm - total mean of S/N Ratio; ηi - mean of
S/N Ratio at the optimum level; p - is the number of main parameters that significantly affect the performance.
Thus, from the above definition (Table 5):
Predicted value of coefficient of friction using MCO = 0.04552.
Predicted value of frictional force using MCO = 6.5855 (N).
Predicted value of coefficient of friction using NCO = 0.06316.
Predicted value of frictional force using NCO = 8.8203(N).
Table 5. Predicted and Experimental values for MCO and NCO.
Parameters
MCO NCO
Predicted Value
Experimen. Value
Predicted Value
Experimen. Value
Coefficient of
friction 0.04552 0.0472 0.06316 0.06570 Frictional
3.3 ANOVA analysis
The purpose of ANOVA analysis is to find the significant factors affecting coefficient of friction and frictional force. The ANOVA table is calculated as shown in Tables 6-9.
The p-value in case of load and RPM in both mineral and castor oil is very close to 0.05, hence, both load and rpm have roles to play in minimizing the coefficient of friction and
frictional force. The higher R² value indicates
that the selected model fits the data in
determining the frictional force at the interface of the two mating bodies in both MCO and NCO.
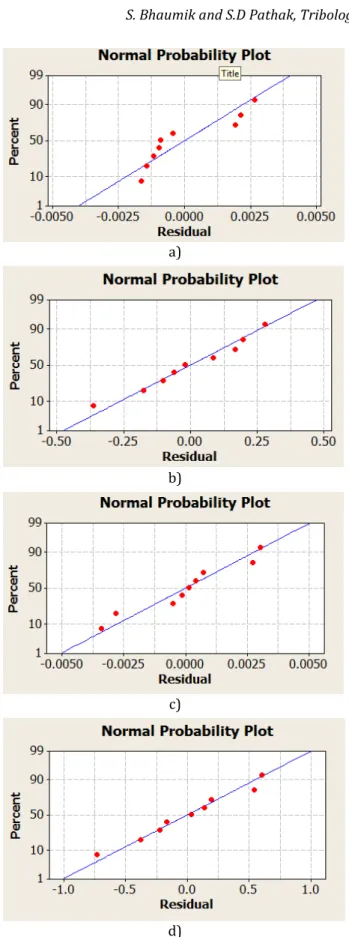
The normal probability plot shown in Fig. 4 is the result of testing of normality of the experimental results and it shows the predicted versus actual values for the design matrix. For any ANOVA analysis it is very much important that the normal probability plot should be closer to the mean line. As observed from Fig. 4 all the experimental values are much closer to the mean line.
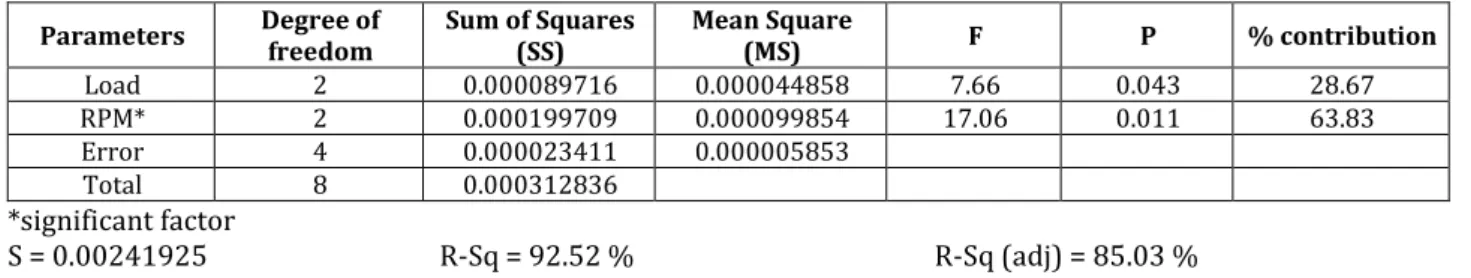
Table 6. Results for ANOVA analysis for coefficient of friction using mineral oil.
Parameters Degree of freedom
Sum of Squares (SS)
Mean Square
(MS) F P % contribution
Load 2 0.000089716 0.000044858 7.66 0.043 28.67 RPM* 2 0.000199709 0.000099854 17.06 0.011 63.83 Error 4 0.000023411 0.000005853
Total 8 0.000312836 *significant factor
S = 0.00241925 R-Sq = 92.52 % R-Sq (adj) = 85.03 %
Table 7 Results for ANOVA analysis for frictional force using mineral oil.
Parameters Degree of freedom
Sum of Squares (SS)
Mean Square
(MS) F P % contribution
Load* 2 5.4289 2.7144 33.17 0.003 58.39
RPM 2 3.5401 1.7700 21.63 0.007 38.08
Error 4 0.3274 0.0818
Total 8 9.2963
*significant factor
S = 0.286077 R-Sq = 96.48 % R-Sq (adj) = 92.96 %
Table 8. Results for ANOVA analysis for coefficient of friction using castor oil.
Parameters Degree of freedom
Sum of Squares (SS)
Mean Square
(MS) F P % contribution
Load 2 0.0001311 0.0000656 7.07 0.049 43.48
RPM* 2 0.0001333 0.0000667 7.19 0.047 44.21
Error 4 0.0000371 0.0000093
Total 8 0.0003015
*significant factor
S = 0.00336103 R-Sq = 87.70 % R-Sq (adj) = 75.40 %
Table 9. Results for ANOVA analysis for frictional force using castor oil.
Parameters Degree of freedom
Sum of Squares
(SS) Mean Square (MS) F P % contribution
Load* 2 11.7321 5.8660 15.99 0.012 66.36
RPM 2 4.4778 2.2389 6.10 0.061 25.33
Error 4 1.4673 0.3668
Total 8 17.6771
*significant factor
a)
b)
c)
d)
Fig. 4. Normal probability plot of a) coefficient of friction for MCO; b) frictional force for MCO; c) coefficient of friction for NCO; d) frictional force for NCO.
The normal probability plot shown in Fig. 4 is the result of testing of normality of the experimental results and it shows the predicted
versus actual values for the design matrix. For any ANOVA analysis it is very much important that the normal probability plot should be closer to the mean line. As observed from Fig. 4 all the experimental values are much closer to the mean line.
3.4 Regression Equations
The experimental values are fitted to the following regression equations and the usual statistics were used to determine the goodness of fit. From the statistical point of view it is important to determine the residuals for normality, independence and constant variance which have been shown above.
The regression equations for coefficient of friction and frictional force in case of MCO and NCO are as follows:
��� � = . + . � �� − . � � (3) ���� = − . + . � �� + . � � (4) �� � = − . + . � �� − . � �
(5) ��� = − . + . � �� + . � �
(6)
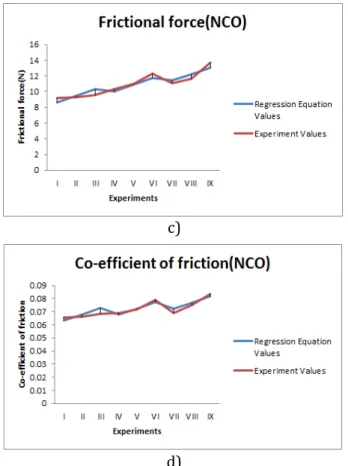
As observed from Fig. 5 both the experimental results and regression results were very close to each other.
a)
c)
d)
Fig. 5. Regression and experimental values in MCO and NCO.
Hence, the design of experiment model chosen for the work was appropriate. Since, the experimental values were nearly normally fitted (Fig. 4) in both NCO and MCO, a power transform was not generated using the Box-Cox plot or else the model had to be transformed to higher polynomial levels for accurate results.
3.5 Extreme pressure test
The load carrying capacity of the mineral oil and castor oil has been analysed using a four ball tester. As observed from Fig. 6, both pass and weld loads are higher in case of mineral oil as compared with neat castor oil. The lower pass load and weld load in case of castor oil may be due to the lower viscosity of castor oil, due to which the thickness of the lubricant film may have been thinner as compared to the mineral oil. The lower viscosity index in case of neat castor oil also signifies the instability of lubricant film.
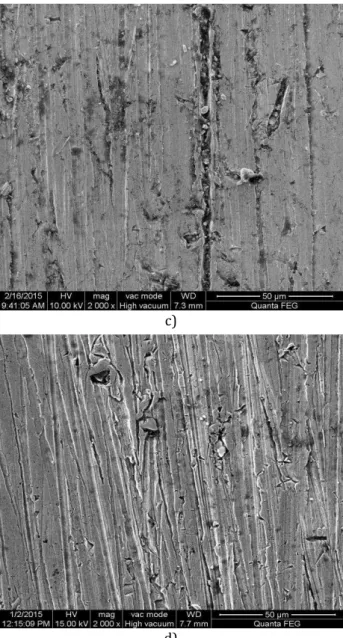
As observed from Fig. 7, the plastic deformation in case of neat castor oil is much higher than the mineral oil. Though deep grooves are being
observed in both MCO and NCO but the surface in case of NCO has been observed to be more detoriated than MCO. This shows that the lubricant film in case of NCO was weaker as compared to MCO due to which plowing has occurred severely on the surface on NCO pins.
Fig. 6. Pass and weld loads for MCO and NCO.
a)
c)
d)
Fig. 7. SEM images of (i) balls after pass loads in four ball tester in a) MCO; b) NCO. (ii) Pins after testing (150N, 800 rpm) in c) MCO; d) NCO.
The EDS analysis as shown in Fig.8 the pin samples after the tribo tests shows that not much of elemental changes have been taken place.
a)
b)
Fig. 8. EDS analysis of the pins after test a) MCO; b) NCO.
3.6 Determination of scuffing resistivity
In order to compare the scuffing resistivity of MCO and NCO, in-house scuffing equipment (Fig. 9) was fabricated according to the details shown in Table 10.
(1) Test Gear Box; (2) Journal Bearings; (3) Slave Gear; (4) Coupling; (5) Pinion; (6) Ball Bearing; (7) Weight Hanger
Table 10. Test Gear Design [17].
Dimension Symbol Units Pinon Gear
Number of Teeth z number 20 30
Pitch circle Diameter dp mm 72.570 108.857
Base Circle Diameter db mm 68.194 102.293
Tip Diameter dt Mm 82.042 116.713
Pressure Angle αn Deg 20 20
Center Distance a mm 91.5 91.5
a) b)
c) d)
Fig. 10. Gear tooth profile using (i) mineral oil, a) before the experiment; b) after 40 hrs of intermittent running, (ii) using castor oil, c) before experiment; d) after 40 hrs of intermittent running.
i. a) i. b) ii. c) ii. d)
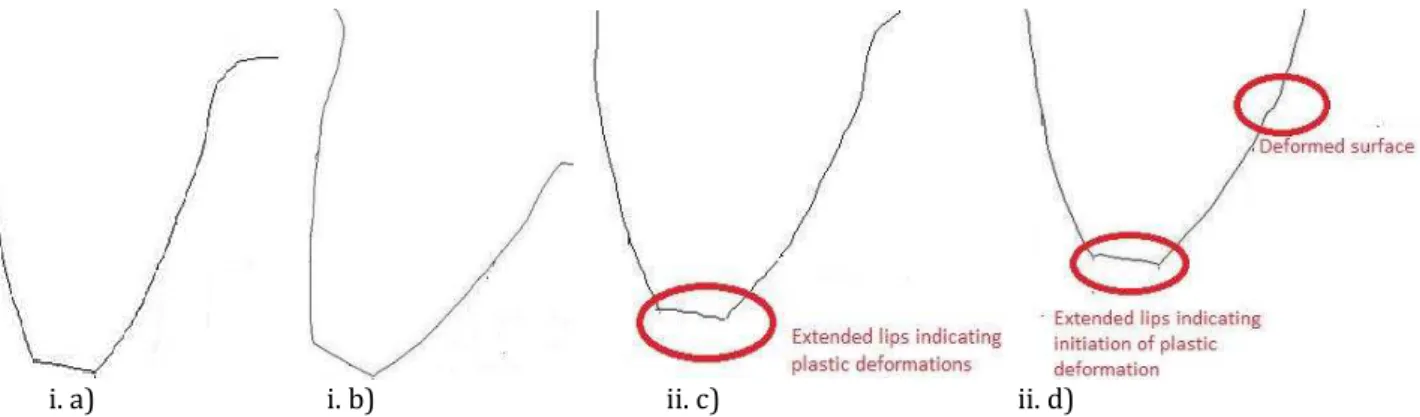
Fig. 11. Gear tooth profile (i) before the experiment – a) MCO; b) NCO; (ii) after 40 hrs of intermittent running – c) MCO; d) NCO.
Table 11. Surface roughness
Samples Roughness before test µm Roughness after test µm Percentage increase (%)
MCO 1.547 2.613 40.91
NCO 1.117 3.429 67.42
It was observed (Fig. 10 and Fig. 11) that the tooth of the gears in both MCO and NCO were deformed after 40 hrs of intermittent running. Extended lips were observed on the tips of the teeth in both NCO and MCO. These extended lip formations, which are types of gear failures, occur generally due to the plastic deformations which result due to failure of lubricating films. Furthermore, the increase in roughness values (Table 11) also showed that the lubricant film was less stable in case of NCO as compared to MCO.
4. DISCUSSIONS
(roughness increased due to metal to metal contact due to film breakage) may be the reasons for NCO lubricant film breakage which inturn increased the COF. Furthermore, at high speeds, the lubricating oil is dragged to the inlet of the contact and the lubricating film thickness varies according to the viscosity [19]. It is an important point to note that MCO follows the classical Stribeck curve while it is not follwed in case of NCO. The friction graphs thus show that MCO attained elasto hydrodynamic lubrication
(EHL) phase from boundary or mixed
regime.The mineral oil would have formed stable lubricating film and thus, the COF of MCO has been observed to be lower than NCO in all the experiments .Due to the presence of various additives in MCO the load bearing capacity of MCO is higher than NCO.
The following has been observed from the present work:
1. Viscosity and viscosity index of neat castor oil is lower than that of mineral oil.
2. Coefficient of friction and frictional force is higher is case of neat castor oil as compared with mineral oil.
3. Load carrying capacity of neat castor oil is lesser than that of mineral oil.
4. SEM images showed higher plastic
deformation on the ball surfaces in case of neat castor oil as compared with that of mineral oil. Thus, it can be predicted that film formed in case of neat castor oil is weaker as compared with that of mineral oil.
5. The teeth profile in both mineral oil and castor oil has shown detoriation after 40 hrs of running condition.
6. The increase in surface roughness on the teeth of gears is higher in case of castor oil as compared with that of mineral oil.
7. Plastic deformations has been observed (Fig. 11) on the tip of the tooth of the gears in both mineral and castor oil but a slight deformation near the pitch line has been observed in case of castor oil.
8. From ANOVA analysis it has been observed that RPM is the significant factor while determining the coefficient of friction and the normal load is the significant factor while determining frictional force.
9. The results obtained from experiments and regression analysis are very close to each other and hence, the Taguchi L9 orthogonal array of design of experiment can be used in analysing the tribological behaviour of mineral and neat castor oil.
5. CONCLUSION
As observed from the present work the tribological properties of neat castor oil are inferior to the mineral oil, although from close observation of the results we find that the values in both the cases are much closer to each other. The commercial mineral oil contained additives and thus, performed better as compared to the neat castor oil. Hence, more detailed research work would be carried out using various types of additives in castor oil to get a good fomulation of castor oil which may replace mineral oil in many applications,thus, reducing the impact on environment. The results of the future research would be reported in future articles.
Acknowledgement
The authors would like to acknowledge the supports of the Director (E&T), Dean-School of
Mechanical Engineering, Nanotechnology
Research Centre and to students Korah Jacob, Ruben Chatterjee, Unmeelan Chakrabarti, Shashank Tyagi, Mohammed Yaser E K, Sandeep G, Aashirwad Chakraborty and Chandan of SRM University, Kattankulathur, Chennai.
REFERENCES
[1] A. Imran, H.H. Masjuki, M.A. Kalam, M. Varman, M. Hasmelidin, K.A.H. Al Mahmud, S.A. Shahir and M. (abibullah, Study of Friction and Wear Characteristic of Jatropha Oil Blended Lube Oil ,
Procedia Engineering, vol. 68, pp. 178-185, 2013.
[2] S. Syahrullaila, S. Kamitanib and A. Shakirina, Performance of Vegetable Oil as Lubricant in Extreme Pressure Condition , Procedia Engineering, vol. 68, pp. 172-177, 2013.
[4] S.M. Alves, B.S. Barros, M.F. Trajano, K.S.B. Ribeiro and E. Moura, Tribological behavior of vegetable oil-based lubricants with nanoparticles of oxides in boundary lubrication conditions , Tribology International, vol. 65, pp. 28-36, 2013.
[5] L.A. Quinchia, M.A. Delgado, T. Reddyhoff, C. Gallegos and (.A. Spikes, Tribological studies of potential vegetable oil-based lubricants containing environmentally friendly viscosity modifiers , Tribology International, vol. 69, pp. 110-117, 2014.
[6] N.H. Jayadas, K.P. Nair and G. Ajithkumar, Tribological evaluation of coconut oil as an environment friendly lubricant , Tribology International, vol. 40, pp. 350-354, 2007.
[7] S. Bekal and N.R. Bhat, Bio-lubricant as an alternative to mineral oil for a CI engine-an experimental investigation with Pongamia oil as a lubricant , Energy Sources, vol. 34, pp. 1016-26, 2012.
[8] C.V. Ossia, H.G. Han and H. Kong, Response surface methodology for eicosanoic acid triboproperties in castor oil , Tribology International, vol. 42, pp. 50-58, 2008.
[9] M.H. Saad Elmunafi, D. Kurniawan and M.Y. Noordin, Use of Castor Oil as Cutting Fluid in Machining of Hardened Stainless Steel with Minimum Quantity of Lubricant , Procedia CIRP, vol. 26, pp. 408-411, 2015.
[10] M. Maleque, H. Masjuki and S. Sapuan, Vegetable-based biodegradable lubricating oil additives , Industrial Lubrication and Tribology, vol. 55, pp. 137–43, 2003.
[11] C. Georgescu, L.C. Solea, L. Deleanu, The Influence of degumming process on tribological
behaviour of soybean Oil , Tribology in Industry, vol. 37, no. 3, pp. 330-335, 2015.
[12] Y.M. Shashidhara and S.R Jayaram , Vegetable oils as a potential cutting fluid – an evolution , Tribology International, vol. 43, pp. 1073-1081, 2010.
[13] A. Adhvaryu and S.Z Erhan, Tribological studies of thermally and chemically modified vegetable oils for use as environmentally friendly lubricants , Wear, vol. 257, pp. 359-367, 2004. [14] G. Biresaw, Elastohydrodynamic properties of
seed oils , Journal of the American Oil Chemists' Society, vol. 83, pp. 559-566, 2006.
[15] R. Sanchez, M. Fieldler, E. Kuhn and J.M Franco, Tribological characterization of green lubricating greases formulated with castor oil and different biogenic thickener agents: a comparative experimental study , Industrial Lubrication and Tribology, vol. 63, no. 6, pp. 446-452, 2011.
[16] M.V. Thottackkad, R.K. Perikinalil and P.N. Kumarapillai, Experimental evaluation on the tribological properties of coconut oil by addition of CuO nanoparticles , International journal of precision engineering and manufacturing, vol. 13, no. 1, pp. 111-116, 2012.
[17] W.A. Bradley, AGMA tribology test report, 2005. [18] D. Zhu, On the E(L film breakdown ,
Tribological Research and Design for Engineering Systems, vol. 41, pp. 559-571, 2003.