Artigo
*e-mail: [email protected]
ANALYSIS OF THE PERFORMANCE OF A PACKED BED REACTOR TO PRODUCTION ETHYL ESTERS FROM CRUDE VEGETABLE OIL USING LIPASE IMMOBILIZED IN SILICA MODIFIED WITH PROTIC IONIC LIQUID
Juliana Lisboa Santanaa, Juliana Marçal de Oliveiraa, Nayara Bezerra Carvalhoa, Natália Maria Ferreira de Melo Osóriob,
Silvana Mattedic, Lisiane dos Santos Freitasd, Eliane Bezerra Cavalcantia, Álvaro Silva Limaa and Cleide Mara Faria
Soaresa,*
a Instituto de Tecnologia e Pesquisa, Universidade Tiradentes, 49010-390 Aracaju – SE, Brasil
bEscola Superior de Tecnologia do Barreiro, Instituto Politécnico de Setúbal, 2910-761 Lavradio, Portugal cDepartamento de Engenharia Química, Universidade Federal da Bahia, 40210-730 Salvador – BA, Brasil dDepartamento de Química, Universidade Federal de Sergipe, 49100-000 São Cristóvão, Sergipe – SE, Brasil
Recebido em 09/04/2018; aceito em 12/06/2018; publicado na web em 19/07/2018
The objective this study was to evaluated the influence of silica modified with protic ionic liquid (PIL) on an immobilized biocatalyst by covalent binding of Burkholderia cepacia lipase (BCL) in a PBR and in the transesterification reaction, by characterization and mass transfer of the system studied. The results showed that maximum conversion of ethyl esters was 39 ± 1.73% at 96 h (IB on control silica) and 47 ± 2.0% in 72 h (IB on modified silica). The PIL also influenced the analysis of residence time distribution (RTD) with the mean time ranging from 14.94 (control silica) to 25 min (modified silica). Variation of the reaction parameters (temperature, flow rate and molar ratio) positively influenced the mass transfer coefficient (kc) which varied from 0.95 × 10⁻⁴ to 2.39 × 10⁻⁴ m s−1 (IB on control silica) and from 1.22 × 10⁻⁴ to 3.06 × 10⁻⁴ m s−1 (IB on modified silica).
Keywords: packed bed reactor; residence time distribution; mass transfer; ionic liquid.
INTRODUCTION
The main advantage of enzymatic catalysis is making the manufacturing process more environmentally compatible and sustainable; on the other hand, the high cost of enzymes makes the process impractical.1 Thus, the immobilization of enzymes on heterogeneous supports increases process stability allowing reuse and their use in continuous reactors.2,3 Among the different methods of immobilization, the most used are physical adsorption, covalent binding and encapsulation.4-6 Covalent binding is based on the formation of a strong bond between enzyme and support, that is, the amine group of the enzyme binds to the silanol group of silica by a spacer arm (epoxy group consisting of an oxygen atom attached to two carbons) provided by an epichlorohydrin bifunctional agent.7,8 According to the literature enzymes immobilized by the covalent binding method are stable, that is, the enzyme does not dissociate from the support in the presence of the substrate.9
Further, the reactor configuration, including the choice of the ideal support in the immobilization technique, is fundamental as it will provide an immobilized biocatalyst (IB) with improved operational stability during the reaction.10 Porous supports, such as silica, offer a great surface area (favoring immobilization); further, surface modification is possible by the use of additives, such as ionic liquids (ILs).11,12
Silica-based support and its derivatives are the most studied materials for the application in the immobilization of enzymes, since it is a multifunctional material. Many porous supports such as silica shows numerous advantages, such as pore size and a narrow pore-size distribution can to increase the amount of enzyme immobilized on its surface.12,13 Other advantages is the fact that silica is insoluble in aqueous media, thermally, mechanically and chemically stable, in addition to resistance to microbial attacks.14 In addition, silica have
functional groups on its surface that facilitate the enzyme binding and also the possibility of surface modification, such as pore enlargement and volume with the use of modifying agents,15 which in this work is used the protic ionic liquid for this modification.
According to Álvarez et al.,16 ILs are considered green solvents in the biocatalytic process, due to their unique properties such as thermal stability and low volatility. They are classified into aprotic ionic liquids (AILs) and protic ionic liquids (PILs). PILs are obtained from amines, organic and inorganic acids, have low cost and simplicity of synthesis, which favors industrial interest.16,17 To date, the use of batch reactors has been reported in the literature for studying the influence of using modified silica for the immobilization of Burkholderia cepacia lipase in the transesterification reaction.18,19
Souza et al.,19 immobilized Burkholderia cepacia lipase by the sol–gel technique using the PIL N-methyl monoethanolamine. IB was applied in the transesterification reaction, containing soybean oil and ethyl alcohol (ratio 1 : 15.2) and 0.075 g water at a temperature of 308 K. The obtained result showed that the maximum conversion of ethyl esters was 46.5% in 72 h, for the IB with PIL, while the maximum conversion to ethyl esters for the control IB was only 1.3% in 48 h. However, Oliveira et al.,18 obtained a maximum conversion to biodiesel of 98% in 96 h, using the same IB with PIL, but with different reaction parameters: temperature 313 K and molar ratio 1 : 7 (babassu oil and ethanol).
has many advantages, such as the ease of separating the biocatalyst and substrate, the possibility to operate over long periods (preventing loss of enzyme activity) and greater control of reaction parameters. Furthermore, it provides high surface area and a compact design.23,24
Characterization of the fluid inside the PBR is necessary to obtain information about the influence the biocatalyst exerts on the reaction. The most widely used technique is the residence time distribution (RTD), which determines the conduct that carries fluid inside the reactor. This residence time depends on the fluid flow and directly influences the conversion rate of the reactions.24,25 Both thermophysical properties and the behavior of the blend affect the mass transfer. Thus, it is essential to understand the operating parameters, substrate properties, the structure of the reactor, RTD and flow behavior for modeling optimization and reactor design.25 In this work enables the study the transformation of crude vegetable oil using immobilized lipase and the developing fundamental engineering science that underpins the study.
Still Moment the literature not related use oil crude using packed bed reactor and determine the mass transfer coefficient to PIL modified silica. Other exception is for the type oil (crude vegetable oil) in this studied. Because literature articles are about waste cooking oils using as biocatalyst the Novozyme 435.26,27 Therefore in this work the emphasize was use used PIL modified silica as filling of packed bed reactor and after contribution to the transesterification process using crude vegetable oil. Considering all these aspects, in the present article the objective of this study was to apply Burkholderia cepacia lipase immobilized on PIL modified silica in the transesterification reaction using a PBR and to characterize and determine the mass transfer coefficient of the system studied.
MATERIALS AND METHODS
Materials
Burkholderia cepacia lipase (BCL) (2220 U g−1) and tetraethoxysilane (TEOS) (98%) were purchased from Sigma Aldrich and used as purchased without the need for extra purification. Also used were: hexane (99%) (Vetec), ammonium hydroxide (28–38%) (Vetec), ethyl alcohol (99%) (Synth), hydrochloric acid (> 36%) (Vetec), polyethylene glycol (PEG) 1500 (Vetec) and epichlorohydrin (98%) (Fluka). Crude coconut oil was purchased from the local market. The Federal University of Bahia (UFBA) provided the PIL (N-methyl-2-hydroxyethylammonium pentanoate). Toyobo Textile Industry of Brazil Limited provided the tracer Disperse Blue C-2R.
Preparation of the control and PIL-modified supports
The silica support was prepared by the sol–gel technique as described by Souza et al.,19 with some modifications, in which the TEOS (30 mL) was dissolved in ethyl alcohol (36 mL) under an inert nitrogen atmosphere and stirred at 100 rpm at 308 K. Furthermore, a pre-hydrolyzing solution (hydrochloric acid) was slowly added and stirred for 90 min. Then, 1% PIL (v v−1) was added to prepare the modified support and the solution was hydrolyzed with 1 mL ammonium hydroxide and 6 mL ethyl alcohol. Further, the mixture was allowed for rest for 60 min and then taken to a refrigerator for 24 h to complete polycondensation. Then, the material was washed with hexane through a Soxhlet extractor (Nova Etica) for a period of 12 h and kept in a desiccator for 72 h.
Immobilization by covalent binding method
The prepared support was used for the immobilization of BCL
according to the methodology described by Paula et al.,28 The support was treated with a sodium phosphate buffer pH 7.5 (10 mL per gram of support) and epichlorohydrin (2.5% v v−1) under stirring for 2 h at 298 K. Further, the solution was washed with buffer and distilled water, and then was allowed to dry in an oven (333 K) for 20 h. Then, the treated support was soaked in hexane (10 mL per gram of treated support) and stirred (170 rpm) for 2 h at 298 K. Further, BCL was added (0.250 g per gram of treated support) with a solution of PEG with molecular weight 1500 (0.020 g PEG diluted in 4 mL of ultrapure water) and stirred for 2 h. The immobilized lipase was carried to a refrigerator for 20 h and then passed through a washing process with hexane and kept in a desiccator for 48 h. The catalytic activity of the bicatalysts immobilized on both silica and modified silica had a mean of 1200 U g-1.
Characterization of the IB, oil and substrate
Brunauer–Emmett–Teller analysis (BET) was conducted to determine the surface area, pore volume and pore size for the control and PIL-modified silica and also for IB on control silica and IB on modified silica. The dynamic viscosity and the density of the substrate (coconut oil and ethanol) and coconut oil only were determined in a Stabinger viscometer (model SVM 3000) at the study conditions (temperature and molar ratio).
The acid value was also measured according to the European standard EN 14214 methods for crude coconut oil and extra virgin coconut oil.
Ethyl ester synthesis
Reactions were carried out in a glass-jacketed PBR (Figure 1) with an external diameter of 2.4 cm, internal diameter of 1 cm, 10 cm height and a total volume of approximately 7.85 mL. The PBR was connected to a water recirculation bath to maintain the temperature at 313 K. Then, the column was filled with IB and the substrate (raw coconut oil and ethyl alcohol, 1 : 7) was left in a stirred alimentation tank with temperature controlled by a hot plate. The continuous ascendant flow was pumped by a Milan peristaltic bomb (209 model), with a flow of 0.15 mL min−1.
Ethyl ester quantification
Supelcowax 10 column (30 m × 0.25 mm × 0.25 µm). For sample injection into the chromatograph, 0.01 g of sample was diluted with hexane in a volumetric flask (10 mL); furthermore, 200 µL of sample and 200 µL of the internal standard solution (methyl heptadecanoate) were diluted in hexane in another volumetric flask (2 mL). The column temperature was initially maintained at 130 °C, with a heating ramp of 20 °C min−1 to 220 °C, 0.5 °C min−1 up to 222 °C and 20 °C min−1 to 250 °C with a total analysis time of 14.9 min. The esters were quantified according to the calibration curves. The FAEEs standards (C4–C24 Even Carbon Saturated) were purchased from Sigma Aldrich.
Residence time distribution (RTD)
In the determination of residence time, an initial scan was carried out in a Varian spectrophotometer (Cary 50 Bio), in order to determine the tracer’s wavelength (605 nm). Then, measurements were conducted at different concentrations of tracer diluted in the substrate, with the purpose of building a calibration curve of absorbance as a function of tracer concentration. After the curve was built, the RTD test was ready to start. The test took place at 313 K and a flow rate of 0.15 mL min−1, using a tracer solution with a concentration of 1 mg mL−1. Samples were collected every 5 min and read on the spectrophotometer, in order to determine the RTD parameters.
Modeling
Residence time distribution (RTD)
The RTD can be described according to the period of time the tracer takes to exit the reactor completely, obtained by Equation 1.29-31
(1)
where C(t) is the tracer concentration at time t. The mean residence time was obtained by Equation 2, being compared with the theoretical average time (Equation 3) according to that established by Levenspiel27
(2)
(3) where V corresponds to the volume of the void space in the reactor and v the used flow. The variance and skewness were determined by Equations 431 and 5,29 respectively:
(4)
(5)
With the parameters of RTD determined, the normalized RTD function (θ) was obtained instead of the function RTD E(θ), with the θ parameter defined by Equation 6,31,32 and then obtaining the dimensionless RTD function (Equation 7).
(6)
(7)
From the obtained RTD parameters was chosen an axial dispersion model for a closed-closed reactor, to determine the dispersion number (D µL−1) (Equation 8), where the dispersion number is the reciprocal of the Peclet number.32
(8) In order to analyze the mass transfer effect theoretical calculations were performed in order to estimate the mass transfer coefficient. Mass transfer correlations are reported in the literature to assist in determining the mass transfer coefficient.
Mass transfer coefficient
According to Seguin et al.,33 the Sherwood number (Sh) (Equation 9) relates the particle Reynolds number (Rep) (Equation 10) with the Schmidt number (Sc) (Equation 11), considering spherical porous particles.
(9)
(10)
(11)
where ρ corresponds to the specific mass of the substrate, U the interstitial velocity of the substrate, dp the diameter of the particle, µ
the dynamic viscosity of the substrate and DAB the diffusivity of the
substrate,34 defined by Equation 12.
(12)
where φ corresponds to the association factor (1.5),34M
o the molecular
weight of the coconut oil, T the temperature (K), µo the dynamic
viscosity of the substrate and ve is the molar volume of ethyl alcohol.
The mass transfer coefficient is the relation of Sh to the diffusivity and the diameter of the catalyst particle (Equation 13).
(13)
RESULTS AND DISCUSSION
Characterization of the IB and substrate
The physical characterizations were conducted by the BET method, determining the surface area and pore volume of the support and IB, and the results confirmed the modification of the support with the use of the PIL. There was an increase in surface area from 799.5 (control silica) to 853.3 m2 g−1 (modified silica) and pore volume from 0.57 (control silica) to 1.02 cm3 g−1 (modified silica), when PIL was added in production of the support. The pore size was around 2 to 50 nm, where the value major distribution was to modified silica thereabout 50 nm. The addition of PIL at the preparation moment of silica support altered the morphological structure of the support, thus increasing both the surface area and the pore volume. This structural change is caused by the addition of PIL, in which the PIL at the moment of preparation of the sol-gel, being hydrophobic, repels the water causing the increase of the pores at the moment of gelation.19
gels when a solvent (such as a PIL) is used. The vapor pressure prevents the evaporation of the solvent and its high ionic strength increases the aggregation rate. However, both dimensions of the IB surface area determined were similar, 349.4 (IB on control silica) and 371.9 m2 g−1 (IB on modified silica), although the pore volume of BCL on control silica (0.35 cm3 g−1) was less than BCL on modified silica (0.67 cm3 g−1), supposedly due to the presence of a spacer arm provided by epichlorohydrin that linked the lipase on the surface and in the pores to the support at the time of immobilization.
To assist in the characterization and determination of the mass transfer coefficient of the PBR, besides the characterization of IB it was necessary to determine the viscosity and density of the substrate. The parameters necessary to study the system are described in Table 1.
Transesterification reaction
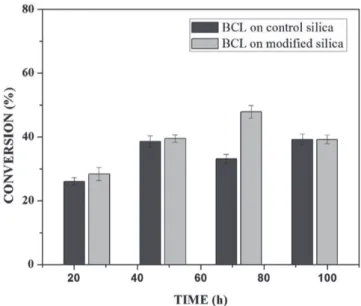
In this study, the transesterification reaction of crude coconut oil and ethyl alcohol was carried out in a closed system, with reaction times between 24 and 96 h for BCL on control silica and silica modified with PIL. The conversions for both IBs are shown in Figure 2. For the transesterification using BCL on control silica, the conversion achieved between 26 ± 1.13% and 39 ± 1.73% at the maximum conversion time of 96 h. However, when using BCL on modified silica conversion varied between 28 ± 2.03% and 47 ± 2.06% for the maximum conversion in 72 h of reaction. Higher conversion of BCL was observed on modified silica, due to the change in surface area that occurred by the presence of PIL and the increase in pore size.12 Thus, the substrate remained in contact with BCL on the modified silica for a longer time.
Thus, was performed a test in the same experimental parameters that showed higher conversion the ethyl esters of the crude coconut oil in extra virgin coconut oil. The conversion of the ethyl esters obtained for the extra virgin coconut oil was higher, approximately 64 ± 0.55%. The low conversion of ethyl esters to the transesterification reaction to crude coconut oil, possibly was due to the presence of antioxidants, phospholipids, impurities and a high acid value (0.84 for crude coconut oil and 0.21 for extra virgin coconut oil), characteristics of crude vegetable oils that don’t undergo a refining or degumming process.36
Another factor that can have influenced the low conversion of ethyl esters is the accumulation of glycerol in the lower part of the PBR reactor, thereby decreasing the catalytic activity of the
immobilized lipase, the glycerol being hydrophilic and oil-insoluble, it is absorbed on the surface of the lipase resulting in the loss of immobilized lipase activity.37,38 Thus, a compromise solution needs to be reached.
The literature presents studies using PBRs in a closed system. According to Wang et al.,21 maximum conversion of 75% was obtained in 72 h of reaction, using a reactor of 3.2 cm internal diameter and 20 cm height. The reactor was packed with Pseudomonas cepacia lipase immobilized on nanoparticle composites of Fe3O4 at 313 K, a molar ratio of 6 : 3 : 1 : 0.2 (soybean oil : methyl alcohol : water : n-hexane) and a flow rate of 0.25 mL min−1. On the other hand, Hajar et al.,37 achieved maximum conversion of 97% using the same reactor, 10 cm high and 1.5 cm in internal diameter, packed with the commercial immobilized lipase Novozymes 435 at 298 K, a molar ratio of 1 : 3 (rapeseed oil : methyl alcohol) and a flow rate of 6 mL min−1.
However, characterization of the PBR is necessary for any chemical reaction, in order to know the IB influence on the behavior of the substrate inside the reactor.29 In the characterization of the reactor, it is essential to determine the mass transfer coefficient (kc) and dimensionless numbers (Rep, Sc and Sh). In this way, both requirements are indispensable in the construction of a biochemical process which will assist in the construction of an ideal reactor and consequently in obtaining maximum conversion of the desired final product.
Residence time distribution (RTD)
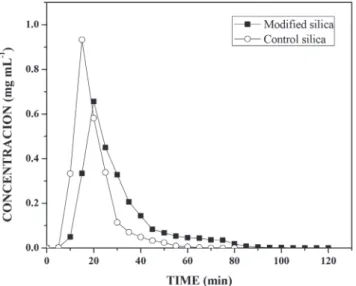
Characterization of the PBR was realized using the transesterification reaction parameters. RTD occurred by the pulse test, in order to investigate the behavior inside the reactor when packed with control silica and silica modified with PIL. A calibration curve was initially constructed to help determine the RTD, which obtained a linear correlation coefficient (R2) of 0.9935 and a line equation of y = 3.6474x − 0.0164 (Figure 1S). From this equation, a graphical profile of concentration versus time for both supports was constructed (Figure 3), which helped in the calculation of average time, variance and skewness of the substrate (Table 2) by means of Equations 2, 4 and 5.
From the curves (Figure 3) it was possible to integrate the area under the graph curve, determining the denominator of Equation 1, for
Table 1. Parameters to determine the mass transfer coefficient
Parameter Data
Transversal area of reactor (m2) 7.85 × 10⁻⁴ Particle diameter (m) 9.29 × 10⁻⁴ Substrate dynamic viscosity (g m−1 s−1) 4.24 × 10⁻³
Temperature (K) 313
Density of substrate (g m−3) 837100
Interstitial velocity (m s−1) BCL on control silica 1.06 × 10⁻⁵ BCL on modified silica 1.99 × 10⁻⁵ Molecular mass of oil (kg kmol−1) 698.21
Oil dynamic viscosity (g m−1 s−1) 2.41 × 10⁻³ Molar volume of ethanol (m3 kmol−1) 0.05837 Porosity BCL on control silica 0.443
BCL on modified silica 0.877 Flow rate (m3 s−1) 2.5 × 10⁻⁹
control silica = 12.46 mg min mL−1 and for silica modified with PIL = 12.84 mg min mL−1. Defining, thus, the mass of the tracer at the end of analysis for control silica (1.87 mg) and silica modified with PIL (1.92 mg). These values were higher than the mass of the injected tracer (1.8 mg), and considering the long tail shaft near zero and the experimental error that can occur, these are acceptable values for this type of test.
The increase in the mean time on silica modified with PIL occurred due to the change in the surface area caused by the PIL, which influences the increase in surface area, pore size and consequently the porosity. In this way, the substrate has a larger contact area to navigate inside the reactor.5,12,39 The experimental value of average time (19.60 min for control silica and 29.73 min for the silica modified with PIL (Table 2)) can be compared with the theoretical mean time from Equation 3. Which was 23.18 min for control silica and 45.90 min for the silica modified with PIL, giving a difference between the average time values of 15.44% and 35.23%, respectively. This difference shows that there can be dead zones or preferential paths of the substrate inside the reactor.
Mean time values higher than those obtained in this study are reported in the literature, but the flow rate and reactor configuration used during tests should be taken into account. Silva et al.,40 obtained a tm of 7 h for a PBR with internal diameter 1.6 cm and 5.5 cm length, with a flow rate of 0.013 mL min−1, while Chattopadhyay and Sen41 found a mean time of 53 min for a PBR with 2 cm internal diameter and 45 cm height using a flow rate of 0.74 mL min−1.
The influence of PIL is also noted in the values of the variance (70.87 to 230.68 min2) and asymmetry (53.56 to 120.90 min2), indicating the dispersion suffered by the substrate inside the reactor. It was noticed that when using the silica modified with PIL, dispersion occurred in a more spread way, in other words, further away from the form that a fluid would travel inside an ideal
reactor. According to Fogler29 the higher the values of variance and skewness, the greater the dispersion occurring in the fluid. Thus, determination of the variance will assist in comparison with the theoretical curves. The reactor dispersion number was determined by Equation 8, in which it is the inverse Peclet (Pe). We obtained a dispersion number for the control silica of 0.098 and for the modified silica of 0.16.
To compare with the literature, the RTD function E(t) is replaced by a normalized function (Equation 7); in other words, it becomes a dimensionless function, in order to obtain a chart listing E(θ) with θ function, for both supports.29,32
According to Fogler,29 analysis of RTD is fundamental in the analysis of reactors, but does not provide a complete description of the flow for a particular reactor or a system of reactors. When analyzed in non-ideal reactors, RTD alone is not sufficient for evaluating the reactor performance; therefore, it is necessary to obtain more information, such as choosing an adequate model in order to adequately characterize the reactor.
In this study, the selected model was dispersion considering closed vessels. According to Levenspiel,32 the non-appearance of double peaks in the graph of the RTD function, the non-appearance of long tails and a dispersion number less than 1 should be taken into consideration before choosing the model. From these considerations and from comparison of the experimental data with the theoretical curve (Figure 4), it was possible to state that the dispersion model could be used without any interference, as the experimental data fitted the selected template and the dispersion number for both conditions was below 1.
Through the dispersion model and the fact that the reactor radius is much smaller than its length, the radial concentration gradient could be safely ignored. The substrate concentration through the reactor is described by Equation 14.
(14)
where U corresponds to the interstitial velocity of the substrate, kc is
the mass transfer coefficient (Equation 13), SB is the surface area of
the control silica and modified silica, CA is the mass concentration
of the substrate, is the concentration of the substrate on the control silica and modified silica, and Z represents the position in the reactor.
Table 2. Three moments of RTD for control silica and silica modified with LIP
Silica Mean time (t m) (min)
Mean time theoretical (τ) (min)
Variance (σ2) (min2)
Skewness (σ3) (min2)
Control 19.60 23.18 70.87 53.56
Modified with PIL 29.73 45.90 230.68 120.79 Figure 3. Determination of tracer concentration versus time for control silica and modified silica
Mass transfer coefficient
The kc of the coconut oil and ethanol using BCL on control silica or modified silica in the transesterification reaction in the PBR was estimated based on the correlation between the Reynolds (Rep), Sherwood (Sh) and Schmidt (Sc) numbers and diffusivity (DAB), described in the supplementary material (Tables 1S to 3S). The kc was evaluated in three different forms, for modifying the properties of the substrate: temperature (303–333 K), molar ratio (1 : 7 to 1 : 12) and flow rate (0.15–1.0 mL min−1).
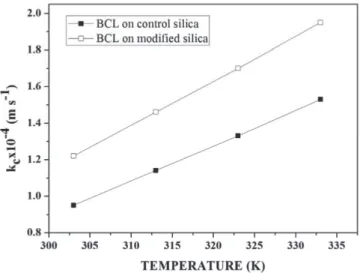
Firstly, the influence of temperature (303–333 K) (Figure 5) on the transesterification reaction was evaluated, keeping the volumetric flow rate (0.15 mL min−1) and molar ratio of the substrate (1 : 7) constant. The variation of kc from 0.95 × 10⁻⁴ to 1.53 × 10⁻⁴ m s−1 (BCL on control silica) and from 1.22 × 10⁻⁴ to 1.96 × 10⁻⁴ m s−1 (BCL on modified silica) is related to Rep. Increasing the temperature from 303 to 333 K increased Rep from 1.44 to 3.43 (BCL on control silica) and from 2.69 to 6.43 (BCL on modified silica).
Elevated temperature lowers the viscosity and density of the substrate, and therefore increases Rep, increasing the diffusion rate of the substrate, which occurs more easily at high temperatures. This stresses that the use of the PIL modified silica in immobilizing BCL by covalent binding decreases the diffusional resistance of the substrate at the active site of the lipase. This behavior is similar to that in the study by Tran et al.,42 which evaluated the kc of sunflower oil in methanol (1 : 4) and 10% water in relation to the mass of oil, varying the temperature (298–333 K), and obtaining an increase in kc from 8.22 × 10⁻¹⁰ to 3.81 × 10⁻⁷ m s−1.
The kc was also evaluated for a change in substrate concentration. The influence of molar ratio on mass transfer variation can be observed in Table 3. It is perceived that the influence on kc is practically non-existent, both for BCL on control silica (1.14 × 10⁻⁴ to 1.10 × 10⁻⁴ m s−1) and for BCL on modified silica (1.46 × 10⁻⁴ to 1.40 × 10⁻⁴ m s−1). In this case the value of D
AB (2.7 × 10⁻⁶ m2 s−1) remained constant as it is a characteristic property of the substrate, only parameters such as viscosity and density varying.
According to the literature, for the production of ethyl esters in batch and continuous reactors, variation of the molar ratio influences the conversion of ethyl esters.18,43 In this work, the molar ratio of substrate in the transesterification of coconut oil and ethanol using BCL immobilized on silica modified with PIL in a PBR was evaluated
too. However, in a PBR the kc was estimated to have a low value of around 1.1 × 10⁻⁴ m s−1 for BCL on control silica and 1.4 × 10⁻⁴ m s−1 for BCL on modified silica. In this study it was noted that an increase in concentration led to an increase in kc for both IB.
According to the literature, for the production of ethyl esters in batch and continuous reactors, variation of the molar ratio influences the conversion of ethyl esters.18,43 In this work, the molar ratio of substrate in the transesterification of coconut oil and ethanol using BCL immobilized on silica modified with PIL in a PBR was evaluated too. However, in a PBR the kc was estimated to have a low value of around 1.1 × 10⁻⁴ m s−1 for BCL on control silica and 1.4 × 10⁻⁴ m s−1 for BCL on modified silica. In this study it was noted that an increase in concentration led to an increase in kc for both IB.
Figure 6 shows that, with increasing Rep, the kc increased for both supports; in this case, the variation is a function of the Reynolds interstitial velocity of the substrate, which is associated with the flow. Increasing the speed enhances the transport of molecules, increasing the mass transfer rate. This behavior is consistent with that described in the literature. Thus, a variation in flow rate increases the transport rate, conducted by molecular diffusion in the substrate, but an increase in the pore the substrate interstitial velocity decreases the residence time within the PBR, causing a decrease in the concentration of ethyl esters.21,42-45
A study by Meunier et al.,46 on the transesterification reaction in a fixed bed reactor showed that an increase of flow rate from 2.3 × 10⁻⁸ to 33.3 × 10⁻⁸ m3 s−1 increased the dimensionless numbers and consequently kc from 0.79 × 10⁻⁴ to 1.67 × 10⁻⁴ m s−1 when used for Lipase PS “Amano” SD immobilized on Celite R632.
Note that the kc was higher when using the IB on modified silica in all cases. The effect of diffusion is limited by the capacity of the substrate to diffuse in the pores used to achieve immobilization of the
Table 3. Variation of mass transfer coefficient with molar ratio of substrate
Molar ratio BCL on control silica BCL on modified silica kc× 10−4 (m s−1) kc× 10−4 (m s−1)
1 : 7 1.14 1.46
1 : 9 1.11 1.42
1 : 10 1.10 1.41
1 : 12 1.10 1.40
Figure 5. Mass transfer coefficient versus reaction temperature, for BCL on control silica or BCL on modified silica, at a flow rate of 0.15 mL min−1 and
molar ratio of 1 : 7 (coconut oil and ethanol)
enzyme on mesoporous supports.47,48 In this study, the pore volume of the control silica was lower than that of the modified silica; the same was not true for BCL on control silica or BCL on modified silica, since the pore volume for BCL on control silica was higher than the PIL modified silica, possibly due to the formation of a lipase multilayer on the surface of the control silica.
Differently from the IB on modified silica, for the lipase bound to the support, both on the surface and in the pores of the silica, the increase in the pore diameter of the support was caused by the presence of PIL (3.02 nm for control silica and 4.17 nm for modified silica). Thus, the lipase accumulated on the silica surface had reduced substrate diffusivity, facilitating increased conversion of ethyl esters in the transesterification reaction from 42% to 52%, because of the presence of a larger amount of lipase on the surface of the pores.
CONCLUSION
The results showed that the presence of PIL influenced the characteristics of the reactor, increasing the average time, and the axial dispersion model can be applied to both, thus the kc was greater for the modified silica, due to increased surface area and porosity; consequently, mass transfer between IB and substrate was increased. The presence of PIL influenced also in the transesterification reaction obtain the maximum conversion was achieved for BCL on silica modified with PIL, obtaining 47% conversion of ethyl esters at 72 h, while for BCL on control silica, the maximum conversion was 39% at 96 h;
The results showed that the PIL influence on the realized study was caused by modification of the morphological structure of the biocatalyst, increasing the surface area from 349.4 (IB on control silica) to 371.9 m2 g−1 (IB on modified silica), and increasing the pore volume from 0.35 (IB on control silica) to 0.67 cm3 g−1 (IB on modified silica).
SUPPLEMENTARY MATERIAL
Supplementary information, including the concentration versus absorbance of the tracer spectra (Figure 1S) and the dimensionless numbers in function the temperature the reaction (Table 1S), flow rate the reaction (Table 2S) and molar ratio the reaction (Table 3S) are available free of charge at http://quimicanova.sbq.org.br in pdf format.
ACKNOWLEDGEMENTS
CNPq, CAPES and FAPITEC/SE provided financial support.
REFERENCES
1. Lotti, M.; Pleiss, J.; Valero, F.; Ferrer, P.; Biotechnol. J. 2015, 10, 22. 2. Da Rós, P. C. M.; Castro, H. F.; Carvalho, A. K. F.; Soares, C. M. F.;
Moraes, F. F.; Zanin, G. M.; J. Ind. Microbiol. Biotechnol. 2012, 39, 529.
3. Santos, J. C. S.; Barbosa, O.; Ortiz. C.; Berenguer-Murcia, A.; Rodrigues, R. C.; Fernandez-Lafuente, R.; ChemCatChem2015, 7, 2413.
4. Dalla-Vecchia, R.; Nascimento, M. G.; Soldi, V.; Quim. Nova2004, 27, 623.
5. Bon, E. P. S.; Ferreira, M. A.; Corvo, M. L.; Enzimas em biotecnologia: produção, aplicações e mercado, Interciência: Rio de Janeiro, 2008. 6. Sheldon, R. A.; Pelt, S. V.; Chem. Soc. Rev.2013, 42, 6223.
7. Santos, J. C.; Paula, A. V.; Rocha, C. G. F.; Nunes, G. F. M.; Castro, H. F.; Non-Cryst. Solids2008, 354, 4823.
8. Barbosa, O.; Torres, R.; Ortiz, C.; Berenguer-Murcia, A.; Rodrigues, R. C.; Fernandez-Lafuente, R.; Biomacromol. 2013, 14, 2433.
9. Hartmann, M.; Kostrov, X.; Chem. Soc. Rev. 2013, 42, 6277. 10. Cardoso, C. L.; Moraes, M. C.; Cass, Q. B.; Quim. Nova2009, 32, 175. 11. Guisan, J. M.; Immobilization of enzyme and cell, 2a ed., Humana Press:
New Jersey, 2006.
12. Carvalho, N. B.; Lima, A. S.; Soares, C. M. F.; Quim. Nova2015, 38, 399.
13. Gérardin, C.; Reboul, J.; Bonne, M.; Lebeau, B.; Chem. Soc. Rev.2013, 42, 4217.
14. Sheldon, R. A.; Adv. Synth. Catal. 2007, 349, 1289.
15. Zou, B.; Song, C.; Xu, X.; Xia, J.; Huo, S.; Cui, F.; Appl. Surf. Sci.2014, 311, 62.
16. Álvarez, V. H.; Mattedi, S.; Martin-Pastor, M.; Aznar, M.; Iglesias, M.; Fluid Phase Equilib. 2010, 299, 42.
17. Stepankova, V.; Bidmanova, S.; Koudelakova, T.; Prokop, Z.; Chaloupkova, R.; Damborsky. J.; ACS Catal. 2013, 2823.
18. Oliveira, M. V. S.; Rós, P. C. M.; Mattedi, S.; Castro, H. F.; Soares, C. M. F.; Lima, A. L.; Acta Sci. Technol. 2014, 36, 445.
19. Souza, R. L.; Faria, E. L. P.; Figueiredo, R. T.; Freitas, L. S.; Iglesias, M.; Mattedi, S.; Zanin, G. M.; Santos, O. A. A.; Coutinho, J. A. P.; Lima, A. S.; Soares, C. M. F.; Enzyme Microb. Technol. 2013, 52, 141. 20. Balcão, V. M.; Paiva, A. L.; Malcata, F. X.; Enzyme Microb. Technol.
1996, 18, 392.
21. Wang, X.; Liu, X.; Zhao, C.; Ding, Y.; Xu, P.; Bioresour. Technol.2011, 102, 6352.
22. Poppe, J. K.; Fernandez-Lafuente, R.; Rodrigues, R. C.; Ayub, M. A. Z.; Biotechnol. Adv.2015, 33, 511.
23. Itabaiana Jr, I.; Miranda, L. S. M.; Souza, R. O. M. A.; J. Mol. Catal. B: Enzym.2013, 85, 1.
24. Feng, X.; Patterson, D. A.; Balaban, M.; Emanuelsson, E. A. C.; Chem. Eng. J.2014, 235, 356.
25. Xi, T.; Chen, Q.; You, C.; Powder Technol.2015, 269, 577.
26. Chen, Y.; Xiao, B.; Chang, J.; Fu, Y.; Lv, P.; Wang, X.; Energy Convers. Manage. 2009, 50, 668.
27. Halim, S. F. A.; Kamaruddin, A. H.; Fernando, W. J. N.; Bioresour. Technol. 2009, 100, 710.
28. Paula, A. V.; Urioste, D.; Santos, J. C.; Castro, H. F.; J. Appl. Chem. Biotechnol.2007, 82, 281.
29. Fogler, H. S., Elements of chemical reaction engineering, 3rd ed., PHPTR: New Jersey, 2002.
30. Soboll1, S.; Bittorf, L.; Kockmann, N.; Chem. Eng. Technol.2018, 41, 134.
31. Jafarikojour, M.; Sohrabi, M.; Royaee, S. J.; Rezaei, M. A.; Chem. Eng. Res. Des. 2016, 109, 86.
32. Levenspiel, O.; Chemical reaction engineering: An Introduction To The Design Of Chemical Reactors. John Wiley & Sons: New York, 2000. 33. Seguin, D.; Montillet, A.; Brunjail, D.; Comiti, J.; Chem. Eng. J.1996,
63, 1.
34. Treybal, R. E.; Molecular Diffusion in fluids. Massa-Transfer Operations. McGraw-Hill: New York, 1980, p. 21.
35. Dai, S.; Ju, Y. H.; Gao, H. J.; Lin, J. S.; Pennycook, S. J.; Barnes, C. E.; Chem. Commun.2000, 243.
36. Michelin, S.; Penha, F. M.; Sychoski, M. M.; Scherer, R. P.; Treichel, H.; Valerio, A.; Di Luccio, M.; Oliveira, D.; Oliveira, J. V.; Renewable Energy2015, 388.
37. Stevenson, D. E.; Stanly, R. A.; Furneaux, R. H.; Enzyme Microb. Technol.1994, 478.
38. Adlercreutz, P.; Chem. Soc. Rev.2013, 42, 6406.
39. Hajar, M.; Shokrollahzadeh, S.; Vahabzadeh, F.; Monazzami, A.; Enzyme Microb. Technol.2009, 45, 188.
41. Chattopadhyay, S.; Sen, R.; Bioresour. Technol.2013, 147, 395. 42. Tran, D. T.; Lin, Y. J.; Chen, C. L.; Chang, J. S.; Appl. Energy2014, 126,
151.
43. Ribeiro, L. M. O.; Santos, B. C. S.; Almeida, R. M. R. G.; Biomass Bioenergy2012, 47, 498.
44. Chang, C.; Chen, J. H.; Chang, C. J.; Wu, T. T.; Shieh, C. J.; New Biotechnol.2009, 26, 187.
45. Halim, S. F. A.; Kamaruddin, A. H.; Fernando, W. J. N.; Bioresour. Technol.2009, 100, 710.
46. Meunier, S. M.; Rajabzadeh, A. R.; Williams, T. G.; Legge, R. L.; Energy Fuels2015, 29, 3168.
47. Jaladi, H.; Katiyar, A.; Thiel, S. W.; Guliants, V. V.; Pinto, N. G.; Chem. Eng. Sci.2009, 64, 1474.
48. Ramos, L.; Martin, L. S.; Santos, J. C.; Castro, H. F.; Ind. Eng. Chem. Res.2017, 56, 1.