doi:10.5194/acp-11-12945-2011
© Author(s) 2011. CC Attribution 3.0 License.
Chemistry
and Physics
Ice nucleation properties of fine ash particles from the
Eyjafjallaj¨okull eruption in April 2010
I. Steinke1, O. M¨ohler1, A. Kiselev1, M. Niemand1, H. Saathoff1, M. Schnaiter1, J. Skrotzki1, C. Hoose1, and T. Leisner1,2
1Institute for Meteorology and Climate Research – Atmospheric Aerosol Research, Karlsruhe Institute of Technology, Karlsruhe, Germany
2Institute for Environmental Physics, Ruprecht-Karls-University Heidelberg, Heidelberg, Germany Received: 9 May 2011 – Published in Atmos. Chem. Phys. Discuss.: 22 June 2011
Revised: 25 October 2011 – Accepted: 7 December 2011 – Published: 20 December 2011
Abstract. During the eruption of the Eyjafjallaj¨okull vol-cano in the south of Iceland in April/May 2010, about 40 Tg of ash mass were emitted into the atmosphere. It was unclear whether volcanic ash particles withd <10 µm facilitate the glaciation of clouds. Thus, ice nucleation properties of vol-canic ash particles were investigated in AIDA (Aerosol In-teraction and Dynamics in the Atmosphere) cloud chamber experiments simulating atmospherically relevant conditions. The ash sample that was used for our experiments had been collected at a distance of 58 km from the Eyjafjallaj¨okull during the eruption period in April 2010. The temperature range covered by our ice nucleation experiments extended from 219 to 264 K, and both ice nucleation via immersion freezing and deposition nucleation could be observed. Im-mersion freezing was first observed at 252 K, whereas the deposition nucleation onset lay at 242 K and RHice=126 %.
About 0.1 % of the volcanic ash particles were active as im-mersion freezing nuclei at a temperature of 249 K. For de-position nucleation, an ice fraction of 0.1 % was observed at around 233 K and RHice=116 %. Taking ice-active surface
site densities as a measure for the ice nucleation efficiency, volcanic ash particles are similarly efficient ice nuclei in im-mersion freezing mode (ns,imm∼109m−2 at 247 K) com-pared to certain mineral dusts. For deposition nucleation, the observed ice-active surface site densitiesns,dep were found to be 1011m−2at 224 K and RHice=116 %. Thus, volcanic ash particles initiate deposition nucleation more efficiently than Asian and Saharan dust but appear to be poorer ice nu-clei than ATD particles. Based on the experimental data, we have derived ice-active surface site densities as a function of temperature for immersion freezing and of relative humidity over ice and temperature for deposition nucleation.
Correspondence to:I. Steinke ([email protected])
1 Introduction
Eruptions of volcanoes like El Chichon (1980) or Mt. Pinatubo (1991) had significant impacts on global at-mospheric temperatures (Soden et al., 2002) because of the emission of large amounts of sulphur species into the strato-sphere. Such major eruptions (with magnitudes larger than 4.5) occur at intervalls ranging from four years to about 1000 yr depending on the eruption strength. Non-explosive volcanic activities involving slow degassing are associated with at least regional impacts on climate (Durant et al., 2010). For several years, attention to the impact of volcanic emissions on climate has been mainly focused on the contri-bution of volcanic sulphur species to the stratospheric aerosol layer and the subsequent impact on the global radiation bud-get (Mather et al., 2003) or, alternatively, the possible in-teraction between anthropogenic particles and sulphuric acid droplets of volcanic origin (Raga et al., 1999).
Because of their higher settling velocities, the largest par-ticles within the volcanic plume are rapidly lost due to sed-imentation during atmospheric transport, whereas ash par-ticles smaller than∼10 µm may stay elevated at higher
al-titudes for a longer period of time. These small ash par-ticles are predicted to have atmospheric residence times of several days (Rose and Durant, 2009). This prediction is supported by atmospheric measurements within the volcanic plume where it was found that within two to three days the number concentration of particles larger than∼2 µm is
fur-ther decreased due to sedimentation (Schumann et al., 2011). These small ash particles remaining in the troposphere may alter cloud properties by acting as ice nuclei in mixed-phase and cirrus clouds. Since heterogeneous ice nucleation has been identified as a very important process with regard to impact on precipitation and the atmospheric radiation bud-get, the need to better characterise ice nucleation proper-ties of atmospheric particles has arisen. Heterogeneous ice nucleation is initiated by the presence of typically insolu-ble particles leading to a reduction of the Gibbs free en-ergy for the formation of a critical ice germ – these parti-cles are called ice nuclei (IN) (Pruppacher and Klett, 1997; Cantrell and Heymsfield, 2005). Ice nucleation can occur as immersion/condensation freezing, deposition nucleation or contact freezing (Vali, 1985). Immersion freezing re-quires the presence of an undissolved aerosol particle within the supercooled liquid droplet for freezing to be initiated. In the case of condensation freezing, condensation of water onto the aerosol particle precedes the freezing of the liquid droplet. Deposition nucleation, in contrast, refers to the di-rect transformation of water vapour into ice at the particle surface. Freezing via contact nucleation is caused by the col-lision between an aerosol particle and a supercooled liquid droplet (Cooper, 1974; Shaw et al., 2005).
In laboratory experiments (Durant et al., 2008; Fornea et al., 2009 and references therein) and atmospheric measure-ments (Bingemer et al., 2011; Seifert et al., 2011) the role of volcanic ash particles as potential ice nuclei has been inves-tigated.
Volcanic ash particles (250 < d < 300 µm) from Mt. St. Helens were observed to nucleate ice via im-mersion freezing at temperatures of about 255 K (Fornea et al., 2009). For several Japanese volcanoes such as Mt. Asama, a significant correlation between volcanic activity and the increase of atmospheric ice nuclei con-centrations in Tokyo was observed for meteorological conditions which allowed the transport of volcanic ash over several kilometres. The increase in IN concentrations was especially pronounced for temperatures below 258 K (Isono et al., 1959a). A similar observation was made for Hawaiian volcanoes, where eruptions of the Kilauea were followed by IN concentrations (measured at 252 K) rising to more than one order of magnitude above background concentrations (Hobbs et al., 1971).
Even though it was demonstrated that volcanic ash parti-cles can be efficient ice nuclei, it remained unclear whether volcanic ash particles are relevant for atmospheric ice nu-cleation processes, since the ash particles’ properties as ice-forming nuclei had neither been investigated for particles smaller than∼100 µm nor for temperatures below∼250 K.
Also, some measurements suggest that not all eruptions contribute to atmospheric IN concentrations, as the ice-nucleation properties of volcanic ash particles depend on their volcanic source and the resulting chemical composition (Isono et al., 1959a) – e.g. volcanic ash particles might be-come deactivated in volcanic plumes which are rich in sul-phuric gases (Schnell and Delany, 1976). A comparison of ash samples from ten different Japanese volcanoes indeed has shown that freezing thresholds vary not only amongst volcanoes, but also for different types of eruptions. In gen-eral, however, freezing onset temperatures varied between 250 and 265 K (Isono et al., 1959b). This range of freezing onset temperatures agrees with studies that have investigated the ice nucleation properties of volcanic ash from Mt. Etna (Italy), Crater Lake (USA) and Pericuten (Mexico). For all these samples ice nucleation was initiated at temperatures be-tween 257 K and 265 K (Mason and Maybank, 1958; Schae-fer, 1949). Single-particle measurements with two different types of volcanic ash (trachandesitic and balsaltic reticulite) found that freezing was initiated at temperatures between 250 and 255 K for both types of ash (Durant et al., 2008).
This paper presents laboratory results from cloud chamber experiments with volcanic ash from the Eyjafjallaj¨okull erup-tion in April 2010. Since our experiments were conducted over a temperature range between 219 and 264 K, our re-sults are relevant for ice nucleation processes in mixed-phase and cirrus clouds. In this work a detailed characterisation of the ice nucleation properties of volcanic ash particles is pre-sented together with aspects related to particle morphology and composition. For the evaluation of the ice nucleation efficiency of the volcanic ash particles, the concept of the so-called ice-active surface site density was employed (DeMott, 1995; Connolly et al., 2009; Niedermeier et al., 2010; Nie-mand et al., 2011). It relies on the assumption that ice-active sites at the surface of the aerosol particles initiate ice nucle-ation at a certain temperature and relative humidity over ice (Fletcher, 1969; Vali, 1971).
2 Experimental methods
TDL water vapour spectrometer
SIMONE Chilled-mirror
hygrometer
WELAS/WELAS2 CPC 3010
SMPS2/APS2
AIDA cloud simulation chamber
Rotating brush generator
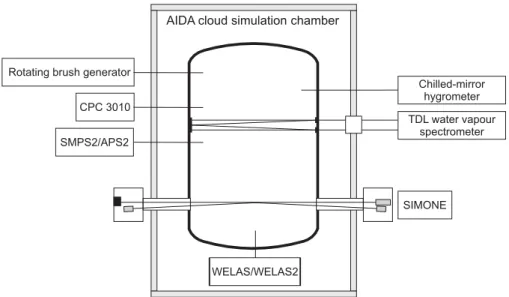
Fig. 1.Schematic drawing of the AIDA cloud chamber: aerosol instrumentation (rotating brush generator, APS, SMPS, CPC3010) and in-struments used for characterisation of the droplet/ice crystal population (WELAS/WELAS2, SIMONE) and relative humidity measurements (TDL, chilled-mirror hygrometer).
down to pressures below 0.1 hPa and flushing with synthetic air) results in very low background concentrations of aerosol particles (typically below 0.1 cm−3). Additionally, most ex-pansion experiments were preceded by a reference activation during which the background aerosol is activated to droplets or ice crystals, depending on the temperature and humid-ity conditions within the chamber. With this procedure an almost complete removal of background particles from the cloud chamber system is achieved.
Figure 1 shows a schematic drawing of the AIDA cham-ber: the vessel, where the experiments take place, is sit-uated within a large temperature-controlled housing. For the expansion experiments, the gas pressure inside the ves-sel is lowered at controllable rates with a strong vacuum pump. The experiments presented in this paper were con-ducted within a temperature range between 219 and 264 K. With several optical instruments, aerosol particles, droplets and ice crystals can be measured and distinguished from each other. In the following, the characteristics of these instru-ments (Wagner et al., 2009) will be summarised briefly:
– Sizing and counting of the droplet and ice crystal pop-ulation is done by the two optical particle counters WE-LASandWELAS2(Palas GmbH) which detect scatter-ing signals from sscatter-ingle particles crossscatter-ing a beam of white light within the respective instrument. The inten-sity of the scattering pulses is then taken as a measure of the corresponding particle size. The detection ranges (for liquid droplets) are 0.7–40 µm and 2.3–104 µm, re-spectively. The differentiation between ice crystals and water droplets is made according to the fact that typ-ically ice crystal sizes exceed those of water droplets. Therefore, a size threshold can be set which allows to
calculate the number concentration of ice crystals and later on the fraction of ice crystals with respect to the total aerosol number concentrations as measured by a condensation particle counter (CPC3010, TSI).
– SIMONE (Scattering Intensity Measurements for the Optical Detection of Ice) detects scattering signals from particles crossing the pathway of a laser beam (λ=
488 nm) which horizontally traverses the cloud cham-ber. Scattering signals are measured in forward (at 2◦) and near-backward (at 178◦) direction. Additionally, for the near-backward scattering signal, the depolarisation, which can be taken as an indicator of the dominating presence of either water droplets or ice crystals, is mea-sured using a Glan laser prism to separate the parallel and the perpendicular polarized components of the near-backward scattered light.
– The humidity conditions in the cloud chamber are de-rived fromTDL(tunable diode laser) absorption spec-troscopy measurements. From scanning over a selected water-vapour absorption line at 1.37 µm, the absolute concentration of water vapour within the cloud cham-ber can be inferred with an accuracy of±5 %. The
con-centration measurements can then be converted into rel-ative humidity using the AIDA mean gas temperature
Tgand the saturation vapour pressure of water (Murphy and Koop, 2005). Additionally, the total water concen-tration can be determined from chilled mirror hygrom-eter measurements and used to calculate the condensed water content.
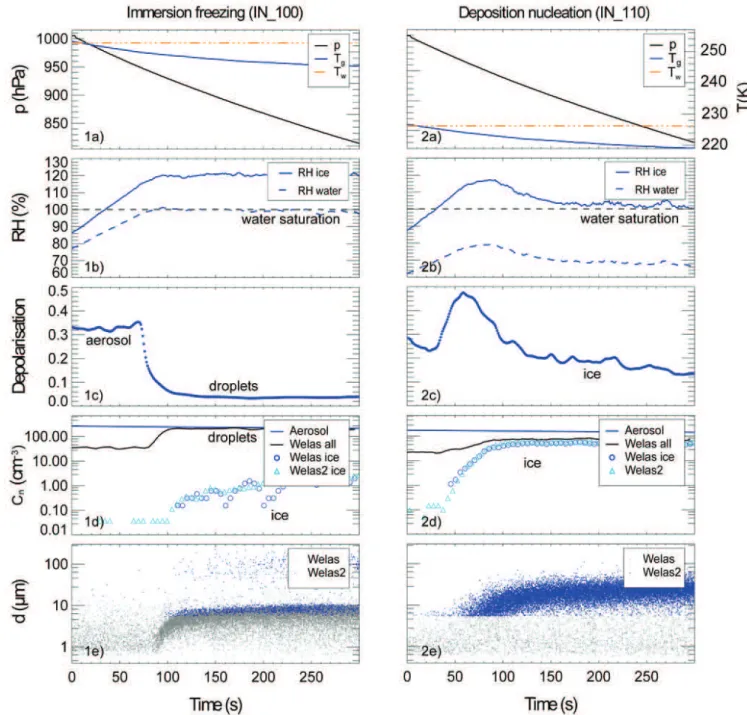
nucleation. In Fig. 2 data for two experiments is shown – the experiment on the left (1a to 1e) is an example for immersion freezing of volcanic ash (EY01), whereas the experiment on the right side (2a to 2e) is characterised by pure deposition nucleation.
As the structure of the data sets is conceptually the same for both experiments, a general overview will be given, to-gether with the main conclusions that can be drawn from the measurements:
– The first panels (a) show the progression of an expan-sion experiment: the cloud chamber is pumped down from atmospheric pressure to a pressurepof∼800 hPa.
At the same time, the gas temperatureTg, which is the average temperature in the volume of the cloud cham-ber, drops. The temperatureTw, which is the average of several sensors on the walls of the aerosol vessel, re-mains almost constant during the expansion.
– Panels (b) show the evolution of the relative humidities over water (RHwat) and over ice (RHice) as derived from the TDL water vapour measurements.
– The SIMONE depolarisation signal is shown in pan-els (c): in our experiments, a depolarisation value of
∼0.3 was observed for the volcanic ash particles. The growth of droplets and ice crystals can be clearly dif-ferentiated: formation of (spherical) droplets is accom-panied by a decrease in depolarisation. Low number concentrations of nonspherical ice crystals, in contrast, do not lead to an overall change in depolarisation.
– The particle concentrations and size distributions that are shown in the panels (d) and (e) are compilations of data from WELAS, WELAS2 and CPC3010. The WELAS and WELAS2 instruments give information re-garding the number concentrations (panels d) and opti-cal sizes (panels e) of droplets and ice crystals. The particles measured by WELAS/WELAS2 before the ex-pansion experiment starts are aerosol particles that are large enough to be detected by these instruments. In panel d), the number concentration as measured by the two optical particle counters is shown without differen-tiating between aerosol particles, droplets and ice crys-tals (Welas all). Additionally, the ice crystal concentra-tion can be derived by applying a size threshold to the data presented in panels (e) according to the fact that ice crystals are much larger than aerosol particles and droplets. For the immersion freezing experiment, the separation between droplet population and ice crystals is clearly visible (1e). Thus, the threshold is set at a particle size ofd=20 µm. For deposition nucleation,
this ice crystal threshold is more difficult to find and set to a slightly smaller value ofd=15 µm in order not to
underestimate the number density of small ice crystals. Complementing the data on droplets and ice crystals, the aerosol particle concentration is shown in panels (d).
Putting together the information from all the instruments, it is possible to distinguish between immersion freezing (1a to 1e) and deposition nucleation (2a to 2e): First, from looking at the humidity data (1b and 2b) it can be seen that water saturation is only reached during the first experiment. The emergence of droplets is confirmed by the decrease of the depolarisation signal (1c) from∼0.3 to values below 0.05
– this can be reasoned by the fact that aerosols which have been activated to droplets, in contrast to dry aerosol particles, are spherical objects which do not cause significant depolar-isation. For deposition nucleation, the depolarisation signal (2c) is more difficult to interpret because it also depends on ice crystal sizes and habits: during our experiments, over-all, a slight decrease in depolarisation was observed during deposition nucleation. Sometimes, however, the initiation of deposition nucleation can be accompanied by an increase in depolarisation (2e) which can be explained by the presence of small micrometer-sized ice particles during the initial nu-cleation and growth stage as such small particles have a max-imum in depolarisation (Wagner et al., 2009).
Another feature which differs between immersion freezing and deposition nucleation is the temporal development of the ice crystal population. For immersion freezing, droplet con-centrations converge towards the aerosol number concentra-tion (1d) upon reaching water saturaconcentra-tion: this results from of the activation of aerosol particles to droplets which allows small aerosol particles to grow into the detection range of the WELAS instrument. In the range between 1 and 10 µm, a dense droplet cloud is detected by the WELAS instrument before ice nucleation is initiated. The WELAS2 instrument (blue dots) only detects the largest droplets (1e). Since within our measurement uncertainty all volcanic ash particles are activated to droplets (leaving no dry aerosol particles avail-able), it is unlikely for contact nucleation to occur during the AIDA experiments presented in this study. For deposition nucleation, the number of particles as detected by WELAS is lower than the aerosol concentration throughout the exper-iment (2d). Also, there is no droplet formation prior to ice nucleation (2e), but reaching a certain supersaturation over ice is followed by rapid growth of ice crystals into the WE-LAS/WELAS2 detection ranges (2e). Immersion freezing is accompanied by the emergence of droplets when reaching saturation over water, which can be recognised from the large decrease in depolarisation (1c). Ice nucleation sets in only after droplet formation has started (1d, 1e). In contrast, de-position nucleation is associated with an immediate growth of ice crystals at a certain supersaturation over ice (2d, 2e), which then leads to a significant temporary increase in depo-larization while for immersion freezing and low ice crystal concentrations the depolarization is not influenced much by ice nucleation and ice crystal growth over the course of the experiment.
af-Fig. 2. Time series of two experiments showing immersion freezing (1a–1e) and deposition nucleation (2a–2e). (a)Variation of the ther-modynamical variables during expansion: decrease in gas temperatureTgand pressurep; temperature at the walls of the vesselTwstays
approximately constant,(b)Development of relative humidity over water and over ice as derived from TDL data,(c)Depolarisation of the backwardly scattered light (SIMONE) as an indication for the dominance of either droplets or ice crystals,(d)Aerosol number con-centrations (CPC3010) compared to particle concon-centrations (WELAS/WELAS2); ice crystal number concon-centrations are calculated from WELAS/WELAS2 data,(e)Temporal evolution of particle sizes as measured by WELAS/WELAS2
ter a major eruption phase had started on 13 April 2010 (Gudmundsson et al., 2010). According to a study by Gislason et al. (2011), the ash from Eyjafjallaj¨okull is dom-inated by andesitic glass. However, they also found crystals of plagioclase, pyroxene and olivine. Further details with re-gard to the circumstances of this volcanic eruption and their
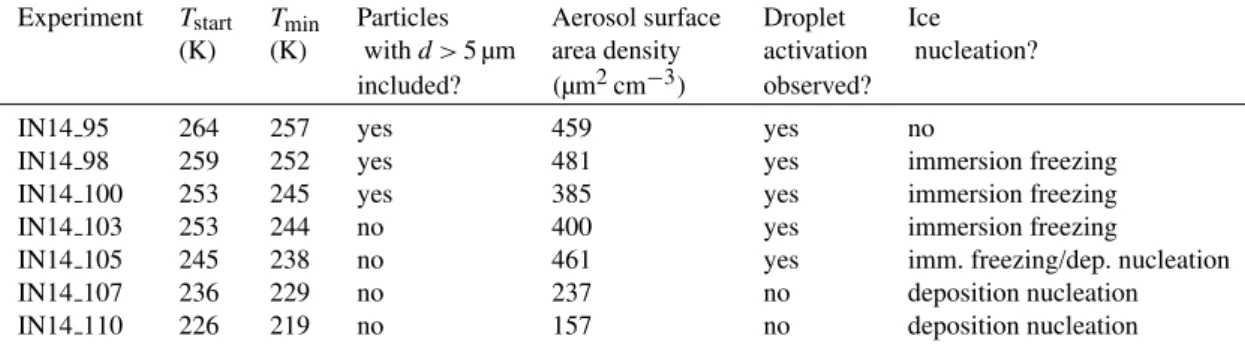
Table 1.Overview of ice nucleation experiments with EY01 as carried out at the AIDA cloud chamber; reference experiments being omitted
Experiment Tstart Tmin Particles Aerosol surface Droplet Ice
(K) (K) withd >5 µm area density activation nucleation?
included? (µm2cm−3) observed?
IN14 95 264 257 yes 459 yes no
IN14 98 259 252 yes 481 yes immersion freezing
IN14 100 253 245 yes 385 yes immersion freezing
IN14 103 253 244 no 400 yes immersion freezing
IN14 105 245 238 no 461 yes imm. freezing/dep. nucleation
IN14 107 236 229 no 237 no deposition nucleation
IN14 110 226 219 no 157 no deposition nucleation
aerosol is drily dispersed as in our experiments, which sets free the smaller, atmospherically relevant particles.
The sample was introduced into the AIDA chamber with a rotating brush generator (RBG 1000, Palas) and later on characterised with SMPS (Scanning Mobility Particle Sizer – TSI) and APS (Aerodynamical Particle Sizer – TSI) mea-surements delivering a size distribution of the aerosol parti-cles. From the aerosol number size distribution that is ob-tained by combining the APS and SMPS data (M¨ohler et al., 2008), the aerosol surface distribution can be estimated – as-suming that the aerosol particles are spherical – and sub-jected to a lognormal fitting routine. Filter samples were taken from the aerosol in the cloud chamber and analysed with an environmental scanning electron microscope (ESEM – FEI Quanta 650 FEG) combined with an energy disper-sive X-ray analysis module (EDX – QUANTAX, Bruker). This method gives access to the surface morphology and the chemical composition of individual particles. Additionally, the amount of soluble sulphates on the surfaces of the ash particles was analysed with an ion chromatograph (DX500, Dionex): for this analysis 53 mg of volcanic ash were sus-pended in 20 ml of high-purity water (Nanopure, Barnstead) and only the solution was analysed for major anions and cations including sulphate.
An overview of all relevant experiments with the EY01 sample is given in Table 1 as a reference for experiments mentioned in the following section in which the results are presented. Note that reference experiments, in which the background aerosol in the cloud chamber was activated, are not listed. Tstart denotes the temperature at the beginning of the respective expansion experiment, whereasTminis the lowest temperature reached during the experiment.
3 Results
In the following sections we will first present our results on the ash particle surface distributions, morphology, and chemical composition. The second section will deal with the threshold conditions for different ice-active particle frac-tions. The third part is dedicated to the relation between
ice-active surface site densities and temperature for immer-sion freezing and, accordingly, the relation between ice-active surface site densities and the two variables temperature and supersaturation over ice for deposition ice nucleation.
3.1 Characteristics of volcanic ash particles: aerosol surface distribution and morphology
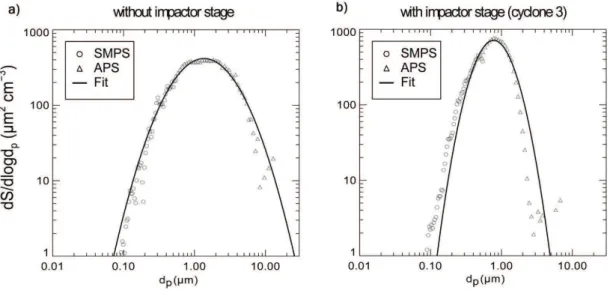
From the combination of APS and SMPS measurements, the surface distribution of the volcanic ash particles in the AIDA chamber can be derived: one of these surface distributions is shown in Fig. 3a. The aerosol surface distributions are cal-culated from the APS and SMPS number size distributions as described by M¨ohler et al. (2008). For calculating the aerosol surface distribution of the ice-inducing volcanic ash particles, a unimodal lognormal size distribution was fitted to the measured data. For this fit, the density was estimated to be 2.6 g cm−3, assuming that volcanic ash has a similar density compared to mineral dusts also consisting mainly of silicates. Volcanic ash particles smaller than 0.1 µm do not significantly contribute to the aerosol surface distribution. The fitted aerosol surface mode includes particles with di-ameters between 0.1 and 15 µm for exp. IN 100 (resp. 5 µm for exp. IN 103), with a median diameter of∼0.4 µm and a
standard deviation ofσ=1.8 (number size distributions not shown). For investigating the relative contribution of larger particles (d >5 µm) to the ice nucleation efficiency of the total volcanic ash particle population, two ice nucleation ex-periments (IN 100 and IN 103) were conducted at the same temperature, but with different aerosol size cutoffs. As can be seen from Fig. 3, this cutoff lies at ∼15 µm for
experi-ment IN 100, and at∼5 µm for experiment IN 103. In the
first case, particles larger than∼15 µm are eliminated since
the dispersion of the aerosol is accompanied by losses within the tubes that lead from the rotating brush generator to the cloud chamber aerosol inlet.
For experiment IN 103, an impactor stage (cyclone 3) was used with the rotating brush generator which led to a dis-crimination of particles larger than∼5 µm. This
Fig. 3. Aerosol surface distributions of volcanic ash particles: comparison between distributions as obtained without(a)and with (b) using an impactor (cyclone 3) – aerosol surface distributions are calculated from number size distributions as measured by APS and SMPS (a)dmed,surf=1.36 µm;σsurf=2.33 (exp. IN14 100)(b)dmed,surf=0.77 µm;σsurf=1.66 (exp. IN14 103)
distribution is shifted fromdmed,surf=1.36 µm to a smaller valuedmed,surf=0.77 µm when using a cyclone. The use of an impactor stage also influences the width of the aerosol sur-face distributions as indicated by the standard deviation de-creasing fromσsurf=2.33 toσsurf=1.66. From the aerosol surface distributions it can be seen that the volcanic ash particles used in our experiments fall mostly within the at-mospherically relevant size range of particles smaller than
∼10 µm which can stay elevated for several days (Rose and Durant, 2009).
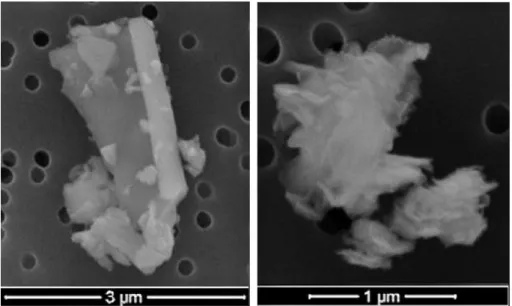
In Fig. 4 two ESEM images of volcanic ash particles are shown. The particle on the left side of Fig. 4 has relatively sharp edges with smaller particles being attached to the ticle’s surface. The picture on the right side shows a par-ticle that consists of several small parpar-ticles (with sizes of
∼0.2 µm). For an ensemble of 7 particles, a more detailed
analysis was conducted: the surface characteristics of these volcanic ash particles are similar to those that have been observed in atmospheric measurements (Schumann et al., 2011). However, we did not observe particles consisting solely of sulphates. The most abundant components found in our EDX analysis are silicates alongside with aluminium ox-ide, which is in agreement with atmospheric measurements finding that particles larger than 0.5 µm consisted mainly of silicates (Schumann et al., 2011). The high silicate content suggests that volcanic ash particles are on average chemi-cally akin to particles belonging to the coarse fraction of cer-tain mineral dusts (e.g. Saharan dust) (Formenti et al., 2003; Linke et al., 2006; Krueger et al., 2004). Compared to min-eral dusts, volcanic ash particles may have been exposed to additional chemical processing because of the presence of sulphuric acid during particle production (Mather et al.,
2003). Therefore we have also measured the sulphate con-tent in our volcanic ash samples by ion chromatography. The sulphate content as derived from our leaching experiments was approximately 0.1 g per kg of ash mass, which is slightly lower than for similar samples that have been investigated (Eir´ıksdottir and Alfredsson, 2010). However, direct atmo-spheric measurements of volcanic ash particles being coated by sulphuric acid are still missing (Flentje et al., 2010).
3.2 Ice nucleation threshold conditions in immersion freezing and deposition nucleation mode
Figure 5 shows the ice nucleation threshold conditions for certain ice fractionsf. Ice fractionsf refer to the ratio be-tween number densities of ice crystals and the total aerosol number concentration. For comparison, freezing threshold measurements for Asian and Saharan dust (Field et al., 2006) are included in Fig. 5.
Fig. 4.ESEM images of two ash particles from the Eyjafjallaj¨okull (sample name: EY01): examples for different particle surface structures.
220 225 230 235 240 245 250 255
100 110 120 130 140 150 160 170
T [K]
RH
ic
e
[%
]
f = 0.1% f = 0.5% f = 1.0%
thresholds for Asian Dust and Saharan Dust f = 0.5% (Field et al.,2006)
water saturation line
Deposiion nucleaion
Immersion freezing
Freezing onset of volcanic ash
Fig. 5. Immersion freezing at water saturation and deposition nucleation: ice nucleation threshold conditions for different ice fractionsf (
Deposiion nucleaion
Immersion freezing
Freezing onset of volcanic ash
(
◆
,
,Deposiion nucleaion
Immersion freezing
Freezing onset of volcanic ash
◆
,
●
,,
Deposiion nucleaion
Immersion freezing
Freezing onset of volcanic ash
◆
●
,
⋆
) produced by volcanic ash (EY01) compared to cloud chamber experiments (Field et al., 2006) with Saharan and Asian Dust () –)
the shaded area illustrates the measurement uncertainty of RHiceat water saturation.regions of droplet activation. The relative humidity over ice (RHice) is measured with an uncertainty of±3–5 % (Fahey
et al., 2009).
There are two distinct groups of ice nucleation thresholds (Fig. 5): immersion freezing after droplet activation occurs at water saturation for temperatures above 240 K. At lower temperatures, only deposition nucleation is observed in our experiments. Immersion freezing was first observed at a temperature of 252 K. However, at this temperature the ice fractions did not exceed 0.1 %. For immersion freezing the highest observed ice fraction amounts tof =2 % at 245 K,
whereas for deposition nucleation the maximum ice frac-tion observed isf =40 % at RHice=117 % and a
temper-ature of 223 K. Our measurements compare very well with ice nucleation thresholds observed during ice nucleation ex-periments with Asian and Saharan dust as similar maximum ice fractions of∼45 % were observed for both mineral dusts at temperatures below 233 K (Field et al., 2006). However, for Saharan dust (Field et al., 2006), freezing was observed close to water saturation at comparatively low temperatures (∼235 K) where deposition nucleation was dominant for the
244 245 246 247 248 249 250
107
108
109
1010
1011
T [K]
Ice
act
iv
e
su
rfa
ce
si
te
d
en
si
tie
s
[m
-2]
exp. 100 exp. 103
fit: ns,imm= exp(-0.74*T+203.77)
Fig. 6. Ice-active surface site densities for immersion freezing of volcanic ash particles (EY01) with fit (—) and measurement uncer-tainties (- -).
volcanic ash particles, the onset of freezing was observed at temperatures between 250 and 260 K (Durant et al., 2008; Fornea et al., 2009) where ice fractions where below 0.1 % in our experiments for volcanic ash (EY01). However, this might be due to the comparably large size (>100 µm) of the particles which where used in the studies conducted by Du-rant et al. (2008) and Fornea et al. (2009). These large parti-cles can be assumed to have increased freezing probabilities at higher temperatures due to the larger available ice nucleus surface.
3.3 Ice-active surface site densities for immersion freezing and deposition ice nucleation
The concept that is used to capture the ice nucleation effi-ciency of volcanic ash particle relies on the so-called ice-active surface site densityns(DeMott, 1995; Connolly et al., 2009). The concept of ice-active surface sites assumes that the time-dependence of the ice nucleation process – which is due to its stochastic nature – can be neglected under certain circumstances and substituted by a singular approach only considering thresholds at which ice nucleation is initiated (Niedermeier et al., 2010). A similar time-independent con-cept already has been proposed by Vali (1971) who described immersion freezing by an ice nuclei concentrationk(T ), with
k(T )being the concentration of ice nuclei becoming active at a certain temperature. Taking up this idea, Fletcher (1974) then formulated a temperature-dependent expression for the ice nucleation sites per square centimeter of particles being immersed in a droplet.
Using the singular approach instead of a stochastic de-scription of the ice nucleation properties appears to be a reasonably good representation for the ice nucleation effi-ciencies observed in our experiments while avoiding the in-troduction of a complex set of parameters which would be needed for a thorough description of the polydisperse aerosol
220 225 230 235 240 245 250
108 109 1010 1011
T [K] n s,d
e
p
a
n
d
n s
,i
m
m
[
m
-2]
exp. IN14_100/IN14_103 exp. IN14_105 exp. IN14_107 exp. IN14_110
Fig. 7. Relation between temperature and the ice-active surface site densities in deposition nucleation modens,dep (for three
ex-periments:•,H,⋆) and, for comparison, the ice-active surface site densities in immersion freezing modens,imm(); lines are expo-nential fits to measured data.
population by a distribution of contact angles (Marcolli et al., 2007). There are also stronger indications that ice crystal concentrations observed in AIDA experiments depend on the temperature (and RHicefor deposition nucleation) rather than on time (e.g. M¨ohler et al., 2006).
For the interpretation of our data, we employed a sim-plified version of the concept mentioned above (following Niemand et al., 2011) in which the ice-active surface site density (at a certain temperature and for deposition nucle-ation additionally at a certain relative humidity over ice) is defined as the ratio between the number density of ice cys-talsngreen (in cm−3) and the total aerosol surface density
A(in µm2cm−3) as estimated from the lognormal fits to the SMPS/APS measurements
ns=
n
A. (1)
Equation 1 is a linear approximation for the exponential function which is commonly used (e.g. Connolly et al., 2009, Murray et al., 2011). This approximation can be used for small activated fractions (f <10 %). For the calculation of
nsit has been taken into account that the aerosol surface den-sityAdecreases in the course of an expansion experiment because the aerosol is diluted by pumping the AIDA cham-ber. Sincensis calculated for the total aerosol surface density
A,nsmust be interpreted as an average over all particle sizes, not taking into account that chemical composition and thus ice-active surface site densities might vary among different particle size classes. Note thatAbeing estimated from the fits to the SMPS/APS measurements – under the assumption of spherical particles – can be considered as a lower limit for the accessible surface area of the volcanic ash particles which are highly non-spherical.
224 226 228 230 232 234 236 238 240 242 100
105 110 115 120 125 130
T [K]
RH
ic
e
[%
]
ns,dep= 109m-2
ns,dep= 5⋅109m-2
ns,dep= 1010m-2
ns,dep= 1011m-2
Fig. 8. Ice-active surface site densities for deposition nucleation ns,dep of volcanic ash particles (size of circles indicates value of
ns,dep) with respect to relative humidity over ice and temperature.
temperature and relative humidity over ice for deposition nu-cleation, whereas for immersion freezing, temperature alone is the determining factor. In the case of immersion freezing, the aerosol surface densityArefers to all particles activated to droplets. Since in our experiments nearly all aerosol parti-cles were activated to droplets before freezing was initiated,
Ais estimated to equal the total aerosol surface as derived from APS/SMPS measurements.
First, the results for immersion freezing are discussed, fol-lowed by a presentation of ice-active surface site densities for deposition nucleation. Figure 6 depicts the ice-active surface site densities derived from two experiments (IN14 100 and IN14 103). Both expansion experiments started at the same temperature, but during the second experiment (IN14 103) a cyclone was operated in series with the rotating brush gen-erator, which resulted in the elimination of particles larger than approximately 5 µm (see Fig. 3). Since freezing oc-cured after aerosol particles had been activated to droplets, Fig. 6 represents ice-active surface site densities for immer-sion freezing of volcanic ash particles. For both experiments, total aerosol surface values were relatively similar with 385 and 400 µm2cm−3, respectively, and also the measured ice crystal number densities did not differ much. The over-lap between both experiments demonstrates that ice-active surface site densitiesns,imm are similar within uncertainties from measurements and fitting procedures. Thus, it can be concluded that larger particles within the size interval be-tween 5 and 10 µm – constituting roughly half of the total aerosol surface – do not contribute over-proportionally to the ice-active surface site densityns,imm in comparison to the particles smaller than 5 µm. The assumption ofns,imm not depending strongly on particle size is therefore sup-ported by the aforementioned finding. From the measure-ment data, a fit relating the ice-active surface site density
ns,immin immersion freezing mode and temperature was de-rived (method described in detail by Niemand et al., 2011):
ns,imm(T )=
nimm
A =exp(−0.74×T+203.77)m
−2
(2) whereT is temperature in (K),nimmthe ice crystal number density andAthe aerosol surface density scaled with losses due to diluting the aerosol by pumping. This relation is valid for temperatures between 244 and 250 K. Since above 250 K the ice fractionf was less than 0.1 %, forns,immonly a rough estimate of∼108m−2 at 252 K can be given. The dashed lines in Fig. 6 depict the uncertainty1ns,immof the fit that can be attributed to measurement and evaluation uncertain-ties in the ice crystal number densitynimm(as derived from the WELAS/WELAS2 measurements) and the aerosol sur-face density A (as derived from the APS/SMPS measure-ments). From the measurement uncertainties 1n and1A
being at least±25 %,1ns,imm is estimated to be±35 % of
ns,imm.
Note that a factor that could have a major influence on the measurement uncertainty1Ais thatAis derived under the simplifying assumption of spherical particles which does not apply for volcanic ash particles. However, also in vol-canic ash dispersion models (Emeis et al., 2011) and for the evaluation of atmospheric measurements (Stohl et al., 2011) volcanic ash particles are assumed to be spherical.
Compared to our observations, the ice-active surface site densities for Asian and Saharan dust in immersion freezing mode are larger with∼1011m−2at a temperature of 250 K
(Connolly et al., 2009), but overall we find that, with regard to the initiation of immersion freezing, volcanic ash is nearly as efficient as other natural mineral dusts. Its efficiency is comparable to Canary Dust, which has been investigated dur-ing an extensive study of the ice nucleation properties of sev-eral minsev-eral dusts (Niemand et al., 2011). The ice nucleation properties of kaolinite particles have been investigated with a cold stage setup in a study by Murray et al. (2011) and signif-icantly lower ice-active surface densities withns∼107m−2 were found at 245 K.
Analogously, the ice-active surface site densities have been calculated for deposition nucleation at temperatures below 242 K. In Fig. 8 ice-active surface site densities are presented as a function of temperature and relative humid-ity over ice. The data points shown in Fig. 8 are derived from separately analysing the relation between ice-active sur-face site densities and each factor, namely temperature and relative humidity over ice, for the experiments IN14 105, IN14 107, and IN14 110. The uncertainties of temperature
T and relative humidity over ice RHice result both from the measurement uncertainties of those two variables and from the analysis that is described below. Uncertainties are esti-mated to be1T = ±0.3 K and1RHice= ±5%.
fitting temperature-dependent exponential functions to each of thens-trajectories. The difference between experiments in which immersion freezing occured (IN14 100 and IN14 103 – see Table 1 for reference) is clearly visible in contrast to those experiments where deposition nucleation was observed (IN14 105, IN14 107 and IN14 110). First, it can be seen from Fig. 7 that the highest values for ice-active surface site densities are observed in deposition nucleation mode at low temperatures: for the maximum values of supersaturation over ice that were reached during our experiments,ns,dep is as large as 1011m−2, whereas for immersion freezing ice-active surface site densities that we observed hardly exceed 1010m−2. The second difference between both ice nucle-ation modes is that the slope with respect to temperature is apparently much steeper for ice nucleation in deposition mode than for immersion freezing. This behaviour results from the fact that the ice-active surface site densityns,imm(T ) solely depends on temperature, whereas for deposition nucle-ationns,dep(RHice,T )depends on relative humidity over ice RHice(T ) and temperature T. Taking into account the im-plicit dependence ofns,dep(RHice,T )on temperature with
dns,dep
dT =
∂ns,dep
∂T +
∂ns,dep
∂(RHice)
∂(RHice)
∂T (3)
it can be estimated for theRHice-trajectories observed during our experiments that the second term of the above equation dominates the temperature dependence. Thus, the steeper slope results from the predominant influence of relative hu-midity over ice onns,dep. Figure 8 shows thatns,depis highest at low temperature and high relative humidity over ice, reach-ing values of 1011m−2. Also, it can be seen that ice-active surface site densities monotonously increase with decreasing temperature and higher supersaturation over ice.
Note that the data shown in Fig. 7 suggests that exper-iment IN14 105 belongs to the group of deposition nucle-ation experiments. However, as there are indicnucle-ations for a contribution via immersion freezing, data points in Fig. 8 above 240 K represent a combination of deposition nucle-ation and immersion freezing. During experiment IN14 105 the relative humidity continuously stayed below water satu-ration which would allow only for deposition freezing. How-ever, the SIMONE depolarisation was observed to drop due to water uptake by volcanic ash particles even before reach-ing water saturation. Thus, it can be assumed that there was a non-negligible contribution via immersion freezing. Since the contributions of immersion freezing and deposition nu-cleation to the observed ice crystal concentration could not be quantified exactly, these data points above 240 K were ex-cluded for the following analysis. A fit to the data below 240 K gives the following equation:
ns,dep(RHice,T )=
ndep
A
=109×exp(−0.5×(T−T0)+27.0×(RHice−RHice,0))m−2 (4)
with RHice,0=102.5 % andT0=225.6 K.Ais again the dilution-scaled aerosol surface andndep the number density of ice crystals produced by deposition nucleation. For tem-peratures between 224 and 234 K and relative humidities over ice between 102 and 123 %, this relation predicts ice-active surface site densities in deposition nucleation mode with a precision of±20 %.
From data presented in former deposition nucleation stud-ies (M¨ohler et al., 2006) estimates for the ice-active sur-face site densities of ATD (Arizona Test Dust, Powder Tech-nology Inc.), Asian Dust and Saharan Dust can be calcu-lated. Those calculations yield ice-active surface site densi-tiesns,dep∼1010m−2(atT ∼220 K and RHice∼130 %) for Asian Dust and Saharan Dust. For ATD ice-active-surface site densities are larger with ns,dep∼1011m−2 at a higher temperature (T =223 K) and lower relative humidity over ice (RHice∼105 %). Note that ATD consists of Arizonian sand that has been milled, washed, dried and sieved in sev-eral steps, whereas Asian Dust and Saharan Dust have only been sieved but not processed otherwise. From comparing our measurement results to the aforementioned estimates, it can be concluded that initiation of deposition nucleation by volcanic ash is less efficient than with ATD. In contrast, vol-canic ash particles appear to be more efficient ice nuclei in deposition nucleation mode than Asian and Saharan Dust.
Ice-active surface site densities derived from atmospheric ice nuclei measurements investigating the contribution of volcanic ash are only available for warmer temperatures (∼255 K) and find ns,dep=2×10⁹m−2 (Bingemer et al., 2011). At this temperature, we have not observed any ice nucleation.
4 Conclusions
Volcanic ash particles are able to nucleate ice over a large range of atmospheric conditions with regard to relative hu-midity and temperature. Our results agree well with a study of Hoyle et al. (2011) in which the ice nucleation properties of the same Eyjafjallaj¨okull sample are investigated, finding that volcanic ash particles induce ice nucleation over a tem-perature range between 263 and 223 K. In our experiments, immersion freezing is observed at temperatures below 252 K. However, ice-fractions did not exceed a threshold of 0.1 % before reaching temperatures lower than 250 K. Deposition nucleation was observed only at temperatures below 242 K. In our experiments the maximum ice fraction for volcanic ash is about 40 % for deposition nucleation at RHice=117 % and
T =223 K. Single-particle studies with volcanic ash have
increased freezing probabilities at higher temperatures due to the larger available ice nucleus surface.
With respect to the ice nucleation efficiency of volcanic ash particles, we find ice-active site densitiesns,immbetween 108m−2and 1010m−2for a temperature range between 250 and 244 K for ice nucleation via the immersion freezing mode. For deposition nucleation, ns,dep is approximately two orders of magnitude larger with 1011m−2at 224 K and RHice=116 %. Thus, fine volcanic ash from the
Eyjafjal-laj¨okull eruption in April 2010 is at least as efficient as cer-tain natural mineral dusts both in immersion freezing and de-position nucleation mode (Field et al., 2006; Niemand et al., 2011; M¨ohler et al., 2006) but initiates deposition nucleation less efficiently than ATD (Connolly et al., 2009). Recent measurements of volcanic ash particles as atmospheric ice nuclei are only available for deposition nucleation and find
ns,dep=2×10⁹m−2at 255 K (Bingemer et al., 2011; M¨ohler et al., 2006). In this temperature regime, we do not find a contribution by deposition nucleation, but only immersion freezing at slightly lower temperatures. Also, at 250 K ice-active surface site densities measured in our experiments are significantly smaller withns,imm∼108m−2. For both ice nu-cleation modes, fits were calculated relating ice-active sur-face site densities to temperature and, for deposition nucle-ation, to relative humidity over ice.
Our experimental results have shown similarities between the ice nucleation behaviour of certain mineral dusts and fine volcanic ash from the Eyjafjallaj¨okull. Since estimates for the atmospheric fluxes of fine volcanic ash suggest an amount of 176–256 Tg per year (Durant et al., 2010), volcanic ash particles being efficient ice nuclei are likely to have a non-negligible influence on atmospheric processes which should be investigated further. However, volcanic ash ice nuclei are currently neglected in global climate models (e.g. Hoose et al., 2010). From atmospheric size distribution measure-ments in the Eyjafjallaj¨okull ash plume (Schumann et al., 2011), estimates for atmospheric ice nuclei concentrations can be derived from the aerosol surface distributions and the ice-active surface site density at a certain temperature: for immersion freezing at 248 K, roughly a concentration be-tween 30 and 150 IN/l can be calculated with the aerosol sur-faces (AL≈30 µm2cm−3 andANA≈150 µm2cm−3) taken from Fig. 7 in Schumann et al. (2011) in which aerosol surface distributions from two measurements over Leipzig (19 April) and the North Atlantic (2 May) are depicted.
Open questions such as the influence of partial coatings with sulphuric acid on ice nucleation properties require fur-ther investigation and could be adressed as a part of a com-parison between different volcanic ash samples. Future ex-periments could also give hints to the relation between ice nucleation properties of volcanic ash and different volcanic eruption types.
Acknowledgements. Gudrun Larsen (Institute of Earth Sciences, University of Iceland) is thanked for kindly having provided the volcanic ash sample from Eyjafjallaj¨okull. Support by the AIDA technician team is gratefully acknowledged.
We acknowledge support by Deutsche Forschungsgemeinschaft and Open Access Publishing Fund of Karlsruhe Institute of Technology. Part of this research was funded by the Helmholtz Association through the President’s Initiative and Networking Fund.
Edited by: W. Birmili
References
Bingemer, H., Klein, H., Ebert, M., Haunold, W., Bundke, U., Herrmann, T., Kandler, K., M¨uller-Ebert, D., Weinbruch, S., Judt, A., Ardon-Dryer, K., Levin, Z., and Curtius, J.: Atmo-spheric ice nuclei in the Eyjafjallaj¨okull volcanic ash plume, At-mos. Chem. Phys. Discuss., 11, 2733–2748, doi:10.5194/acpd-11-2733-2011, 2011.
Cantrell, W. and Heymsfield, A.: Production of Ice in Tropo-spheric Clouds: A Review, B. Am. Meteorol. Soc., 86, 795–807, doi:10.1175/BAMS-86-6-795, 2005.
Connolly, P. J., M¨ohler, O., Field, P. R., Saathoff, H., Burgess, R., Choularton, T., and Gallagher, M.: Studies of heterogeneous freezing by three different desert dust samples, Atmos. Chem. Phys., 9, 2805–2824, doi:10.5194/acp-9-2805-2009, 2009. Cooper, W. A.: A Possible Mechanism for Contact
Nucle-ation, J. Atmos. Sci., 31, 1832–1837, doi:10.1175/1520-0469(1974)031¡1832:APMFCN¿2.0.CO;2, 1974.
DeMott, P. J.: Quantitative descriptions of ice formation mecha-nisms of silver iodide-type aerosols, Atmos. Res., 38, 63–99, doi:10.1016/0169-8095(94)00088-U, 1995.
Durant, A. J., Shaw, R. A., Rose, W. I., Mi, Y., and Ernst, G. G. J.: Ice nucleation and overseeding of ice in volcanic clouds, J. Geo-phys. Res., 113, D09206, doi:10.1029/2007JD009064, 2008. Durant, A. J., Bonadonna, C., and Horwell, C. J.: Atmospheric and
Environmental Impacts of Volcanic Particles, Elements, 6, 235– 240, doi:10.2113/gselements.6.4.235, 2010.
Eir´ıksdottir, E. and Alfredsson, H.: Leaching experiment on ash from Eyjafjallaj¨okull, available at: http://www.earthice.hi. is/page/IES-EY-CEMCOM (last access: 16 December 2011), 2010.
Emeis, S., Forkel, R., Junkermann, W., Sch¨afer, K., Flentje, H., Gilge, S., Fricke, W., Wiegner, M., Freudenthaler, V., Groß, S., Ries, L., Meinhardt, F., Birmili, W., M¨unkel, C., Obleitner, F., and Suppan, P.: Measurement and simulation of the 16/17 April 2010 Eyjafjallaj¨okull volcanic ash layer dispersion in the northern Alpine region, Atmos. Chem. Phys., 11, 2689–2701, doi:10.5194/acp-11-2689-2011, 2011.
Fahey, D. W., Gao, R. S., and M¨ohler, O.: Summary of the Aqua-VIT Water Vapor Intercomparison: Static Experiments, available at: https://aquavit.icg.kfa-juelich.de/WhitePaper (last access: 16 December 2011), 2009.
Flentje, H., Claude, H., Elste, T., Gilge, S., K¨ohler, U., Plass-D¨ulmer, C., Steinbrecht, W., Thomas, W., Werner, A., and Fricke, W.: The Eyjafjallaj¨okull eruption in April 2010 – detec-tion of volcanic plume using in-situ measurements, ozone sondes and lidar-ceilometer profiles, Atmos. Chem. Phys., 10, 10085– 10092, doi:10.5194/acp-10-10085-2010, 2010.
Fletcher, A. N.: Temperature Dependence of the Active Site Con-centration of Ice Nucleants, J. Atmos. Sci., 31, 1718-1720, 1974. Fletcher, N. H.: Active Sites and Ice Crystal Nucle-ation, J. Atmos. Sci., 26, 1266–1271, doi:10.1175/1520-0469(1969)026¡1266:ASAICN¿2.0.CO;2, 1969.
Formenti, P., Elbert, W., Maenhaut, W., Haywood, J., and Andreae, M. O.: Chemical composition of mineral dust aerosol during the Saharan Dust Experiment (SHADE) airborne campaign in the Cape Verde region, September 2000, J. Geophys. Res., 108, 8576, doi:10.1029/2002JD002648, 2003.
Fornea, A. P., Brooks, S. D., Dooley, J. B., and Saha, A.: Heterogeneous freezing of ice on atmospheric aerosols con-taining ash, soot, and soil, J. Geophys. Res., 114, D13201, doi:10.1029/2009JD011958, 2009.
Gislason, S. R., Hassenkam, T., Nedel, S., Bovet, N., Eiriksdot-tir, E. S., Alfredsson, H. A., Hem, C. P., Balogh, Z. I., Diderik-sen, K., Oskarsson, N., Sigfusson, B., LarDiderik-sen, G., and Stipp, S. L. S.: Characterization of Eyjafjallaj¨okull volcanic ash particles and a protocol for rapid risk assessment, Proc. Nat. Aca. Sci., 108, 7307–7312, doi:10.1073/pnas.1015053108, 2011.
Gudmundsson, M. T., Pedersen, R., Vogfj¨ord, K., Thorbjarnard´ottir, B., Jakobsd´ottir, S., and Roberts, M. J.: Eruptions of Eyjafjal-laj¨okull Volcano, Iceland, Eos Trans. AGU, 91, 190-191, 2010. Hobbs, P. V., Fullerton, C. M., and Bluhm, G. C.:
Ice Nucleus Storms in Hawaii, Nature, 230, 90–91, doi:10.1038/physci230090a0, 1971.
Hoose, C., Kristj´ansson, J. E., Chen, J.-P., and Hazra, A.: A Classical-Theory-Based Parameterization of Heterogeneous Ice Nucleation by Mineral Dust, Soot, and Biological Particles in a Global Climate Model, J. Atmos. Sci., 67, 2483–2503, doi:10.1175/2010JAS3425.1, 2010.
Hoyle, C. R., Pinti, V., Welti, A., Zobrist, B., Marcolli, C., Luo, B., H¨oskuldsson, ´A., Mattsson, H. B., Stetzer, O., Thorsteinsson, T., Larsen, G., and Peter, T.: Ice nucleation properties of volcanic ash from Eyjafjallaj¨okull, Atmos. Chem. Phys., 11, 9911–9926, doi:10.5194/acp-11-9911-2011, 2011.
Ilyinskaya, E., Tsanev, V., Martin, R., Oppenheimer, C., Blond, J. L., Sawyer, G., and Gudmundsson, M.: Near-source observa-tions of aerosol size distribuobserva-tions in the eruptive plumes from Ey-jafjallaj¨okull volcano, March-April 2010, Atmos. Environ., 45, 3210–3216, doi:10.1016/j.atmosenv.2011.03.017, 2011. Isono, K., Komabayasi, M., and Ono, A.: The Nature and the Origin
of Ice Nuclei in the Atmosphere, J. Meteorol. Soc. Jpn., 37, 211– 233, 1959a.
Isono, K., Komobayasi, M., and Ono, A.: Volcanoes as a Source of Atmospheric Ice Nuclei, Nature, 183, 317–318, doi:10.1038/183317a0, 1959b.
Krueger, B. J., Grassian, V. H., Cowin, J. P., and Laskin, A.: Heterogeneous chemistry of individual mineral dust par-ticles from different dust source regions: the importance of particle mineralogy, Atmos. Environ., 38, 6253–6261, doi:10.1016/j.atmosenv.2004.07.010, 2004.
Linke, C., M¨ohler, O., Veres, A., Moh´acsi, ´A., Boz´oki, Z., Szab´o,
G., and Schnaiter, M.: Optical properties and mineralogical com-position of different Saharan mineral dust samples: a laboratory study, Atmos. Chem. Phys., 6, 3315-3323, doi:10.5194/acp-6-3315-2006, 2006.
Marcolli, C., Gedamke, S., Peter, T., and Zobrist, B.: Efficiency of immersion mode ice nucleation on surrogates of mineral dust, Atmos. Chem. Phys., 7, 5081–5091, doi:10.5194/acp-7-5081-2007, 2007.
Mason, B. J. and Maybank, J.: Ice-nucleating properties of some natural mineral dusts, Q. J. R. Meteorol. Soc., 84, 235–241, doi:10.1002/qj.49708436104, 1958.
Mather, T. A., Pyle, D. M., and Oppenheimer, C.: Tropospheric Vol-canic Aerosol, Volcanism and the Earth’s Atmosphere, Geophys. Monogr., 139, 189–212, doi:10.1029/139GM12, 2003.
M¨ohler, O., Field, P. R., Connolly, P., Benz, S., Saathoff, H., Schnaiter, M., Wagner, R., Cotton, R., Kr¨amer, M., Mangold, A., and Heymsfield, A. J.: Efficiency of the deposition mode ice nucleation on mineral dust particles, Atmos. Chem. Phys., 6, 3007–3021, doi:10.5194/acp-6-3007-2006, 2006.
M¨ohler, O., Benz, S., Saathoff, H., Schnaiter, M., Wagner, R., Schneider, J., Walter, S., Ebert, V., and Wagner, S.: The ef-fect of organic coating on the heterogeneous ice nucleation effi-ciency of mineral dust aerosols, Environ. Res. Lett.s, 3, 025007, doi:10.1088/1478-9326/3/2/025007, 2008.
Murphy, D. M. and Koop, T.: Review of the vapour pressures of ice and supercooled water for atmospheric applications, Q. J. R. Meteorol. Soc., 131, 1539–1565, doi:10.1256/qj.04.94, 2005. Murray, B. J., Broadley, S. L., Wilson, T. W., Atkinson, J. D.,
and Wills, R. H.: Heterogeneous freezing of water droplets con-taining kaolinite particles, Atmos. Chem. Phys., 11, 4191–4207, doi:10.5194/acp-11-4191-2011, 2011.
Niedermeier, D., Hartmann, S., Shaw, R. A., Covert, D., Mentel, T. F., Schneider, J., Poulain, L., Reitz, P., Spindler, C., Clauss, T., Kiselev, A., Hallbauer, E., Wex, H., Mildenberger, K., and Strat-mann, F.: Heterogeneous freezing of droplets with immersed mineral dust particles – measurements and parameterization, At-mos. Chem. Phys., 10, 3601–3614, doi:10.5194/acp-10-3601-2010, 2010.
Niemand, M., M¨ohler, M., Vogel, B., Vogel, H., Hoose, C., Con-nolly, P., Klein, H., Bingemer, H., DeMott, P., Skrotzki, J., and Leisner, T.: Parameterization of immersion freezing on mineral dust particles: An application in a regional scale model, submit-ted, 2011.
Pruppacher, H. R. and Klett, J. D.: Microphysics of clouds and pre-cipitation, Atmospheric and oceanographic sciences library; 18, Kluwer, Dordrecht, 2nd rev. and enl. Edn., 1997.
Raga, G. B., Kok, G. L., Baumgardner, D., B´aez, A., and Rosas, I.: Evidence for volcanic influence on Mexico City aerosols, Geo-phys. Res. Lett., 26, 1149-1152, doi:10.1029/1999GL900154, 1999.
Rose, W. I. and Durant, A. J.: Fine ash content of ex-plosive eruptions, J. Volcanol. Geoth. Res, 186, 32–39, doi:10.1016/j.jvolgeores.2009.01.010, 2009.
Schaefer, V. J.: The Formation of Ice Crystals in the Lab-oratory and the Atmosphere, Chem. Rev., 44, 291–320, doi:10.1021/cr60138a004, 1949.
A., Forster, C., Baumann, R., Sailer, T., Graf, K., Mannstein, H., Voigt, C., Rahm, S., Simmet, R., Scheibe, M., Lichtenstern, M., Stock, P., R¨uba, H., Sch¨auble, D., Tafferner, A., Rautenhaus, M., Gerz, T., Ziereis, H., Krautstrunk, M., Mallaun, C., Gayet, J.-F., Lieke, K., Kandler, K., Ebert, M., Weinbruch, S., Stohl, A., Gasteiger, J., Groß, S., Freudenthaler, V., Wiegner, M., Ans-mann, A., Tesche, M., Olafsson, H., and Sturm, K.: Airborne ob-servations of the Eyjafjalla volcano ash cloud over Europe during air space closure in April and May 2010, Atmos. Chem. Phys., 11, 2245–2279, doi:10.5194/acp-11-2245-2011, 2011.
Seifert, P., Ansmann, A., Groß, S., Freudenthaler, V., Heinold, B., Hiebsch, A., Mattis, I., Schmidt, J., Schnell, F., Tesche, M., Wandinger, U., and Wiegner, M.: Ice formation in ash-influenced clouds after the eruption of the Eyjafjallaj¨okull volcano in April 2010, J. Geophys. Res., 116, D00U04, doi:10.1029/2011JD015702, 2011.
Shaw, R. A., Durant, A. J., and Mi, Y.: Heterogeneous Surface Crystallization Observed in Undercooled Water, J. Phys. Chem. B, 109, 9865–9868, doi:10.1021/jp0506336, 2005.
Soden, B. J., Wetherald, R. T., Stenchikov, G. L., and Robock, A.: Global Cooling After the Eruption of Mount Pinatubo: A Test of Climate Feedback by Water Vapor, Science, 296, 727–730, doi:10.1126/science.296.5568.727, 2002.
Stohl, A., Prata, A. J., Eckhardt, S., Clarisse, L., Durant, A., Henne, S., Kristiansen, N. I., Minikin, A., Schumann, U., Seibert, P., Stebel, K., Thomas, H. E., Thorsteinsson, T., Tørseth, K., and Weinzierl, B.: Determination of time- and height-resolved vol-canic ash emissions and their use for quantitative ash disper-sion modeling: the 2010 Eyjafjallaj¨okull eruption, Atmos. Chem. Phys., 11, 4333–4351, doi:10.5194/acp-11-4333-2011, 2011. Vali, G.: Quantitative Evaluation of Experimental Results
on the Heterogeneous Freezing Nucleation of Supercooled Liquids, J. Atmos. Sci., 28, 402–409, doi:10.1175/1520-0469(1971)028¡0402:QEOERA¿2.0.CO;2, 1971.
Vali, G.: Nucleation Terminology, J. Aerosol Sci., 16, 575–576, 1985.