OSD
10, 1343–1366, 2013Diffusive convection in the deep Arctic
Ocean
S.-Q. Zhou et. al.
Title Page
Abstract Introduction
Conclusions References
Tables Figures
◭ ◮
◭ ◮
Back Close
Full Screen / Esc
Printer-friendly Version
Interactive Discussion
Discussion
P
a
per
|
D
iscussion
P
a
per
|
Discussion
P
a
per
|
Discuss
ion
P
a
per
|
Ocean Sci. Discuss., 10, 1343–1366, 2013 www.ocean-sci-discuss.net/10/1343/2013/ doi:10.5194/osd-10-1343-2013
© Author(s) 2013. CC Attribution 3.0 License.
Geoscientiic Geoscientiic
Geoscientiic Geoscientiic
Open Access
Ocean Science
Discussions
This discussion paper is/has been under review for the journal Ocean Science (OS). Please refer to the corresponding final paper in OS if available.
The instability of di
ff
usive convection and
its implication for the thermohaline
staircases in the deep Arctic Ocean
S.-Q. Zhou1, L. Qu1,2, Y.-Z. Lu1,2, and X.-L. Song1,2
1
State Key Laboratory of Tropical Oceanography, South China Sea Institute of Oceanology, 164 West Xingang Road, Haizhu District, Guangzhou 510301, China
2
University of Chinese Academy of Sciences, Beijing, 100049, China
Received: 28 June 2013 – Accepted: 29 July 2013 – Published: 13 August 2013
Correspondence to: S.-Q. Zhou ([email protected])
OSD
10, 1343–1366, 2013Diffusive convection in the deep Arctic
Ocean
S.-Q. Zhou et. al.
Title Page
Abstract Introduction
Conclusions References
Tables Figures
◭ ◮
◭ ◮
Back Close
Full Screen / Esc
Printer-friendly Version
Interactive Discussion
Discussion
P
a
per
|
D
iscussion
P
a
per
|
Discussion
P
a
per
|
Discuss
ion
P
a
per
|
Abstract
In the present study, the classical description of diffusive convection is updated to in-terpret the instability of diffusive interfaces and the dynamical evolution of the bottom layer in the deep Arctic Ocean. In the new consideration of convective instability, both the background salinity stratification and rotation are involved. The critical Rayleigh 5
number of diffusive convection is found to vary from 103 to 1011 in the deep Arctic Ocean as well as in other oceans and lakes. In such a wide range of conditions, the interface-induced thermal Rayleigh number is indicated to be consistent with the critical Rayleigh number of diffusive convection. In most regions, background salinity stratifica-tion is found to be the main hindrance to the occurrence of convecting layers. With the 10
new parameterization, it is predicted that the maximum thickness of the bottom layer is 1051 m, which is close to the observed value of 929 m. And the evolution time of the bottom layer is predicted to be of the same order as that based on14C isolation age estimation.
1 Introduction
15
Double-diffusion is one of the most important non-mechanically driven mixing pro-cesses. It occurs in a fluid in which there are gradients of two (or more) properties with different molecular diffusivities and of opposing effects on the vertical density distribu-tion. This phenomenon is of great interest to many disciplines in the physical sciences and engineering (Turner, 1973), but the most active research area is exploration of 20
OSD
10, 1343–1366, 2013Diffusive convection in the deep Arctic
Ocean
S.-Q. Zhou et. al.
Title Page
Abstract Introduction
Conclusions References
Tables Figures
◭ ◮
◭ ◮
Back Close
Full Screen / Esc
Printer-friendly Version
Interactive Discussion
Discussion
P
a
per
|
D
iscussion
P
a
per
|
Discussion
P
a
per
|
Discuss
ion
P
a
per
|
nous mixed layers of nearly constant temperature and salinity, separated by strongly stratified thin interfaces.
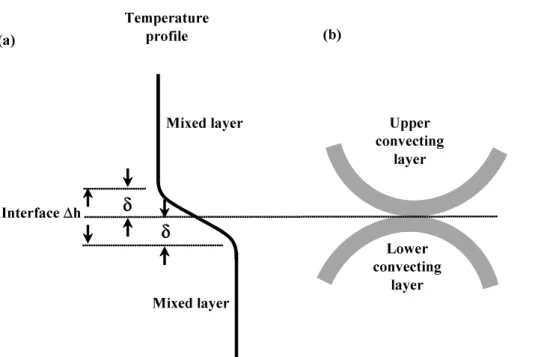
As sketched in Fig. 1, each convecting layer includes a well-mixed layer and is bounded by two adjacent interfaces. In each convecting layer of DC, the fluid prop-erties and flow dynamics can be described by four dimensionless parameters. The first 5
one is the thermal Rayleigh numberRaT =αgL 3
∆T/νκT, where g is the gravitational
acceleration, andα, ν, κT, ∆T, and L being, respectively, the thermal expansion co-efficient, the kinematic viscosity, the thermal diffusivity, the temperature difference and the typical length scale of the convecting layer. The second one is the salinity Rayleigh number,RaS=βgL3∆S/νκT, where ∆S is the salinity difference and β is the haline 10
contraction coefficient. The other two parameters are Prandtl number,Pr =ν/κT, and
Lewis number, Le=κS/κT, where κS is the salinity diffusivity. As the interface is the
boundary of two adjacent convecting layers, the thermal Rayleigh number of the in-terface, RaTI, is thought to be of the same order as the critical Rayleigh number of convection, which is of the order of 1000 (Turner, 1968, 1973). This argument has 15
been found to work well in the DC staircases in Lake Banyoles (Sánchez and Roget, 2007).
Recently, DC staircases have been observed in the deep Arctic Ocean (Timmer-mans et al., 2003; Timmer(Timmer-mans and Garrett, 2006; Björk and Winsor, 2006; Carmack et al., 2012). These thermohaline staircases exhibit several unique characteristics. One 20
of them is the thick diffusive interface. It is about 5–8 m, which is much larger than those observed in laboratory experiments (Turner, 1968; Huppert and Linden, 1979; Fernando, 1987), lakes (Sánchez and Roget, 2007; Schmid et al., 2010) and other ocean regions (Voorhis and Dorson, 1975; Larson and Gregg, 1983; Padman and Dil-lon, 1987; Anschutz and Blanc, 1996). In conjunction with the temperature difference 25
across the interface,∆θ∼1.3×10⁻³◦C, and other fluid properties, as listed in Table 1 below, the thermal Rayleigh number of the interface,RaTI, is of the order of 10
9
eluci-OSD
10, 1343–1366, 2013Diffusive convection in the deep Arctic
Ocean
S.-Q. Zhou et. al.
Title Page
Abstract Introduction
Conclusions References
Tables Figures
◭ ◮
◭ ◮
Back Close
Full Screen / Esc
Printer-friendly Version
Interactive Discussion
Discussion
P
a
per
|
D
iscussion
P
a
per
|
Discussion
P
a
per
|
Discuss
ion
P
a
per
|
date the difference between the result in the deep Arctic Ocean and those in previous studies.
Another prominent characteristic is that there exists a thick bottom mixed layer (Tim-mermans et al., 2003; Björk and Winsor, 2006; Tim(Tim-mermans and Garrett, 2006; Car-mack et al., 2012). In the Canada Basin, this isothermal and isohaline bottom layer 5
reaches to approximately 1000 m thick and extends 1000 km across the basin (Tim-mermans et al., 2003). Björk and Winsor (2006) proposed a simple one-dimensional diffusive-convection model to understand the dynamics of the bottom layer. However, their proposed evolution process strongly depends on turbulent eddy diffusivity, which is unavailable at the present stage, and can only explain parts of the observation. There-10
fore, it is necessary to seek other mechanisms that may dominate in the deep-water evolution process.
In this paper, we explore the instability of the diffusive interface using hydrographic data measured by McLane Moored Profilers (MMP) at a fixed location in the Canada Basin. The classical description proposed by Turner (1968, 1973) is extended here by 15
considering the influences of background salinity stratification and rotation. Then the instability of the interface is discussed in comparison with the onset thermal Rayleigh number of DC. With the new parameterization, we evaluate the evolution time and thickness of the bottom layer in the deep Arctic Ocean.
2 Data
20
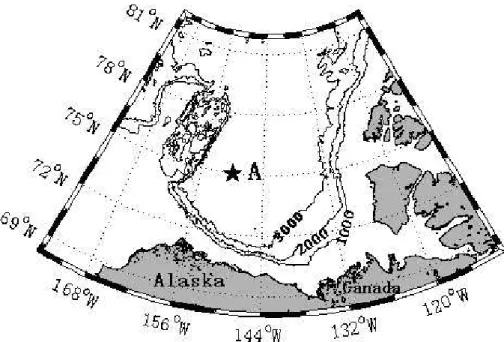
Hydrographic data were mainly obtained from the Beaufort Gyre Exploration Project (BGEP) (Ostrom et al., 2004; Proshutinsky et al., 2009). We focus on the variances of temperature and salinity in the deep ocean at a fixed location in the Beaufort Sea of Canada Basin. As marked in Fig. 2, Mooring A was deployed at 75◦, 150◦ at the
depth of 3825 m. From 2 October 2009 to 9 August 2010, the temperature and salinity 25
OSD
10, 1343–1366, 2013Diffusive convection in the deep Arctic
Ocean
S.-Q. Zhou et. al.
Title Page
Abstract Introduction
Conclusions References
Tables Figures
◭ ◮
◭ ◮
Back Close
Full Screen / Esc
Printer-friendly Version
Interactive Discussion
Discussion
P
a
per
|
D
iscussion
P
a
per
|
Discussion
P
a
per
|
Discuss
ion
P
a
per
|
profiles are shown in Fig. 3. In the potential temperature,θ, profile, as shown in Fig. 3a,
θdecreases with increasing depth till it reaches a minimum,θmin, around the depth of
2400 m. When the depth increases further,θincreases and is accompanied by obvious staircases, where the mixed layer and the interface are well resolved. Between 2950 m and the sea floor (not shown in Fig. 3), bothθ and S are homogenous and uniform, 5
this range forms the bottom layer. Similar step structures were observed in the salinity profiles (Timmermans et al., 2003; Björk and Winsor, 2006; Timmermans and Garrett, 2006). These structures are less pronounced in the salinity profiles here, as shown in Fig. 3b, due to the instruments resolution. As analyzed in our previous work (Zhou and Lu, 2013), the interface properties could be determined with an averaging technique. 10
In Fig. 3a, four DC steps can be identified from the potential temperature,θ, profile, which are referred to as the 1st, 2nd, 3rd and 4th steps from the bottom to the top respectively. Each step includes a mixed layer and its overlaying interface. Note that the mixed layer of the first step is the bottom layer. Usually, two parameters are used to characterize the susceptibility of water column to DC staircases. One is the density 15
ratioRρ(Turner, 1965), which is expressed as
Rρ=β∂S/∂z
α∂θ/∂z. (1)
Rρ is the ratio of the stabilizing force due to the salinity gradient and the destabilizing force due to the temperature gradient. The other one is buoyancy frequency, which has the form
20
N=[g(α∂θ/∂z−β∂S/∂z)]1/2, (2)
OSD
10, 1343–1366, 2013Diffusive convection in the deep Arctic
Ocean
S.-Q. Zhou et. al.
Title Page
Abstract Introduction
Conclusions References
Tables Figures
◭ ◮
◭ ◮
Back Close
Full Screen / Esc
Printer-friendly Version
Interactive Discussion
Discussion
P
a
per
|
D
iscussion
P
a
per
|
Discussion
P
a
per
|
Discuss
ion
P
a
per
|
and∂θ/∂z are reduced to the salinity and temperature gradients across the interface. According to the definitions ofRaT and RaS,Rρ can be rewritten asRρ=RaS/RaT.
For detailed analysis of the determination of the diffusive interface properties, readers are referred to Zhou and Lu (2013). The mean properties of the four interfaces are listed in Table 1.
5
3 The classical description of DC instability
The instability of DC has been extensively studied based on the results in laboratory experiments (Veronis, 1965; Turner, 1973; Caldwell, 1974; Huppert and Moore, 1976; Pearlstein, 1981). Basically, two modes may occur at the onset of convection; one is steady convection and the other is oscillatory convection. In the case of the ocean 10
(Le∼0.01), it has been found that the onset Rayleigh number of steady convection appears to be less than the value for oscillatory convection (Huppert and Moore, 1976). This implies the steady convection mode is responsible for convective instability in DC staircases. In terms of linear stability analysis (Turner, 1973), the convection happens when the thermal Rayleigh number,RaT, exceeds a critical value, Rac.Rac is written
15 as
Rac=Pr+Le
Pr+1 RaS+(1+Le)
1+Le Pr
27π4
4 . (3)
In the case of homogeneous fluid,RaS=0 andLe=0; and the equation is reduced to the onset Rayleigh number of the ordinary convection,Rac=27π
4
4 .
In the deep Arctic Ocean, the DC staircases are thick and the corresponding Coriolis 20
OSD
10, 1343–1366, 2013Diffusive convection in the deep Arctic
Ocean
S.-Q. Zhou et. al.
Title Page
Abstract Introduction
Conclusions References
Tables Figures
◭ ◮
◭ ◮
Back Close
Full Screen / Esc
Printer-friendly Version
Interactive Discussion
Discussion
P
a
per
|
D
iscussion
P
a
per
|
Discussion
P
a
per
|
Discuss
ion
P
a
per
|
number,Rac, would be in the form of
Rac=Pr+Le
Pr+1 RaS+(1+Le)
1+Le Pr
27π4
4
!13
T a23. (4)
Equation (4) implies that the convection occurs when the heat-induced buoyancy force gradient overcomes the resistance produced by the salt-stratification and rotation. In the ocean,Le∼0.01 andPr ∼4−10; Eqs. (3) and (4) are then simplified to
5
Rac=
Pr RaS
Pr+1 + 27π4
4 , forTa<10
3
, (5a)
and
Rac=
Pr RaS Pr+1 +
27π4
4
!13
T a23, forTa>105. (5b)
4 Results and discussions
Little work has been done to address the instability of DC in the ocean because the 10
involved convective flow state is typically far beyond the onset convection regime (Car-penter, 2012). As expected from the results in previous laboratory measurements (Howard, 1964; Turner, 1968; Huppert and Linden, 1979), however, the instability mechanism of DC may actually help to understand the characteristics of diffusive in-terface and the bottom layer in the deep Arctic Ocean, both of which are discussed 15
next.
4.1 Diffusive interface
OSD
10, 1343–1366, 2013Diffusive convection in the deep Arctic
Ocean
S.-Q. Zhou et. al.
Title Page
Abstract Introduction
Conclusions References
Tables Figures
◭ ◮
◭ ◮
Back Close
Full Screen / Esc
Printer-friendly Version
Interactive Discussion
Discussion
P
a
per
|
D
iscussion
P
a
per
|
Discussion
P
a
per
|
Discuss
ion
P
a
per
|
layer thickness,Raδ, is of the order of the critical value, namely,Raδ∼Rac (Howard,
1964; Siggia, 1994). This assumption has been confirmed to be marginally correct in the experiments, (Castaing et al., 1989, e.g.). In DC, as sketched in Fig. 1, each interface is the internal boundary of two adjacent convecting layers. Analogously, the same argument has been employed to study the diffusive interface instability by Turner 5
(1968, 1973). Recently, this argument has been found to work well in the DC staircases in Lake Banyoles (Sánchez and Roget, 2007).
For the diffusive interfaces in the deep Arctic Ocean, the corresponding thermal Rayleigh number,RaTI, is obtained from its definition with the typical scaleLand
tem-perature difference∆T being identified by the interface thickness∆hand temperature 10
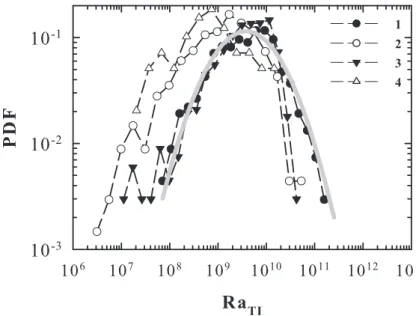
difference ∆θ. The temporal distributions of RaTI (shown in Fig. 4) indicate thatRaTI of each interface is distributed approximately log-normal, which suggests thatRaTIis
strongly intermittent. Similar distributions have been found in vertical heat flux, eddy diffusivity and other properties (Zhou and Lu, 2013). These results imply that the deep Arctic Ocean exhibits some turbulent behaviors (Frisch, 1995). The meansRaTIof all
15
interfaces, as listed in Table 1, are of the order of∼109, which are much larger than the observed (∼103) in single-layer convection (Castaing et al., 1989) and in DC (Sánchez and Roget, 2007). One may expect that the influences of salt-stratification or rotation must be involved, that is, Eq. (5) is used to explain the results here. However, as listed in Table 1, to all interfaces,Rρis larger than 2 and the salinity Rayleigh numberRaSIis 20
larger thanRaTI. Thus, whenRaSI is employed in Eq. (5), the obtainedRac would be
always larger thanRaTI, which is in conflict with the above mentioned assumption.
In a previous laboratory study by Turner (1968), Eq. (5) was used to interpret the onset of the convecting layer in DC. When the breakdown of the unstable boundary layer is described, it has been further argued that the original salinity gradient remains 25
OSD
10, 1343–1366, 2013Diffusive convection in the deep Arctic
Ocean
S.-Q. Zhou et. al.
Title Page
Abstract Introduction
Conclusions References
Tables Figures
◭ ◮
◭ ◮
Back Close
Full Screen / Esc
Printer-friendly Version
Interactive Discussion
Discussion
P
a
per
|
D
iscussion
P
a
per
|
Discussion
P
a
per
|
Discuss
ion
P
a
per
|
salinity Rayleigh number,Ra′
S, is in the form of
Ra′ S=
NS2L4
νκT
, (6)
whereNS= q
gβdS
dz is the buoyancy frequency based on the initial salinity gradient
be-fore being heated. This argument has been supported by the measurement of the ad-vancing boundary layer in another laboratory experiment (Huppert and Linden, 1979). 5
In the laboratory, however, the calculatedRa′
S is found to be very small due to the thin
boundary layer, and it is reasonable to be negligible. Therefore, in previous studies, Rac is reduced to the ordinary critical Rayleigh number based on heat alone (Turner, 1968).
It is expected that the same idea can be applied to the case of interest here. As it 10
is impossible to obtain the initial salinity gradient of the deep Arctic Ocean, the ground salinity gradient is alternatively used in Eq. (6). As shown in Fig. 3b, the back-ground salinity gradient is obtained by the linear fitting to all DC staircases in salinity profiles, resulting in ddsz =1.3×10⁻⁵ m−1 and the corresponding NS=3.1×10−
4
s−1.
Meanwhile, more data in the oceans and lakes have been collected to check the 15
applicability of the argument. These data include the field observations in the upper layer of the Canada Basin (BGOS, 2012), deep Red Sea (Anschutz and Blanc, 1996; Swift et al., 2012), Lake Kivu (Schmid et al., 2010), Lake Banyoles (Sánchez and Ro-get, 2007),and the Bahamas (Larson and Gregg, 1983). Typical interface properties of these data sources are listed in Table 2.
20
Special attention should be paid to the comparison between the interface thermal Rayleigh number,RaTI, and the critical Rayleigh number,Rac. In single-layer
convec-tion, the thermal boundary layer is a small region closing to the boundary. At the bound-ary, the temperature gradient is the largest. Away from the boundbound-ary, the temperature gradient becomes smaller and smaller till it turns into zero in the mixed layer. This tem-25
tem-OSD
10, 1343–1366, 2013Diffusive convection in the deep Arctic
Ocean
S.-Q. Zhou et. al.
Title Page
Abstract Introduction
Conclusions References
Tables Figures
◭ ◮
◭ ◮
Back Close
Full Screen / Esc
Printer-friendly Version
Interactive Discussion
Discussion
P
a
per
|
D
iscussion
P
a
per
|
Discussion
P
a
per
|
Discuss
ion
P
a
per
|
perature gradient is largest inside the interface, and it gets smaller and smaller as ap-proaching the interface end. By analogy with single-layer convection, each DC interface indeed consists of two boundary layers, as shown in Fig. 1, which are the top boundary layer of lower convecting layer and the bottom one of upper convecting layer. To the first-order approximation, the boundary layer thickness,δ, and the corresponding tem-5
perature difference, ∆θδ, can be taken asδ∼∆h/2 and ∆θδ∼∆θ/2. Consequently, the boundary layer thermal Rayleigh number,RaTδ, should beRaTδ∼RaTI/16. The
same consideration is also applied to the salinity Rayleigh number, Ra′
Sδ, and Taylor number,T aδ, of the boundary layer. Typical values of these quantities are also listed in Table 2.
10
In terms of Eqs. (5b) and (6), the thermal critical Rayleigh number,Rac, is obtained from the δ-based salinity Rayleigh number, Ra′
Sδ, and the δ-based Taylor number, T aδ. Note that Eq. (5a) is used whenTa<1000. Within the collected data, the thermal critical Rayleigh number,Rac is found to vary in a wider range from 103 in the Lake Banyoles to 1011 in the deep red Sea, which are shown in Fig. 5a. Figure 5a also 15
exhibits that the calculated thermal critical Rayleigh number,Rac, is very close to the δ-based thermal Rayleigh number, RaTδ, in almost all the collected data. As some data were captured from the published figures (Sánchez and Roget, 2007; Larson and Gregg, 1983), the limited accuracy would be the most probable reason responsible for the data scatters in Fig. 5a. To the well statistical data, e.g. those in the upper Arctic 20
(BGOS, 2012), Rac is in good agreement with RaTδ. As far as we know, this is the first time that the classical description of DC has been applied to interpret instability of diffusive interfaces in the ocean.
In addition, we examine the influences of background salinity stratification and the rotation on the onset of convection. The comparison between the first and the second 25
con-OSD
10, 1343–1366, 2013Diffusive convection in the deep Arctic
Ocean
S.-Q. Zhou et. al.
Title Page
Abstract Introduction
Conclusions References
Tables Figures
◭ ◮
◭ ◮
Back Close
Full Screen / Esc
Printer-friendly Version
Interactive Discussion
Discussion
P
a
per
|
D
iscussion
P
a
per
|
Discussion
P
a
per
|
Discuss
ion
P
a
per
|
tribution of rotation is even smaller. Therefore, background salinity stratification would be the main hindrance to the occurrence of convective flow in the ocean. The influence of the salinity stratification, however, is not always important. In the Lake Banyoles, as shown in Fig. 5b, it is found thatRa′
Sδ∼50; thus, the inherent mechanism of thermal convection plays a dominating role there,RaTδ∼1000 in Sánchez and Roget (2007). 5
4.2 Bottom homogenous layer
As introduced in Sect. 1, the thick homogenous bottom layer is an unique feature of the deep Arctic Ocean (Timmermans et al., 2003; Björk and Winsor, 2006; Timmermans and Garrett, 2006; Carmack et al., 2012; Zhou and Lu, 2013). As the model proposed by Björk and Winsor (2006) cannot well explain the dynamics of the bottom layer, we 10
attempt to find other mechanisms. Recently, more evidence has been collected that geothermal heating plays an important role in the hydrographic configuration of deep water in the Arctic Ocean (Timmermans et al., 2003; Björk and Winsor, 2006; Timmer-mans and Garrett, 2006; Carmack et al., 2012; Zhou and Lu, 2013). The situation that the weakly-stratified deep Arctic Ocean is being heated by geothermal heating is simi-15
lar to those studied in the laboratory experiments and numerical simulations, where DC occurred in salt-stratified fluid heated from below (Turner, 1968; Huppert and Linden, 1979; Fernando, 1987). Thus, it is interesting to examine whether the results obtained from the laboratory experiments can be applied to the deep ocean and whether it can shed more light on the deep water dynamic process.
20
In the laboratory experiments where salt-stratified fluid was heated from below (Turner, 1968, 1973; Huppert and Linden, 1979; Fernando, 1987), it has also been found that the bottom layer is much thicker than the overlaying staircases, which is similar to the finding in the deep Arctic Ocean. In Turner’s (1968) theoretical work, he suggested that the homogeneous bottom layer reaches a critical thickness before 25
OSD
10, 1343–1366, 2013Diffusive convection in the deep Arctic
Ocean
S.-Q. Zhou et. al.
Title Page
Abstract Introduction
Conclusions References
Tables Figures
◭ ◮
◭ ◮
Back Close
Full Screen / Esc
Printer-friendly Version
Interactive Discussion
Discussion
P
a
per
|
D
iscussion
P
a
per
|
Discussion
P
a
per
|
Discuss
ion
P
a
per
|
above arguments based on Eqs. (5) and (6), this maximum thickness is deduced as,
hc1= 1
4Racνq0 3
κ2N8 S
!14
, (7)
hereq0 is the buoyancy flux, which is derived as q0=αgF/ρ0cp, and F is the heat
flux supplied from the bottom boundary. Eq. (7) has been verified in Turner’s laboratory except that the fittedRac was about∼2.4×10
4
, which is much larger than the ordi-5
nary value of∼1000. Coincidentally, as discussed in last subsection, the fittedRac is
very close to the interface thermal Rayleigh number,RaTI. In the deep Arctic Ocean, geothermal heating is taken asF∼50 mW m−2(Langseth et al., 1990). At Mooring A, the physical properties of sea water are respectively α=1.27×10⁻⁴◦C−1, β=7.5× 10⁻⁴,ν
=1.85×10⁻⁶m2s−1,κ=1.39×10⁻⁷m2s−1,g=9.8 m s−2,ρo=1041.3 kg m− 3
, 10
andcp=3899.1 J kg−
1◦C. With the related properties of the first interface, as listed in
Table 1, hc1 is calculated to be 526 m, which is smaller than the observed value of
929 m (Zhou and Lu, 2013). However, as proposed by the laboratory work, ifRac is replaced by RaTI in Eq. (7), hc1 is found to be 1051 m, which is much closer to the
observed value. 15
In another laboratory study, Fernando (1987) found that the bottom mixed layer still grows upwardly even after the second mixed layer forms. Based on the assumption that the kinetic and potential energies of turbulent eddies are balanced when the mixed layer grows to a critical height, an alternative expression for the layer thickness has been proposed,
20
hc2=41.5
q0
NS3
!12
. (8)
With the properties of the interface, the thickness hc2 is found to be 29 m, which is
OSD
10, 1343–1366, 2013Diffusive convection in the deep Arctic
Ocean
S.-Q. Zhou et. al.
Title Page
Abstract Introduction
Conclusions References
Tables Figures
◭ ◮
◭ ◮
Back Close
Full Screen / Esc
Printer-friendly Version
Interactive Discussion
Discussion
P
a
per
|
D
iscussion
P
a
per
|
Discussion
P
a
per
|
Discuss
ion
P
a
per
|
In a study of 14C isolation age, the deep water of the Canada Basin is estimated to be about 500 yr old (Macdonald et al., 1993). According to the laboratory study of Turner (1968), the evolution time of the bottom layer can be predicted by
τ=(NSh)
2
2q0
(9)
before the formation of the secondary convecting layers. Supposing that the bottom 5
layer thickness, h, is about 1000 m, the time τ is calculated to be τ=109 yr. In ob-servations, however, there are more than four thermohaline staircases overlying the bottom layer, which means that the evolution time of the bottom layer must be longer thanτ. In some sense,τ can be regarded as the lower bound of evolution time of the bottom layer.
10
Based on the above results, it is suggested that the homogenous bottom layer is the result of geothermal heating under salinity stratification. Its maximum thickness can be described by Eq. (7), whereRaTI is alternatively used. This implies that the evolution
of bottom layer is mainly controlled by the convective instability mechanism. The time,
τ, is inferred to be of the same order as that estimated from the 14C isolation age 15
detection, which also suggests that the main evolution mechanism of the deep water in deep Arctic Ocean is similar to that in the laboratory experiments (Turner, 1968, 1973; Huppert and Linden, 1979; Fernando, 1987).
5 Conclusions
In summary, the classical description of DC has been updated to interpret the instability 20
OSD
10, 1343–1366, 2013Diffusive convection in the deep Arctic
Ocean
S.-Q. Zhou et. al.
Title Page
Abstract Introduction
Conclusions References
Tables Figures
◭ ◮
◭ ◮
Back Close
Full Screen / Esc
Printer-friendly Version
Interactive Discussion
Discussion
P
a
per
|
D
iscussion
P
a
per
|
Discussion
P
a
per
|
Discuss
ion
P
a
per
|
RaTδ, is consistent with the critical Rayleigh number,Rac, of DC. It is expected that this new parameterization of Eqs. (5) and (6) can be extensively applied to DC in other oceans and lakes. In most cases, the salinity stratification is found to be the main hindrance to the occurrence of convective flow except for regions where the diffusive interface is thin, e.g., in Lake Banyoles. When the interface thermal Rayleigh number, 5
RaTI, is alternatively employed in the old parameterization of Eq. (7), the predicted
maximum thickness of the bottom layer is 1051 m, which is close to the observed value of 929 m. The evolution time of the bottom layer,τ, is predicted to be ∼100 yr, which is of the same order as the14C isolation age estimate. As multi-layers overlaying the bottom layer, the evolution time of of water in the deep Arctic Ocean must be longer 10
thanτ, andτcan be taken as the lower bound of the resident time.
In the formation of deep Arctic water, one perhaps cannot exclude the effects of other instabilities, e.g. thermobaric convection (Carmack et al., 2012) or topographic Rossby waves formed as a result of instability of a strong current (Timmermans et al., 2010). Nonetheless, according to the results in this study, the main evolution mechanism of the 15
deep water would be similar to that in the laboratory experiments where salt-stratified fluid was heated from below (Turner, 1968, 1973; Huppert and Linden, 1979; Fernando, 1987). Therefore, when the classical description of DC is updated, it can be applied to interpret the main flow dynamics of the deep Arctic Ocean.
Acknowledgements. We thank Mary-Louise Timmermans and Martin Schmid for their
con-20
structive comments. This work was supported by China NSF grants (41176027 and 11072253), Guangdong NSF (10251030101000000), and the 973 Program (2010CB950302). The data were collected and made available by the Beaufort Gyre Exploration Program based at the Woods Hole Oceanographic Institution (http://www.whoi.edu/beaufortgyre) in collaboration with researchers from Fisheries and Oceans Canada at the Institute of Ocean Sciences.
OSD
10, 1343–1366, 2013Diffusive convection in the deep Arctic
Ocean
S.-Q. Zhou et. al.
Title Page
Abstract Introduction
Conclusions References
Tables Figures
◭ ◮
◭ ◮
Back Close
Full Screen / Esc
Printer-friendly Version
Interactive Discussion
Discussion
P
a
per
|
D
iscussion
P
a
per
|
Discussion
P
a
per
|
Discuss
ion
P
a
per
|
References
Anschutz, P. and Blanc, G.: Heat and salt fluxes in the Atlantis II Deep (Red Sea)., Earth Planet. Sc. Lett, 142, 147–159, doi:10.1016/0012-821X(96)00098-2, 1996. 1345, 1351, 1361 BGOS: The hydrographic data measured by the Ice-Tethered Profiler 2 (ITP2) in Beaufort Gyre
Observing System (BGOS) were used in the present work., available at: http://www.whoi.
5
edu/itp, last access: 10 August 2012. 1351, 1352
Björk, G., and Winsor, P.: The deep waters of the Eurasian Basin, Arctic Ocean: geothermal heat flow, mixing and renewal, Deep Sea Res. Pt. I, 53, 1253–1271, doi:10.1016/j.dsr.2006.05.006, 2006. 1345, 1346, 1347, 1353
Caldwell, D. R.: Experimental studies on the onset of thermohaline convection, J. Fluid Mech.,
10
64, 347–368, doi:10.1017/S0022112074002436, 1974. 1348
Carmack, E. C., Williams, W. J., Zimmermann, S. L., and McLaughlin, F. A.: The Arctic Ocean warms from below, J. Geophys. Res., 39, L07604, doi:10.1029/2012GL050890, 2012. 1345, 1346, 1353, 1356
Carpenter, J. R., Sommer, T., and Wuest, A.: Stability of a double-diffusive interface in the
dif-15
fusive convection regime, J. Phys. Oceanogr., 42, 840–854, doi:10.1175/JPO-D-11-0118.1, 2012. 1349
Castaing, B., Gunaratne, G., Heslot, F., Kadanoff, L., Libchaber, A., Thomae, S., Wu, X.-Z., Zaleski, S., and Zanetti, G.: Scaling of hard thermal turbulence in Rayleigh–Bénard convec-tion, J. Fluid.Mech., 204, 1, doi:10.1017/S0022112089001643, 1989. 1350
20
Fernando, H. J. S.: The formation of layered structure when a stable salinity gradient is heated from below, J. Fluid. Mech., 182, 525–541, doi:10.1017/S0022112087002441, 1987. 1345, 1353, 1354, 1355, 1356
Frisch, U.: Turbulence: the Legacy of A. N. Kolmogorov, Cambridge University Press, UK, 1995. 1350
25
Howard, L. N.: Convection at high Rayleigh number, edited by: Grtler, H., Proc. 11th Cong. Applied Mech., 1964. 1349, 1350
Huppert, H. E. and Linden, P. F.: On heating a stable salinity gradient from below, J. Fluid. Mech., 95, 431–464, doi:10.1017/S0022112079001543, 1979. 1345, 1349, 1351, 1353, 1355, 1356
30
OSD
10, 1343–1366, 2013Diffusive convection in the deep Arctic
Ocean
S.-Q. Zhou et. al.
Title Page
Abstract Introduction
Conclusions References
Tables Figures
◭ ◮
◭ ◮
Back Close
Full Screen / Esc
Printer-friendly Version
Interactive Discussion
Discussion
P
a
per
|
D
iscussion
P
a
per
|
Discussion
P
a
per
|
Discuss
ion
P
a
per
|
Kelley, D. E., Fernando, H. J. S., Gargett, A. E., Tanny, J., and Özsoy, E.: The diffusive regime of double diffusive convection, Prog. Oceanogr., 56, 461–481, doi:10.1016/S0079-6611(03)00026-0, 2003. 1344, 1347
Langseth, M. G., Lachenbruch, A., and V.Marshall, B.: Geothermal Observations in the Arctic Region, The Geology of North America: the Arctic Ocean Region, The Geological Society of
5
America, 1990. 1354
Larson, N. G. and Gregg, M. C.: Turbulent dissipation and shear in thennohaline intrusions, Nature, 306, 26–32, doi:10.1038/306026a0, 1983. 1345, 1351, 1352, 1361
Lui, S. L. and Xia, K. Q.: Spatial structure of the thermal boundary layer in turbulent convection, Phys. Rev. E, 57, 5494–5503, doi:10.1103/PhysRevE.57.5494, 1998. 1351
10
Macdonald, R., Carmack, E. C., and Wallace, D. W. R.: Tritium and radiocarbon dating of Canada basin deep waters, Science, 259, 103–104, doi:10.1126/science.259.5091.103, 1993. 1355
Ostrom, W., Kemp, J., Krishfield, R., and Proshutinsky, A.: Beaufort Gyre freshwater exper-iment: deployment operations and technology in 2003, Technical Report WHOI-2004-1,
15
Woods Hole Oceanographic Institution, 2004. 1346
Padman, L. and Dillon, T. M.: Vertical heat fluxes through the Beaufort Sea thermohaline stair-case, J. Geophys. Res., 92, 10799–10806, doi:10.1029/JC092iC10p10799, 1987. 1345 Pearlstein, A. J.: Effect of rotation on the stability of a doubly diffusive fluid layer, J. Fluid Mech.,
103, 3389–412, doi:10.1017/S0022112081001390, 1981. 1348
20
Proshutinsky, A., Krishfield, R., Timmermans, M.-L., Toole, J., Carmack, E., McLaughlin, F., Williams, W. J., Zimmermann, S., Itoh, M., and Shimada, K.: Beaufort Gyre freshwa-ter reservoir: state and variability from observations, J. Geophys. Res., 114, C00A10, doi:10.1029/2008JC005104, 2009. 1346
Sánchez, X., and Roget, E.: Microstructure measurements and heat flux calculations of a
triple-25
diffusive process in a lake within the diffusive layer convection regime, J. Geophys. Res., 112, C02012, doi:10.1029/2006JC003750, 2007. 1345, 1350, 1351, 1352, 1353, 1361
Schmid, M., Busbridge, M., and Wüest, A.: Double diffusive convection in Lake Kivu, Limnol. Oceanogr., 55, 225–238, doi:10.4319/lo.2010.55.1.0225, 2010. 1345, 1351, 1361
Schmitt, R. W.: Double diffusion in oceanography, Annu. Rev. Fluid Mech., 26, 255–285,
30
doi:10.1146/annurev.fl.26.010194.001351, 1994. 1344
OSD
10, 1343–1366, 2013Diffusive convection in the deep Arctic
Ocean
S.-Q. Zhou et. al.
Title Page
Abstract Introduction
Conclusions References
Tables Figures
◭ ◮
◭ ◮
Back Close
Full Screen / Esc
Printer-friendly Version
Interactive Discussion
Discussion
P
a
per
|
D
iscussion
P
a
per
|
Discussion
P
a
per
|
Discuss
ion
P
a
per
|
Swift, S. A., Bower, A. S., and Schmitt, R. W.: Vertical, horizontal, and temporal changes in temperature in the Atlantis II and discovery hot brine pools, Red Sea, Deep Sea Res. I, 64, 118–128, doi:10.1016/j.dsr.2012.02.006, 2012. 1351, 1361
Timmermans, M. L. and Garrett, C.: Evolution of the deep water in the Canadian Basin of the Arctic Ocean, J. Phys. Oceanogr., 36, 866–874, doi:10.1175/JPO2906.1, 2006. 1345, 1346,
5
1347, 1353
Timmermans, M. L., Garrett, C., and Carmack, E.: The thermohaline structure and evolution of the deep waters in the Canada Basin, Arctic Ocean, Deep Sea Res. Pt. I, 50, 1305–1321, doi:10.1016/S0967-0637(03)00125-0, 2003. 1345, 1346, 1347, 1353
Timmermans, M. L., Rainville, L., Thomas, L., and Proshutinsky, A.: Moored observations of
10
bottom-intensified motions in the deep Canada Basin, Arctic Ocean, J. Mar. Res., 68, 625– 641, doi:10.1357/002224010794657137, 2010. 1356
Turner, J. S.: The coupled turbulent transport of salt and heat across a sharp density interface, Int. J. Heat. Mass. Tran., 8, 759–767, doi:10.1016/0017-9310(65)90022-0, 1965. 1347 Turner, J. S.: The behavior of a stable salinity gradient heated from below, J. Fluid. Mech., 33,
15
183–200, doi:10.1017/S0022112068002442, 1968. 1345, 1346, 1349, 1350, 1351, 1353, 1355, 1356
Turner, J. S.: Buoyancy Effects in Fluids, Cambridge University Press, 1973. 1344, 1345, 1346, 1348, 1350, 1353, 1355, 1356
Veronis, G.: On finite amplitude instability in thermohaline convection, J. Mar. Res., 23, 1–17,
20
1965. 1348
Voorhis, A. D. and Dorson, D. L.: Thermal convection in the Atlantis II hot brine pool, Deep Sea Res., 22, 167–175, doi:10.1016/0011-7471(75)90056-X, 1975. 1345
Zhou, S.-Q., and Lu, Y.-Z.: Characterizations of double diffusive convection steps and heat budget in the deep Arctic Ocean, J. Geophys. Res., in revision, 2013. 1347, 1348, 1350,
25
OSD
10, 1343–1366, 2013Diffusive convection in the deep Arctic
Ocean
S.-Q. Zhou et. al.
Title Page
Abstract Introduction
Conclusions References
Tables Figures
◭ ◮
◭ ◮
Back Close
Full Screen / Esc
Printer-friendly Version
Interactive Discussion
Discussion
P
a
per
|
D
iscussion
P
a
per
|
Discussion
P
a
per
|
Discuss
ion
P
a
per
|
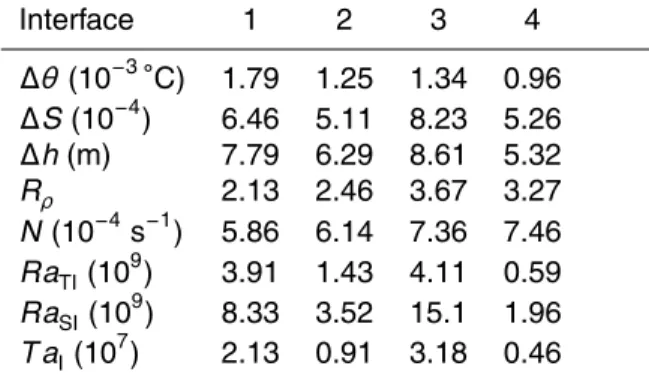
Table 1.Mean properties of four diffusive interfaces at Mooring A between 2 October 2009 and 9 August 2010. They are potential temperature difference,∆θ, salinity difference,∆S, and thickness,∆h, density ratio,Rρ, buoyancy frequency,N, thermal Rayleigh number,RaTI, salinity Rayleigh number,RaSI, and Taylor number,T aI.
Interface 1 2 3 4
∆θ(10−3◦C) 1.79 1.25 1.34 0.96
∆S(10−4
) 6.46 5.11 8.23 5.26
∆h(m) 7.79 6.29 8.61 5.32
Rρ 2.13 2.46 3.67 3.27
N(10−4s−1) 5.86 6.14 7.36 7.46
RaTI(109) 3.91 1.43 4.11 0.59
RaSI(109) 8.33 3.52 15.1 1.96
OSD
10, 1343–1366, 2013Diffusive convection in the deep Arctic
Ocean
S.-Q. Zhou et. al.
Title Page
Abstract Introduction
Conclusions References
Tables Figures
◭ ◮
◭ ◮
Back Close
Full Screen / Esc
Printer-friendly Version
Interactive Discussion
Discussion
P
a
per
|
D
iscussion
P
a
per
|
Discussion
P
a
per
|
Discuss
ion
P
a
per
|
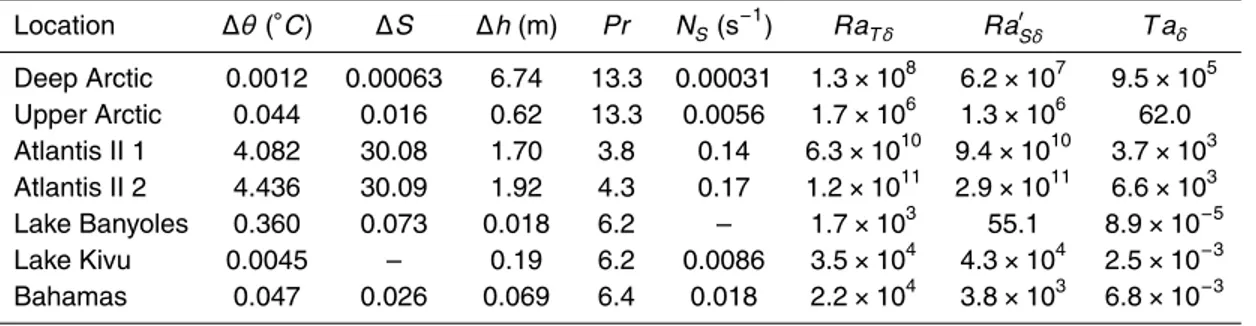
Table 2.Data used in the analysis. The average values are listed when more than one dataset are included in the data source. There are temperature difference,∆θ, salinity difference,∆S, thickness,∆h, and Prandtl number,Pr, of the interface; saline buoyancy frequency,NS, based on the background salinity profile; Taylor number,T aδ, thermal Rayleigh number, RaTδ, and salinity Rayleigh number,Ra′
Sδ of the boundary layer. Deep Arctic – data of the present work;
Upper Arctic – Average data measured by the ice-tethered profiler (ITP) 2 in the Beaufort Gyre Observation system (BGOS); Atlantis II 1 – Fig. 4 of Anschutz and Blanc (1996); and Atlantis II 2 – Fig. 4 of Swift et al. (2012); Lake Kivu – Fig. 1 and Table 2 of Schmid et al. (2010); Lake Banyoles – Figs. 2 and 8 of Sánchez and Roget (2007); and the Bahamas – Fig. 2 of Larson and Gregg (1983).
Location ∆θ(◦C) ∆S ∆h(m) Pr N S(s−
1
) RaTδ Ra′Sδ T aδ
Deep Arctic 0.0012 0.00063 6.74 13.3 0.00031 1.3×10⁸ 6.2×10⁷ 9.5×10⁵
Upper Arctic 0.044 0.016 0.62 13.3 0.0056 1.7×10⁶ 1.3×10⁶ 62.0
Atlantis II 1 4.082 30.08 1.70 3.8 0.14 6.3×10¹⁰ 9.4×10¹⁰ 3.7×10³
Atlantis II 2 4.436 30.09 1.92 4.3 0.17 1.2×10¹¹ 2.9×10¹¹ 6.6×10³
Lake Banyoles 0.360 0.073 0.018 6.2 – 1.7×10³ 55.1 8.9×10⁻⁵
Lake Kivu 0.0045 – 0.19 6.2 0.0086 3.5×10⁴ 4.3×10⁴ 2.5×10⁻³
OSD
10, 1343–1366, 2013Diffusive convection in the deep Arctic
Ocean
S.-Q. Zhou et. al.
Title Page
Abstract Introduction
Conclusions References
Tables Figures
◭ ◮
◭ ◮
Back Close
Full Screen / Esc
Printer-friendly Version
Interactive Discussion
Discussion
P
a
per
|
D
iscussion
P
a
per
|
Discussion
P
a
per
|
Discuss
ion
P
a
per
|
δ
(b)
Interface
∆h
δ
Lower
convecting
layer
Upper
convecting
layer
Mixed layer
Mixed layer
Temperature
profile
(a)
OSD
10, 1343–1366, 2013Diffusive convection in the deep Arctic
Ocean
S.-Q. Zhou et. al.
Title Page
Abstract Introduction
Conclusions References
Tables Figures
◭ ◮
◭ ◮
Back Close
Full Screen / Esc
Printer-friendly Version
Interactive Discussion
Discussion
P
a
per
|
D
iscussion
P
a
per
|
Discussion
P
a
per
|
Discuss
ion
P
a
per
|
Fig. 5. (a)Comparison between the calculated onset thermal Rayleigh number,Rac, based on Eq. (5) and the boundary layer thermal Rayleigh number,RaTδ.(b)Comparison between the first term,Pr Ra′
Sδ/(Pr+1), and the second term, (27π 4/