205
ABSTRACT: Objective: The aims of this study were to estimate the association between an at‑risk drinking pattern and sociodemographic variables, and to compare the mean scores of the factors associated with the Burnout Syndrome, according to the alcohol consumption pattern in staf members from two Brazilian prisons. Methods: A cross‑sectional study was developed with 339 participants (response rate = 63.8%). The instruments used were a sociodemographic questionnaire, the Alcohol Use Disorders Identiication Test (AUDIT), and the Maslach Burnout Inventory – General Survey (MBI‑GS). Results: The participants’ average age was 40.2 (SD = 8.8) years, and 81.0% were male. Among 78.5% of participants (95%CI 74.1 – 82.8) reported consuming alcoholic beverages. The prevalence of at‑risk drinking behavior in the sample was 22.4% (95%CI 18.0 – 26.9), and of the Burnout Syndrome was 14.6% (95%CI 10.8 – 18.4). We observed a signiicant association between at‑risk drinking behavior with gender, higher risk for men (OR = 7.32, p < 0.001), smoking, increased risk for smokers (OR = 2.77, p < 0.001), and religious practice, showing lower risks for religion practitioners (OR = 0.364, p < 0.001). We noticed signiicantly higher mean scores (p < 0.001) of emotional exhaustion and cynicism, and lower scores of professional achievement among individuals who reported consuming alcoholic beverages. Conclusion: Men who smoke were more likely to develop an at‑risk drinking pattern, while religion is presented as a protective factor. Individuals who consume alcohol were more afected by the diferent factors of the Burnout Syndrome.
Keywords: Alcoholism. Burnout, Professional. Risk. Gender. Smoking. Religion.
Burnout Syndrome and alcohol consumption
in prison employees
Síndrome de Burnout e consumo de álcool em agentes penitenciários
Juliana Alvares Duarte Bonini CamposI,II, Valéria SchneiderI, Fernanda Salloume Sampaio BonaféII,
Raquel Velez OliveiraIII, João MarocoIV
IAraraquara School of Pharmaceutical Sciences, Food and Nutrition Department, Universidade Estadual Paulista “Júlio de Mesquita
Filho” – Araraquara (SP), Brasil.
IIAraraquara School of Dentistry, Social Dentistry Department, Universidade Estadual Paulista “Júlio de Mesquita Filho” – Araraquara
(SP), Brasil.
IIIFlorida State University, College of Criminology and Criminal Justice – United States of America & Research Unit in Psychology
and Health – Portugal.
IVDepartment of Psychological Sciences & William James Center for Research, Instituto Universitário de Ciências Psicológicas,
Sociais e da Vida, ISPA/IU – Portugal.
Corresponding author: Juliana Alvares Duarte Bonini Campos. Faculdade de Ciências Farmacêuticas, Departamento de Alimentos e Nutrição, Universidade Estadual Paulista “Júlio de Mesquita Filho”. Rodovia Araraqura‑Jaú, km 1, CEP: 14801‑903, Araraquara, SP, Brazil. E‑mail: [email protected]
Conlict of interests: nothing to declare – Financial support: Grant #2010/18282‑4, São Paulo Research Foundation (FAPESP) and Prope/UNESP.
INTRODUCTION
Most of the studies developed in prisons focused on prisoners’ well‑being and health issues, but those regarding the staf are scarce1,2. Nevertheless, it has been shown that the prison envi‑
ronment, due to its speciic conditions and associated risks, presents itself as particularly harm‑ ful for its workers, frequently leading to increased occupational stress and health hazards3‑5.
Moreover, several authors have suggested that, in the attempt to deal with the resulting occupational stress, security and law enforcement professionals (such as police oicers, prison guards and correctional oicers) may present inadequate coping strategies and increased probability for substance abuse, such as alcohol consumption6‑9. It has been further shown
that these subjects show higher alcohol consumption rates than the general population8;
however, the recent consumption rates seem to vary widely between diferent studies, which might be due to the use of diversiied methodologies1,10,11.
Various factors that seem to inluence alcohol consumption have also been reported in the literature, varying from lifestyle variables, such as gender12‑15, smoking12,16‑19, religious
practice/spirituality17,20, sports practice10, age6,15, and income17, as well as working variables,
like stress6,7,21 and level of job satisfaction6. Furthermore, it is important to highlight that
a prolonged exposure to occupational stressors (intrinsic and extrinsic), together with low job satisfaction, may have a deleterious efect on the individual’s physical health and lead to psychosocial disorders, such the Burnout Syndrome22.
Maslach and Jackson23 characterize the Burnout Syndrome as a reaction to a longer exposure to
occupational stress associated with a lack of adequate coping strategies. The authors describe it as having
RESUMO: Objetivo: Estimar a associação entre o padrão de beber com risco e as variáveis sociodemográicas, e comparar os escores médios dos fatores relacionados com a Síndrome de Burnout, de acordo com o padrão do consumo de álcool em funcionários de duas prisões brasileiras. Métodos: Trata‑se de um estudo transversal, desenvolvido com 339 participantes (taxa de resposta de 63,8%). Os instrumentos utilizados foram um questionário sociodemográico, o Teste para Identiicação de Problemas Relacionados ao Uso de Álcool (AUDIT) e o Inventário de Burnout de Maslach – Forma Geral (MBI‑GS). Resultados: A média de idade dos participantes foi de 40,2 (DP = 8,8) anos, e 81,1% eram do sexo masculino. Um total de 78,5% dos participantes (IC95% 74,1 – 82,8) relatou consumir bebidas alcoólicas. A prevalência do comportamento de beber com risco na amostra foi de 22,4% (IC95% 18,0 – 26,9) e a da Síndrome de Burnout foi de 14,6% (IC95% 10,8 – 18,4). Observou‑se associação signiicativa entre o comportamento de beber com risco com o gênero, o maior risco para os homens (OR = 7,32, p < 0,001), o tabagismo, risco aumentado para os fumantes (OR = 2,77, p < 0,001) e a prática religiosa, mostrando menor risco para os praticantes de religião (OR = 0,364, p < 0,001). Notaram‑se escores médios (p < 0,001) mais altos de exaustão emocional e cinismo, e menor pontuação de eicácia proissional entre os indivíduos que relataram consumir bebidas alcoólicas. Conclusão: Homens fumantes foram os mais propensos a desenvolverem um padrão de beber com risco, enquanto a religião é apresentada como um fator protetor. Os indivíduos que consomem álcool foram os mais afetados pelos diferentes fatores da Síndrome de Burnout.
207
three separate dimensions: emotional exhaustion, cynicism and low professional eicacy. Based on these characteristics, this syndrome may lead to a low perceived competence and interfere in the interactions with others24. In addition, other authors have emphasized that it may result in inadequate coping strat‑
egies, such as increased alcohol or drug consumption, which, in turn, increase the individuals’ ill‑being, impacting their physical and psychological health, as well as their working and social capabilities25‑30.
This study aimed at estimating the association between sociodemographic variables, like gender, practice of religion and smoking, with the pattern of risky drinking behavior, and comparing the mean scores of emotional exhaustion, cynicism and professional eicacy on present versus absent drinking behavior of the staf members from two São Paulo state prisons.
METHODOLOGY
STUDY DESIGN AND SAMPLING
An observational and cross‑sectional study with a non‑probabilistic sampling was developed during 2011 and 2012. The staf members from two prisons (Penitentiary 1 – PI, n = 241; and Penitentiary 2 – PII, n = 290) located in a municipality in the state of São Paulo, Brazil, were invited to participate.
STUDY VARIABLES
Sociodemographic and work‑related information regarding age, gender, residence, children, eco‑ nomic level, work shift, working hours, prison unit, religion, sports practice, smoking habits, and med‑ ication intake due to occupational problems, was collected in order to enable sample characterization. The participants’ economic level was determined based on “Critério Brasil”, recommended by the Brazilian Market Research Association (ABEP)31.
The Alcohol Use Disorders Identiication Test (AUDIT) was applied to identify the drink‑ ing pattern. The Maslach Burnout Inventory – General Survey (MBI‑GS) was used to assess the Burnout Syndrome. The instruments are further described.
INSTRUMENTS
The AUDIT – Portuguese version32 is composed of 10 objective questions that allow
responses with predetermined weights, ranging from zero to four (frequency – items 1, 2 and 3; symptoms – 4, 5 and 6; consequences – 7, 8, 9 and 10). The sum of scores from every ques‑ tion indicated the classiication of each individual based on the alcohol consumption habits33.
The MBI‑GS – Portuguese version34 is comprised of 16 questions, divided into three factors:
PROCEDURES
The questionnaires were conidential and self‑completed in an isolated room in the peni‑ tentiary, during the working hours and previously appointed with the institution’s direction.
STATISTICAL ANALYSIS
Initially, the psychometric sensitivity of each item of the scales (MBI‑GS and AUDIT) was assessed using measures of shape (skewness and kurtosis). A conirmatory factor anal‑ ysis, using the maximum likelihood method, was conducted. The indices used to evaluate the goodness of it were the ratio of χ2 by degrees of freedom (χ2/df ), the comparative
it index (CFI), the goodness of it index (GFI) and the root mean square error of approx‑ imation (RMSEA). Values of χ2/df≤ 2.0, CFI and GFI ≥ 0.90 and RMSEA ≤ 0.10 were
indications of an adequate it35,36. All items with factor weights (λ) lower than 0.40 and
those whose trajectories and/or correlations presented Lagrange multipliers > 11 (p < 0.001), were removed35. The reliability was assessed through the standardized Cronbach’s
alpha coeicient (α)37,38.
After analyzing the instruments’ psychometric properties, the individuals were grouped according to the alcohol consumption pattern into abstinence, moderate drinking, and at‑risk drinking. This last category comprised individuals with patterns of harmful drinking, hazard‑ ous risk, and possible dependence. The fusion of these categories was done to ensure the min‑ imum sample size required for subsequent modeling analysis. To study associations between sociodemographic variables and drinking risk, the groups were dichotomized into “present” or “absent” at‑risk drinking, and the χ2 test with Yates correction was used. As a risk measure,
we applied the Odds Ratio (OR) by point and 95% conidence interval (95%CI). For computa‑ tion of the at‑risk drinking pattern probability, as a role of several sociodemographic variables, these with p < 0.10 were included in the inal multiple logistic regression model. To compare the mean scores of exhaustion, cynicism and professional eicacy according to the pattern of alcohol consumption, an analysis of variance (ANOVA) followed by Tukey’s post‑test was performed. Statistical signiicant efects were assumed for p < 0.05.
All statistical analyses were conducted either with SPSS AMOS (version 20, SPSS – IBM Company, Chicago, IL), or SPSS Statistics (version 20, SPSS – IBM Company, Chicago, IL).
ETHICAL ASPECTS
209
RESULTS
A total of 339 penitentiary staf members participated in the study (response rate – RR = 63.8%; PI – n = 119, RR = 49.4%; PII – n = 220, RR = 75.9%). The mean age of participants was 40.2 (SD = 8.8) years old.
The distribution of answers to the AUDIT is presented in Table 1.
A bias in the answers given to questions 4‑10 was observed regarding the lower scores, corresponding to the dimensions “symptoms” and “consequences” of alcohol consump‑ tion. Question 4 was removed to improve the AUDIT data factor structure (λ = 0.50 – 0.95;
χ2/df = 3.981; CFI = 0.939; GFI = 0.940; RMSEA = 0.094; α = 0.68 – 0.88).
The distribution by point and 95%CI of the subjects according to the pattern of alcohol consumption is presented in Table 2.
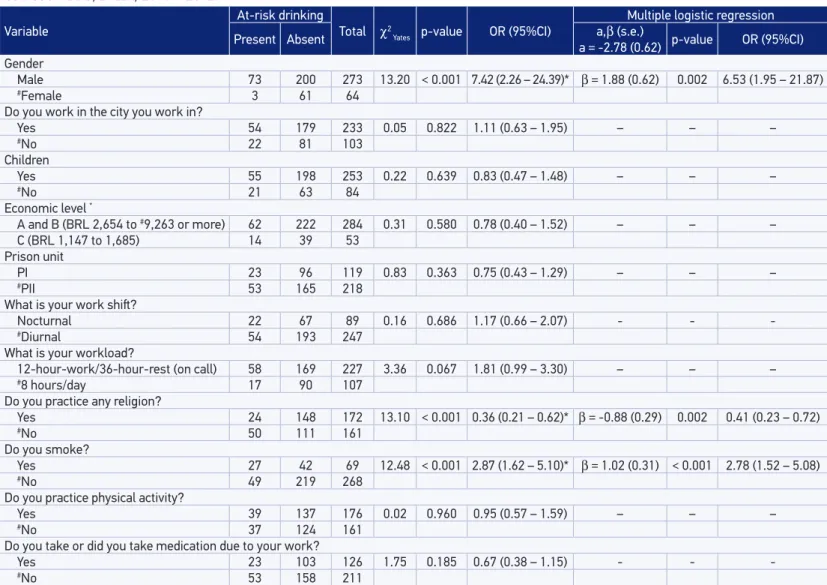
The overall prevalence of participants with at‑risk drinking behavior was 22.4%. The study of the association between sociodemographic and occupational variables of interest and at‑risk drinking behavior (absent, present) is presented in Table 3. It is import‑ ant to highlight that not all individuals answered all sociodemographic questions.
We observed a signiicant association between at‑risk drinking behavior and gender, reli‑ gious practice, and smoking. Men and smokers are more likely to present at‑risk drinking behaviors, and the religion practice was a signiicant protective factor against it. This rela‑ tionship was maintained in the multiple model (Table 4).
With regard to the Burnout Syndrome, skewness and kurtosis of all items were below three (in absolute values) and, therefore, there was no severe violation of normality36.
Distribution of the participants’ responses to the MBI‑GS is in Table 4. Three individu‑ als did not complete this instrument.
The high prevalence of participants who reported feeling “used up” after facing a work day, with a frequency ranging from regularly to everyday (question 2), and feeling burned out by work (question 6), is noteworthy in 54.8 and 55.9% respectively.
Another worth noting fact is that many individuals (45.2%) reported losing enthusiasm towards work (question 9), and most participants (83.8%) wished to do their jobs undistur‑ bedly (question 13).
In the conirmatory factor analysis, we observed a bad it of the MBI‑GS to the data (λ = 0.31 – 0.91; χ2/df = 4.768; CFI = 0.889; GFI = 0.855; RMSEA = 0.106; α = 0.81 – 0.94).
Item 13 presented a factor weight lower than 0.40 and the modiication indices indicated a strong correlation between items 14 and 15 (LM = 151.242). Thus, we proceeded to the improvement of the model, thus question 13 was removed, and a correlation between 14 and 15 was inserted. An adequate it of the three‑factor model to the sample was obtained (λ = 0.43 – 0.91; χ2/df = 2.721; CFI = 0.956; GFI = 0.914; RMSEA = 0.071) as reported in
a previous study (submitted for publication).
Questions
Answers
A B C D E Total
n (%) n (%) n (%) n (%) n (%) n (%)
*1 – How oten do you have a drink containing alcohol? 85 (25.1) 62 (18.3) 116 (34.2) 51 (15.0) 25 (7.4) 339
**2 – How many drinks containing alcohol do you have on a typical day when you are drinking? 175 (51.9) 88 (26.1) 48 (14.2) 14 (4.2) 12 (3.6) 337
***3 – How oten do you have six or more drinks on one occasion? 183 (54.0) 73 (21.5) 23 (6.8) 52 (15.3) 8 (2.4) 339
***4 – How oten, during the last year, did you ind that you were not able to stop
drinking once you had started? 293 (86.4) 21 (6.2) 6 (1.8) 7 (2.1) 12 (3.5) 339
***5 – How oten, during the last year, did you fail to do what was normally expected
of you due to drinking? 325 (95.9) 10 (2.9) 2 (0.6) 1 (0.3) 1 (0.3) 339
***6 – How oten, during the last year, did you need a irst drink in the morning to get
yourself going ater a heavy drinking session? 333 (98.2) 3 (0.9) 1 (0.3) 2 (0.6) – 339
***7 – How oten, during the last year, did you have a feeling of guilt or remorse ater drinking? 291 (85.8) 30 (8.8) 5 (1.5) 4 (1.2) 9 (2.7) 339
***8 – How oten, during the last year, were you unable to remember what happened
the night before because of your drinking? 296 (87.3) 29 (8.6) 8 (2.4) 1 (0.3) 5 (1.5) 339
****9 – Have you or someone else been injured because of your drinking? 298 (87.9) – 35 (10.3) – 6 (1.8) 339
****10 – Has a relative, friend, doctor, or other health care worker been concerned
about your drinking or suggested you cut down? 287 (84.7) – 26 (7.7) – 26 (7.7) 339
Table 1. Distribution of the participants according to the answers to the alcohol use disorders identiication test. São Paulo, Brazil, 2011 – 2012.
*A: never; B: once per month or less; C: two to four times per month; D: two to three times per week; E: four or more times per week. **A: one or two “doses”; B: three or four “doses”; C: ive or six “doses”; D: seven to nine “doses”; E: ten or more “doses”. ***A: never; B: once per month or less; C: once per month; D: once per week; E: every day or almost every day. ****A: no; C: yes, but not in the last year; E: yes, during the last year.
Table 2. Distribution by point and 95% conidence interval of the participants according to the pattern of alcohol consumption. São Paulo, Brazil, 2011 – 2012.
*at‑risk drinking behavior
Category n % 95%CI
Abstinence 73 21.5 17.2 – 25.9
Moderate drinking 190 56.1 50.8 – 61.3
*Harmful drinking 58 17.1 13.1 – 21.1
*Hazardous risk 9 2.7 0.9 – 4.4
*Possible dependence 9 2.7 0.9 – 4.4
211
Variable At‑risk drinking Total χ2
Yates p‑value OR (95%CI)
Multiple logistic regression
Present Absent a = ‑2.78 (0.62)a,β (s.e.) p‑value OR (95%CI)
Gender
Male 73 200 273 13.20 < 0.001 7.42 (2.26 – 24.39)* β = 1.88 (0.62) 0.002 6.53 (1.95 – 21.87)
#Female 3 61 64
Do you work in the city you work in?
Yes 54 179 233 0.05 0.822 1.11 (0.63 – 1.95) – – –
#No 22 81 103
Children
Yes 55 198 253 0.22 0.639 0.83 (0.47 – 1.48) – – –
#No 21 63 84
Economic level *
A and B (BRL 2,654 to #9,263 or more) 62 222 284 0.31 0.580 0.78 (0.40 – 1.52) – – –
C (BRL 1,147 to 1,685) 14 39 53
Prison unit
PI 23 96 119 0.83 0.363 0.75 (0.43 – 1.29) – – –
#PII 53 165 218
What is your work shit?
Nocturnal 22 67 89 0.16 0.686 1.17 (0.66 – 2.07) ‑ ‑ ‑
#Diurnal 54 193 247
What is your workload?
12‑hour‑work/36‑hour‑rest (on call) 58 169 227 3.36 0.067 1.81 (0.99 – 3.30) – – –
#8 hours/day 17 90 107
Do you practice any religion?
Yes 24 148 172 13.10 < 0.001 0.36 (0.21 – 0.62)* β = ‑0.88 (0.29) 0.002 0.41 (0.23 – 0.72)
#No 50 111 161
Do you smoke?
Yes 27 42 69 12.48 < 0.001 2.87 (1.62 – 5.10)* β = 1.02 (0.31) < 0.001 2.78 (1.52 – 5.08)
#No 49 219 268
Do you practice physical activity?
Yes 39 137 176 0.02 0.960 0.95 (0.57 – 1.59) – – –
#No 37 124 161
Do you take or did you take medication due to your work?
Yes 23 103 126 1.75 0.185 0.67 (0.38 – 1.15) ‑ ‑ ‑
#No 53 158 211
#reference class;*statistical signiicant diferences for α = 0.05; †: BRL 2,654 = USD$ 1,153.41; BRL 9,263 = USD$ 4,025.64; BRL 1,147 = USD$ 498.48; BRL 1,685 = USD$ 732.29 –
Conversion rate of the Central Bank of Brazil, August 5th, 2013, at 2 pm
Items Factors
Answers
Total
0 1 2 3 4 5 6
n (%) n (%) n (%) n (%) n (%) n (%) n (%) n (%)
1… feel emotionally drained… EE 39 (11.6) 64 (19.0) 60 (17.9) 46 (13.7) 38 (11.3) 49 (14.6) 40 (11.9) 336
2… feel used up… EE 38 (11.3) 57 (17.0) 56 (16.7) 37 (11.0) 36 (10.7) 62 (18.5) 49 (14.6) 335
3…feel tired… EE 66 (19.6) 70 (20.8) 56 (16.7) 37 (11.0) 26 (7.7) 43 (12.8) 38 (11.3) 336
4…working is really a strain… EE 79 (23.5) 75 (22.3) 65 (19.3) 50 (14.9) 30 (8.9) 18 (5.4) 18 (5.4) 335
5…can solve problems… PE 8 (2.4) 14 (4.2) 22 (6.5) 48 (14.3) 83 (24.7) 96 (28.6) 65 (19.3) 336
6…feel burned out… EE 47 (14.0) 52 (15.5) 49 (14.6) 34 (10.1) 30 (8.9) 65 (19.3) 59 (17.6) 336
7…making efective contribution… PE 9 (2.7) 16 (4.8) 27 (8.0) 56 (16.7) 74 (22.0) 80 (23.8) 74 (22.0) 336
8…less interested… CY 88 (26.2) 59 (17.6) 62 (18.5) 48 (14.3) 27 (8.0) 25 (7.4) 27 (8.0) 336
9… less enthusiastic… CY 72 (21.4) 50 (14.9) 62 (18.5) 47 (14.0) 38 (11.3) 38 (11.3) 29 (8.6) 336
10…I am good at job… PE 4 (1.2) 9 (2.7) 11 (3.3) 36 (10.7) 45 (13.4) 113 (33.6) 118 (35.1) 336
11… feel exhilarated… PE 8 (2.4) 13 (3.9) 25 (7.4) 57 (17.0) 46 (13.7) 84 (25.0) 103 (30.7) 336
12… accomplished many worthwhile things… PE 38 (11.3) 44 (13.1) 49 (14.6) 38 (11.3) 33 (9.8) 72 (21.4) 62 (18.5) 336
13… to do my job and not be bothered… CY 24 (7.1) 12 (3.6) 18 (5.4) 28 (8.3) 22 (6.5) 64 (19.0) 168 (50.0) 336
14… work contributes anything CY 139 (41.4) 69 (20.5) 47 (14.0) 35 (10.4) 15 (4.5) 15 (4.5) 16 (4.8) 336
15… doubt the signiicance of my work CY 135 (40.2) 79 (23.5) 42 (12.5) 33 (9.8) 14 (4.2) 9 (2.7) 24 (7.1) 336
16… feel conident… PE 9 (2.7) 8 (2.4) 10 (3.0) 60 (17.9) 47 (14.0) 82 (24.4) 120 (35.7) 336
Table 4. Distribution of the participants’ answers to the Maslach Burnout Inventory – General Survey.São Paulo, Brazil, 2011 – 2012.
213
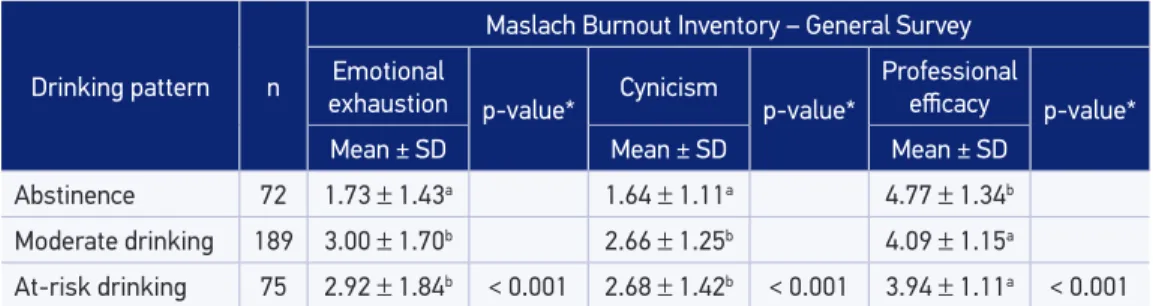
Table 5 presents the mean scores of exhaustion, cynicism and professional eicacy of the participants classiied according to the pattern of alcohol consumption (abstinence, mod‑ erate drinking, and at‑risk drinking).
We observed signiicantly higher mean scores (p < 0.001) of emotional exhaustion and cynicism, besides lower scores of professional eicacy among individuals who reported consuming alcoholic beverages as compared to the abstinent ones.
DISCUSSION
In this study, a 22.4% prevalence of an at‑risk drinking pattern among employees of both prisons was found, which was signiicantly associated with gender, smoking, and reli‑ gion practice. Individuals who reported consuming alcohol had higher mean scores of emotional exhaustion and cynicism, and lower ones of professional eicacy, compared to abstinent individuals.
The comparison between the prevalence of individuals consuming alcohol and those in an at‑risk drinking pattern seen in this sample with the literature was not easy given that diferent methodologies were used when researching alcohol use. Nevertheless, this study results are in line with the literature that reported using the same instrument (AUDIT). Our indings regarding the prevalence of at‑risk drinking pattern are in accordance with the results observed both in professionals of the public security area6 and in the general pop‑
ulation15,39. It is important to highlight that for the mentioned populations, including the
present study, this prevalence was high.
We can observe that the majority of participants completed items 4 to 10 pointing out to the lowest possible values (Table 1). Although the same pattern is noticed in the gen‑ eral population15, it is important to mention this can be due to the possible inluence of the
social desirability, as suggested in previous studies40. This efect may be increased because
data were collected in the employment context. Despite this bias, the instrument showed adequate it to the sample after reinement (removal of item 4), and the item exclusion did not afect the inal classiication of individuals as to the drinking behavior shown in Table 2.
Table 5. Mean scores of exhaustion, cynicism and professional eicacy of the participants classiied according to the pattern of alcohol consumption. São Paulo, Brazil, 2011 – 2012.
*ANOVA;Diferent letters indicate statistically signiicant diferences – Tukey’s test
Drinking pattern n
Maslach Burnout Inventory – General Survey
Emotional
exhaustion p‑value* Cynicism p‑value* Professional eicacy p‑value*
Mean ± SD Mean ± SD Mean ± SD
Abstinence 72 1.73 ± 1.43a 1.64 ± 1.11a 4.77 ± 1.34b
Moderate drinking 189 3.00 ± 1.70b 2.66 ± 1.25b 4.09 ± 1.15a
A greater chance of developing an at‑risk drinking behavior was observed in males (Table 3), which is consistent with what has been presented in the literature6,13‑15,39 and can
be justiied by biological, social, economic, and cultural premises17,41. The signiicant asso‑
ciation found between at‑risk drinking behavior and smoking had also been previously reported in the literature12,15,17‑19,39.
Religious practice as a protective factor in the consumption of alcoholic beverages (Table 3) had also been previously reported39. Moreira‑Almeida, Lotufo Neto and Koenig20
found an inverse relationship between alcoholism and religiosity in 80% of the 120 studies included in the literature review they performed.
As to data related to the component factors of the Burnout Syndrome (Table 5), our results corroborate those presented in the study conducted by Cullen et al.42, who
indicated that correctional institutions employees had high levels of job dissatisfaction and cynicism. Moreover, Lindsay6 observed increased rates of alcohol consumption
in police officers who had higher levels of stress and job dissatisfaction. Furthermore, authors such as Ahola et al.43, Chen and Cunradi44 and Cunradi, Chen and Lipton26
suggest that alcohol consumption may be a way of coping in face of the presence of Burnout Syndrome (emotional exhaustion, cynicism and professional efficacy). Gould et al.30 showed a positive and significant correlation between the use of dysfunctional
coping strategies and emotional exhaustion (r = 0.57, p < 0.001) and cynicism (r = 0.40, p < 0.01), besides a negative and significant correlation with efficacy (r = ‑0.31, p < 0.01) in correctional employees.
Despite being a cross‑sectional study, this investigation contributes for understanding how burnout can be associated with alcohol consumption on prison workers.
The results presented in this study aim at highlighting the need of attention regarding the impact that demographic and professional exhaustion characteristics may have on at‑risk drinking in correctional workers. We further suggest the development of prevention strat‑ egies to decrease the Burnout Syndrome and the consumption of alcoholic beverages in these workers. We hope this paper may further alert for the need for creating (educational/ preventive/corrective) proposals for the work context with the objective of preserving this population’s health. Hence, it important the participation of managers and health profes‑ sionals, namely psychologists, involved in this process.
CONCLUSION
215 1. Fernandes RC, Silvany Neto AM, Sena GM, Leal AS,
Carneiro CA, Costa FP. Trabalho e cárcere: um estudo com agentes penitenciários da região metropolitana de Salvador, Brasil. Cad Saúde Pública 2002; 18(3): 807‑16. 2. Güilgüiruca M, Herrera‑Bascur J. Occupational health in a Penitentiaty Center in Chile: a view from Human Resources policies. Rev Esp Sanid Penit 2015; 17: 12‑9. 3. Botha C, Pienaar J. South African correctional oicial occupational stress: the role of psychological strengths. J Crim Justice 2006; 34(1): 73‑84.
4. Xanthakis A. Levels of work‑stress and burnout among prison oicers. an examination of the need for a staf counselling service in a forensic setting. Counsell Psychol Rev 2009; 24(3): 100‑18.
5. Akbari J, Akbari R, Farasati F, Mahaki B. Job stress among Iranian prison employees. Int J Occup Environ Med 2014; 5: 208‑15.
6. Lindsay V. Police oicers and their alcohol consumption: should we be concerned? Police Quarterly 2008; 11(1): 74‑87.
7. Ballenger JF, Best SR, Metzler TJ, Wasserman DA, Mohr DC, Liberman A, et al. Patterns and predictors of alcohol use in male and female urban police oicers. Am J Addiction 2011; 20(1): 21‑9.
8. Smith DR. Alcohol and tobacco consumption among Australian police oicers: 1989 to 2005. Int J Police Sci Management 2007; 9(3): 274‑86.
9. Willman EA. Alcohol use among law enforcement. J Law Enforncement 2012; 2(3). Available from: http:// www.jghcs.info/index.php/l/article/view/150/146 (Acessado em 17 de dezembro de 2015).
10. Reichert FF, Lopes M, Loch MR, Romanzini M. Atividade física e outros aspectos relacionados à saúde de agentes penitenciários de Londrina‑PR. Rev Bras Ativ Fis Saude 2007; 12(3): 5‑11.
11. Richmond RL, Wodak A, Kehoe L, Heather N. How healthy are the police? A survey of life‑style factors. Addiction 1998; 93: 1729‑37.
12. Primo NL, Stein AT. Prevalência do abuso e da dependência de álcool em Rio Grande (RS): um estudo transversal de base populacional. Rev Psiquiatr 2004; 26(3): 280‑6.
13. Galduróz JC, Caetano R. Epidemiologia do uso de álcool no Brasil. Rev Bras Psiquiatr 2004; 26(Suppl I): 3‑6.
14. Ahnquist J, Lindstrom M, Wamala SP. Institutional trust and alcohol consumption in Sweden: the Swedish National Public Health Survey 2006. BMC Public Health 2008; 8: 283.
15. Reisdorfer E, Büchele F, Pires RO, Boing AF. Prevalence and associated factors with alcohol use disorders among adults: a population‑based study in southern Brazil. Rev Bras Epidemiol 2012; 15(3): 582‑94. 16. Costa JS, Silveira MF, Gazalle FK, Oliveira SS, Hallal
PC, Menezes AM, et al. Consumo abusivo de álcool e fatores associados: estudo de base populacional. Rev Saúde Pública 2004; 2(38): 284‑91.
17. Barros MB, Botega NJ, Dalgalorrondo P, Marin‑León L, Oliveira HB. Prevalence of alcohol abuse and associated factors in a population‑base study. Rev Saúde Pública 2007; 41(4): 502‑9.
18. Batel P, Pessione F, Maitre C, Ruef B. Relationship between alcohol and tobacco dependence among alcoholics who smoke. Addiction 1995; 90(7): 977‑80. 19. C h a i e b J A , C a s t e l l a r i n C . A s s o c i a ç ã o
tabagismo‑alcoolismo: introdução às grandes dependências humanas. Rev Saúde Pública 1998; 32(3): 246‑54.
20. Moreira‑Almeida A, Lotufo Neto F, Koenig HG. Religiousness and mental health: a review. Rev Bras Psiquiatr 2006; 28(3): 242‑50.
21. Hurst TE, Hurst MM. Gender diferences in mediation of severe occupational stress among correctional oicers. Am J Crim Justice 1997; 22(1): 121‑37. 22. Maslach C, Leiter MP. Stress and burnout: the critical
research. In: Cooper CL, editor. Handbook of stress medicine and health. 2. ed. Lancaster, UK: CRC Press; 2004. p. 155‑72.
23. Maslach C, Jackson SE. The measurement of experienced burnout. J Occup Behav 1981; 2(2): 99‑113. 24. Carlotto MS, Palazzo LS. Síndrome de Burnout e
fatores associados: um estudo epidemiológico com professores. Cad Saúde Pública 2006; 22: 1017‑26. 25. Ahola KL, Pulkki‑Raback L, Kouvonen A, Rossi H,
Aromaa A, Lonnqvist J. Burnout and behavior‑related health risk factors: results from the population‑based Finnish Health 2000 study. J Occup Environ Med 2012; 54(1): 17‑22.
26. Cunradi CB, Chen MJ, Lipton R. Association of occupational and substance use factors with burnout among urban transit operators. J Urban Health 2009; 86(4): 562‑70.
27. Cunradi CB, Greiner BA, Ragland DR, Fisher J. Alcohol, stress‑related factors, and short‑term absenteeism among urban transit operators J Urban Health 2005; 82(1): 43‑57.
28. Frone MR. Work stress and alcohol use. Alcohol Res Health 1999; 23(4): 284‑91.
29. Rojas FJ, Chavarria EM, Valverde RP. Condiciones asociadas a los patrones de consumo de sustancias psicoactivas y el rol que juega la estructura organizacional penitenciaria en el personal de seguridad del sistema penitenciario nacional. Costa Rica: Instituto sobre Alcoholismo y Farmacodependencia; 2009. 30. Gould DD, Watson SL, Price SR, Valliant PM. The
relationship between burnout and coping in adult and young ofender center correctional oicers: an exploratory investigation. Psychol Serv 2013; 10(1): 37‑47. 31. Associação Brasileira de Empresas de Pesquisa. Critério
de Classificação Econômica Brasil – 2013. 2013. Available from: http://www.abep.org/novo/Content. aspx?ContentID=835 (Acessado em março de 2013). 32. Mendéz EB. Uma versão brasileira do AUDIT (Alcohol
Use Disorders Identiication Test). Pelotas: Faculdade de Medicina, Universidade Federal de Pelotas; 1999. 33. Babor TF, Higgins‑Biddle JC, Saunders JB, Monteiro
MG. AUDIT – The alcohol use disorders identiication test. 2. ed. Geneva: World Health Organization; 2001. 34. Papp H. Adaptação para o português do Maslach
Burnout Inventory – general survey. Itajaí, SC: Universidade do Vale do Itajaí; 2007. 40p.
35. Maroco J. Análise de equações estruturais. Lisboa: ReportNumber; 2010. 374p.
36. Kline RB. Principles and practice of structural equation modeling. New York: The Guilford Press; 1998. 354p. 37. Fornell C, Larcker DF. Evaluating structural equation models with unobservable variables and measurement error. J Marketing Res 1981; 18(1): 39‑50.
38. Maroco J, Garcia‑Marques T. Qual a iabilidade do alfa de Cronbach? Questões antigas e soluções modernas? Laboratório Psicol 2006; 4(1): 65‑90.
39. Ferreira LN, Bispo‑Júnior JP, Sales ZN, Casotti CA, Braga‑Júnior AC. Prevalência e fatores associados ao consumo abusivo e à dependência de álcool. Cienc Saude Colet 2013; 18(11): 3409‑18.
40. Davis CG, Thake J, Vilhena N. Social desirability biases in self‑reported alcohol consumption and harms. Addict Behav 2010; 35(4): 302‑11.
41. Almeida LM, Coutinho ES. Prevalência de consumo de bebidas alcoólicas e de alcoolismo em uma região metropolitana do Brasil. Rev Saúde Pública 1993; 27(1): 23‑9.
42. Cullen FT, Link BG, Wolfe NT, Frank J. The social dimensions of correctional officer stress. Justice Quarterly 1985; 2(4): 505‑33.
43. Ahola K, Honkonen T, Pirkola S, Isometsa E, Kalimo R, Nykyri E, et al. Alcohol dependence in relation to burnout among the innish working population. Addiction 2006; 101(10): 1438‑43.
44. Chen MJ, Cunradi C. Job stress, burnout and substance use among urban transit operators: the potential mediating role of coping behavior. Work Stress 2008; 22(4): 327‑40.
Received on: 08/07/2015