ABSTRACT:Objective: To study the relationship between the risk of dengue and sociodemographic variables through the use of spatial regression models fully Bayesian in the municipalities of Espírito Santo in 2010.
Method: This is an ecological study and exploration that used spatial analysis tools in preparing thematic maps with data obtained from SinanNet. An analysis by area, taking as unit the municipalities of the state, was performed. Thematic maps were constructed by the computer program R 2.15.00 and Deviance Information Criterion (DIC), calculated in WinBugs, Absolut and Normalized Mean Error (NMAE) were the criteria used to compare the models. Results: We were able to geocode 21,933 dengue cases (rate of 623.99 cases per 100 thousand habitants) with a higher incidence in the municipalities of Vitória, Serra and Colatina; model with spatial efect with the covariates trash and income showed the best performance at DIC and Nmae criteria.
Conclusion: It was possible to identify the relationship of dengue with factors outside the health sector and to identify areas with higher risk of disease.
Keywords: Epidemiology and Biostatistics. Dengue. Linear models. Social determinants of health. Spatial analysis. Bayesian Inference.
Spatial analysis of distribution of dengue
cases in Espírito Santo, Brazil, in 2010: use of
Bayesian model
Análise espacial do risco de dengue no Espírito Santo, Brasil, 2010: uso de
modelagem completamente Bayesiana
Taizi HonoratoI, Priscila Pagung de Aquino LapaI, Carolina Maia Martins SalesII,
Barbara Reis-SantosIII, Ricardo Tristão-SáIV, Adelmo Inácio BertoldeV, Ethel Leonor Noia MacielVI
ISchool of Statistics, Universidade Federal do Espírito Santo – Vitória (ES), Brazil. IISchool of Nursing, Universidade Federal do Espírito Santo – Vitória (ES), Brazil.
IIICenter for Infectious Diseases, Universidade Federal do Espírito Santo – Vitória (ES); Universidade Federal de Pelotas – Pelotas
(RS), Brazil.
IVSchool of Medicine of Santa Casa de Misericórdia – Santa Luíza (ES), Brazil. VCenter for Exact Sciences, Universidade Federal do Espírito Santo – Vitória (ES), Brazil. VIGraduate Program in Public Health, Universidade Federal do Espírito Santo – Vitória (ES), Brazil.
Corresponding author: Adelmo Inácio Bertolde. Universidade Federal do Espírito Santo, Centro de Ciências Exatas, Departamento de Estatística. Avenida Fernando Ferrari, s/n, Goiabeiras, CEP: 29060-090, Vitória, ES, Brasil. E-mail: [email protected] Conlict of interests: nothing to declare – Financing source: none.
RESUMO:Objetivo: Estudar a relação entre o risco de dengue e as variáveis sociodemográicas através da utilização de modelos de regressão espacial completamente Bayesianos nos municípios do Estado do Espírito Santo no ano de 2010. Métodos: Trata-se de um estudo ecológico e exploratório que utiliza as ferramentas de análise espacial na elaboração de mapas temáticos, com dados obtidos do SinanNet. Foi feita uma análise por área, tomando-se como unidade os municípios do Estado. Os mapas temáticos foram construídos pelo programa computacional R 2.15.00 e o Deviance Information Criterion (DIC), calculado no WinBugs, e o Normalized Mean ABsolut Error (NMAE) foram os critérios utilizados para a comparação dos modelos. Resultados: Foram georreferenciados 21.933 casos de dengue (taxa de 623,99 casos/100 mil habitantes) com maior incidência nos municípios de Vitória, Serra e Colatina; o modelo com efeito espacial, com as covariáveis lixo e renda foi o que apresentou melhor desempenho, segundo os critérios DIC e NMAE. Conclusão: Foi possível identiicar a relação do dengue com fatores externos ao setor saúde e identiicar locais com maior risco da doença.
Palavras-chave: Epidemiologia e Bioestatística. Dengue. Modelos lineares. Determinantes sociais da saúde. Análise espacial. Inferência Bayesiana.
INTRODUCTION
Dengue is an infectious disease caused by an arbovirus — the dengue virus (DENV) — with four known serotypes. It mainly afects tropical developing countries, where sociocultural conditions favor the spread of the disease and the proliferation of its main vector, the female mosquito Aedes aegypti1.
For its endemic and epidemic character of great magnitude, it has an important social and economic impact, since a significant proportion of affected individuals are of working age2.
Several strategies for more efective approaches to disease control have been adopted in Brazil1. The training of health professionals and the structuring of services appropriate to
the care of individuals with dengue are examples of important measures to reduce mortality from this condition. However, the primary means of control of a dengue epidemic is the control of its vector, especially in places where there are more cases reported.
In Brazil, since 1975, dengue is a disease with mandatory reporting, which is obligatory for all health professionals, as well as to those responsible for public and private health and education organizations and facilities3.
analysis and Geographic Information Systems (GIS) is considered an important tool in mapping the risk of dengue5-7.
Previous studies8,9 have postulated that the emergence of large urban areas with inadequate
housing, water supply and garbage collection are important social determinants for the increased risk of incidence and maintenance of the number of dengue cases.
Recently, the fully Bayesian approach model is proposed as an alternative to the traditional models for the study of spatial analysis of diseases. The advantage of this model was the assumption that the Bayesian modeling could minimize the variance of the estimators, especially in places where the population is small10.
In this approach, variables that aim to capture inluences of factors speciic to the areas are introduced, as well as the dependency between these areas, thereby generating more accurate estimates of associations between disease incidence and factors related to the areas under investigation.
Thus, in studies on social determinants of health, where heterogeneity is large, understanding if the variability that occurs in the data analysis is due to random luctuations or spatial efect itself is of utmost importance10,11.
Given the above, this study aimed to investigate the relationship between the risk of dengue and sociodemographic variables through the use of fully Bayesian spatial regression models in the municipalities in the state of Espírito Santo in 2010.
METHODOLOGY
DATA UTILIZED
An ecological study of the spatial distribution of reported cases of dengue in the state of Espírito Santo in 2010, according to the municipality of residence, was conducted. Data regarding the disease were obtained from the Ministry of Health through the Department of Technology of Uniied Health System (DATASUS)12,and the cartographic database was
obtained from the website of the Jones dos Santos Neves Institute (IJSN)13.
The data on the covariates considered were obtained from the Brazilian Institute of Geography and Statistics (IBGE) based on the results of the Demographic Census of 201014.
STATISTICAL ANALYSIS
The data used in the study were aggregated by municipality. On the map, each area (municipality) is shaded according to the respective risk values. One way to do this is through gross rates, given by: GRi = popi
casesi(1,000), where cases
of cases and the population of municipality i, respectively. However, these gross rates have high instability when associated with small populations.
Regarding the proposal of a model that better estimates the risk of dengue, the methodology of a fully Bayesian hierarchical model was applied. Based on this methodology, covariates were incorporated into the model in order to ind factors that contribute to the occurrence of the event. In this proposed modeling structure, the inclusion of random variables that relect any local (θi) and spatial (ϕi) efects, aiming to ind better risk estimates for each municipality.
Although no consensus exists on what factors really inluence the increase or decrease in the risk of dengue in a given area or region4, based on the variables provided by the 2010
census, we opted to use the following covariates: literacy (proportion of illiterate individuals above 15 years of age); water (ratio of permanent private households whose form of water supply does not occur by the general water supply network); garbage (proportion of permanent private households where garbage is burned, buried, thrown in a vacant lot or on the street, river, lake, sea, or other destination); and income (proportion of people aged 10 years or more of age and monthly income of less than three minimum wages).
In this model, dengue was considered the response variable, with the following factors being evaluated in the fully Bayesian regression model: the spatial efect and the covariates garbage, water and literacy (including in isolation and combined).
We irst consider Yi as the number of dengue cases in municipality i, i = 1,2,...,78, where
Yi has binomial distribution. However, in epidemiological studies, the binomial model can be approximated by distribution11.
The Bayesian spatial hierarchical model11 has three levels of hierarchy. The irst is given
basically by:
Yi | Ѱ, Ei~Poisson(µi = EiѰi ), i = 1,2,...,78
Where Ѱi and Ei are, respectively, the relative risk of dengue and the expected number of dengue cases in municipality i. The calculation performed to obtain the expected number of dengue cases in each county number was given by:
Ei = Σyi (pop i),
Σpopi i = 1,2,...,78
It should be noted that it is not always easy to obtain mathematical solutions to calculate the risk of dengue in each municipality; thus, the natural logarithm of the risks considered was Ѱi :
Where Ѱi, as mentioned before, is the risk in municipality i, α0 is the model intercept,
α = (α1,α2, ... , αp) represents the coeicients of the covariates, θi is the speciic random efect for each municipality, and ϕi is the spatial efect of neighboring municipalities.
The spatial efect ϕi, as can be seen, takes into account the spatial dependence among risks. The Bayesian approach considers each parameter as a random variable, and this is the second level of hierarchy, where distributions are speciied a priori for each one with the objective of obtaining the a posteriori distribution of risks (where risk estimates are obtained). Thus, it is assumed that α has normal distribution with mean equal to 0 and covariance matrix Σ
= Iσα2 , where σα2 = 1,00012. The random efect θ
i is speciied as follows: θi~N (0,τθ). And
ϕi has conditional auto regressive (CAR) a priori distribution, which also depends on a τϕ
parameters. Both τθ and τϕ are called hyperparameters, because they are a priori parameters. The third level is the speciication of a priori distributions for each hyperparameter, called
hiperprioris: τθ~Gamma (0,5; 0,005) and τϕ~Gamma (0,5; 0,005), which are uninformative distributions.
The neighborhood structure adopted in this article is called binary neighborhood, which takes into account the fact of one municipality bordering another.
The criterion for selecting the best model adopted is known as deviance information criterion (DIC)11 and, based on that information, the model with the lowest DIC was
selected as the model that best estimates the risk of dengue. After the comparison of models with best fit from the DIC, the middle normalized absolute error (NMAE) was calculated for the three models with lower DICs, thus providing another indicator of adjustment.
The trajectory of three chains was considered, starting from diferent initial values, and only one value in every 100 values generated was included in the a posteriori sample. The convergence was analyzed by the method of Gelman and Rubin15. To ensure convergence,
250,000 interactions were generated, disregarding the irst 50,000.
The whole inferential process was based on computational methods for Monte Carlo Markov chain (MCMC) in WinBugs software, version 1.4. While for statistical analysis and risk mapping, we used the R software, version 2.15.0.
RESULTS
The State of Espírito Santo, according to the 2010 Census, has 78 municipalities, 3,514,952 inhabitants and an area of 46,095.583 km2, which represents a population
density of 76.25 inhabitants/km2.
Table 1 shows the correlation matrix between the variables, and a strong association between the covariates water and garbage can be observed. Therefore, the combination of these covariates between the proposed models was not considered.
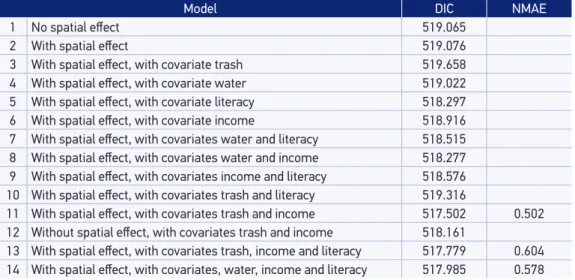
Thus, in the regression model, 14 models were evaluated with their respective values of DIC and NMAE (Table 2): (1) no spatial effect, (2) with spatial effect, (3) with spatial effect, with covariate trash (4) with spatial effect, with covariate water, (5) with spatial effect, with covariate literacy, (6) with spatial effect, with covariate income, (7) with spatial effect, with covariates water and literacy (8) with spatial effect, with covariates water and income, (9) with spatial effect, with covariates income and literacy (10) with spatial effect, with covariates trash and literacy (11) with spatial effect, with covariates trash and income (12) without spatial effect, with covariates trash and income (13) with spatial effect, with covariates trash, income and literacy, and (14) with spatial effect, with covariates, water, income and literacy.
Among the 14 models proposed, model 11 showed the smallest value of DIC (517.504). In this model, the spatial efect and the presence of covariates garbage and income were observed. The second best model was model 13, with spatial efect and composed by the
Table 1. Matrix of correlations between the covariates included in the spatial regression model for dengue in Espírito Santo, 2010.
Income Literacy Water Garbage
Income 1
Literacy 0.418 1
Water 0.646 0.447 1
Garbage 0.550 0.642 0.808 1
Table 2. Results of deviance information criterion and normalized mean absolute error of the spatial regression models for dengue in Espírito Santo, 2010.
Model DIC NMAE
1 No spatial efect 519.065
2 With spatial efect 519.076
3 With spatial efect, with covariate trash 519.658
4 With spatial efect, with covariate water 519.022 5 With spatial efect, with covariate literacy 518.297 6 With spatial efect, with covariate income 518.916 7 With spatial efect, with covariates water and literacy 518.515 8 With spatial efect, with covariates water and income 518.277 9 With spatial efect, with covariates income and literacy 518.576 10 With spatial efect, with covariates trash and literacy 519.316
11 With spatial efect, with covariates trash and income 517.502 0.502
12 Without spatial efect, with covariates trash and income 518.161
13 With spatial efect, with covariates trash, income and literacy 517.779 0.604
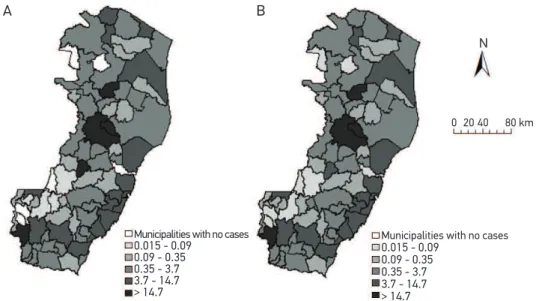
Figure 1. (A) Map of the gross rate of dengue and (B) map from the fully Bayesian model estimates with spatial efect and covariates garbage and income for Espírito Santo in 2010.
Municipalities with no cases
0.015 - 0.09 0.09 - 0.35 0.35 - 3.7 3.7 - 14.7 > 14.7
Municipalities with no cases
0.015 - 0.09 0.09 - 0.35 0.35 - 3.7 3.7 - 14.7 > 14.7
0 20 40 80 km
A B
N
covariates garbage, income and literacy. Following that, model 14, with spatial efect and composed by the covariates water, income and literacy. Then, the inclusion of the efect of the combination of variables garbage and income to model 11 has been evaluated; however, there was no improvement in the adjustment (DIC = 518.220).
The NMAE was calculated for these three models (11, 13 and 14), and model 11 was also the one with the lowest NMAE value, being, therefore, the model that best explains the risk of dengue.
The number of dengue cases estimated from the selected model (model 11) is given by:
Yi~Poisson(µi = EiѰi )
log (Ѱi) = –41.9 + 0.2486 (garbage) + 0.4983 (income) + θi + ϕi
µi = Eiexp(log(Ѱi)) = Ei + exp (–41.9 + 0.2486 (garbage) + 0.4983 (income) + θi + ϕi)
rate image. Also with respect to the model found, which shows the signiicance of speciic efects of the municipalities, as well as neighborhood efects, it can be concluded that the inclusion of these contributed to the correction of overdispersion and underdispersion of the Poisson model, allowing, from the results, a better assessment of the incidence of dengue correlated with characteristics of each municipality and its surroundings.
DISCUSSION
In 2010, dengue was distributed spatially in the state of Espírito Santo in a non-homogeneous manner, with a higher prevalence of cases in the capital, Vitória, and in the municipalities of Serra and Colatina. In the municipalities of Águia Branca, Brejetuba, Divino de São Lourenço, Fundão Ibitirama and Vila Pavão, no cases were notiied. In the fully Bayesian approach, it was observed that the covariates garbage and income were the best to estimate the risk of dengue in the state in 2010.
Some limitations, however, should be mentioned. First, the inclusion of data only from 2010 could result in a reporting bias for the luctuation of disease incidence. The previous assessment shows that, in Espírito Santo, incidences of 740.06 and 952.84 per hundred thousand inhabitants in 2008 and 2009, respectively, were higher than in 2010 (623.99/100,000). It is also important to emphasize that the use of a set of data for a single year does not impose obstacles to the implementation of the modeling proposed here, considering the information available in the year of the census in the country. Another limitation would be underreporting, arising mainly from private services, already reported in other studies16,17. This underreporting may interfere with covariates found in the model
studied (proper garbage collection and income), as populations insured by private plans have diferent socioeconomic conditions than those assisted by the public health system. Another issue was the choice of the covariates included in the model. Given the availability, only socioeconomic variables contained in the census of 2010 were included in this study; therefore, covariates that might be associated with the risk of dengue, but which were not part of this database, cannot be analyzed.
Our inding of a higher incidence of dengue in areas with high population density agrees with the results of other studies18,19. This association has been explained by social inequality
in these urban centers, with varying socioeconomic strata20,21.
There are several indicators of socioeconomic conditions that can afect health. In this study, the covariates that best explained the risk of dengue were inadequate destination of the garbage and monthly income below three minimum wages, corroborating other studies8,22. In São José do Rio Preto (SP), dengue was related to inadequate garbage collection
and lack of sewage system8. In Porto Alegre (RS), the variable income was the only one
that satisfactorily explained the spatial distribution of the disease22. On the other hand, in
1. Brasil. Ministério da Saúde. Secretaria de Vigilância em Saúde. Guia de Vigilância Epidemiológica. 6ª edição. Brasília: Ministério da Saúde; 2005. p. 231-53
2. World Health Organization. Dengue: guidelines for diagnosis, treatment, prevention and control. Geneva: WHO Library Cataloguing-in-Publication Data; 2009.
3. Brasil. Lei nº 6.259, de 30 de outubro de 1975. Dispõe sobre a organização das ações de Vigilância Epidemiológica, sobre o Programa Nacional de Imunizações, estabelece normas relativas à notiicação compulsória de doenças, e dá outras providências. Brasília, 30 de outubro de 1975, 154º da Independência e 87º da República.
REFERENCES
living conditions studied (garbage collection, literacy, income, population density etc.) and the risk of dengue23.
Regarding the application of the fully Bayesian model, we emphasize the homogenization of rates between neighboring municipalities in relation to the gross ratio, which facilitates the understanding of the spatial pattern of dengue in the state, because it reduces random noise, especially in municipalities with small populations, as is the case of the municipalities of Espírito Santo10. Thus, the method allowed the identiication of municipalities with more
priority for control and, therefore, it would have a potential for improved surveillance. The results of this study and the aforementioned studies seem to reinforce the thesis that social inequalities are related to the risk of dengue in urban areas.
Recently, diferent initiatives and control programs have sought alternatives for dengue prevention and health promotion through community mobilization and public intervention in areas of diicult access for garbage collection and vector surveillance. Although such interventions do not target signiicantly the social structure that generates socioeconomic inequalities, they have the potential to reduce current rates of disease by acting mainly on vector control, which could minimize the risks for groups more vulnerable to disease.
CONCLUSION
4. Carvalho MS, Santos RS. Análise de dados espaciais em saúde pública: métodos, problemas, perspectivas. Cad Saúde Pública 2005; 21(2): 361-78.
5. Ferreira GS. Análise espaço-temporal da distribuição dos casos de dengue na cidade do Rio de Janeiro no período de 1986 a 2002 [dissertação de mestrado]. Rio de Janeiro: Universidade Federal do Rio de Janeiro; 2004.
6. Barcellos C, Pustai AK, Weber MA, Brito MRV. Identificação de locais com potencial de transmissão de dengue em Porto Alegre através da técnica de geoprocessamento. Rev Soc Bras Med Trop 2005; 38(3): 246-50.
7. Flauzino RF, Souza-Santos R, Oliveira RM. Dengue, geoprocessamento e indicadores socioeconômicos e ambientais: um estudo de revisão. Rev Panam Salud Publica 2009; 25(5): 456-61.
8. Costa AIP, Natal D. Distribuição espacial da dengue e determinantes socioeconômicos em localidade urbana no Sudeste do Brasil. Rev Saúde Pública 1998; 32(3): 232-6.
9. Machado JP, Oliveira RM, Souza-Santos R. Análise espacial da ocorrência de dengue e condições de vida na cidade de Nova Iguaçu, Estado do Rio de Janeiro, Brasil. Cad Saúde Pública 2009; 25(5): 1025-34.
10. Marshall RJ. Mapping disease and mortality rates using empirical Bayes estimators. J R Stat Soc Ser C Appl Stat 1991; 40(2): 283-94.
11. Spiegelhalter DJ, Best NG, Carlin BP, Linde A. Bayesian measures of model complexity an it. J R Stat Soc Ser B 2002; 64(4): 583-639.
12. Epidemiológicos e morbidade. Disponível em: http://datasus.saude.gov.br/informacoes-de-saude. (Acessado em 21 agosto de 2012).
13. Bases Geográicas. Disponível em: http://www.ijsn. es.gov.br/Sitio/#. (Acessado em 21 de agosto de 2012).
14. Instituto Brasileiro de Geograia e Estatística. Censo 2010. Disponível em: http://www.censo2010.ibge. gov.br. (Acessado em 21 de agosto de 2012).
15. Gelman A, Rubin D. Inference from iterative simulation using multiple sequences. Statistical Science 1992; 7(4): 457-511.
16. Teurlai M, Huy R, Cazelles B, Duboz R, Baerh C, Vong S. Can human movements explain heterogeneous propagation of dengue fever in Cambodia? Plos Negl Trop Dis 2012; 6(12): e1957.
17. Gomes AF, Nobre AA, Cruz OG. Temporal analysis of the relationship between dengue and meteorological variables in the city of Rio de Janeiro, Brazil, 2001-2009. Cad Saúde Pública 2012; 28(11): 2189-97.
18. Hu W, Clements A, Williams G, Tong S, Mengersen K. Spatial patterns and socioecological drivers of dengue fever transmission in Queensland, Australia. Environ Health Perspect 2012; 120(2): 260-6.
19. Schmidt WP, Suzuki M, Thiem VD, White RG, Tsuzuki A, Yoshida LM et al. Population density, water supply, and the risk of dengue fever in Vietnam: cohort study and spatial analysis. PLoS Med 2011; 8(8): e1001082.
20. Flauzino RF, Souza-Santos R, Oliveira RM. Dengue, geoprocessamento e indicadores socioeconômicos e ambientais: um estudo de revisão. Rev Panam Salud Publica 2009; 25(5): 456-61.
21. Carvalho RM, Nascimento LF. Spatial distribution of dengue in the city of Cruzeiro, São Paulo State, Brazil: use of geoprocessing tools. Rev Inst Med Trop São Paulo 2012; 54(5): 261-6.
22. Barcellos C, Pustai AK, Weber MA, Brito MRV. Identiicação de locais com potencial de transmissão de dengue em Porto Alegre através de técnicas de geoprocessamento. Rev Soc Bras Med Trop 2005; 38(3): 246-50.
23. Machado JP, Oliveira RM, Souza-Santos R. Análise espacial da ocorrência de dengue e condições de vida na cidade de Nova Iguaçu, Estado do Rio de Janeiro, Brasil. Cad Saúde Pública 2009; 25(5): 1025-34.
Received on: 05/16/2012