Signs in neuroradiology – Part 2
*
Sinais em neurorradiologia – Parte 2
Filipe Ramos Barra1, Fabrício Guimarães Gonçalves2, Valter de Lima Matos3, Cássio Lemos Jovem1, José Luis Furtado de Mendonça4, Lázaro Luís Faria do Amaral5, Raquel delCarpio-O’Donovan6
The use of signs for interpretation of images in neuroradiology is extremely useful. Some signs are quite specific and, in some cases, pathognomonic. In this second part of their essay, the authors describe 15 additional neuroradiological signs. Main characteristics of imaging findings will be approached and the significance of their role in the clinical practice will be discussed.
Keywords: Radiological signs; Neuroradiology; Computed tomography; Magnetic resonance imaging.
O uso de sinais na interpretação de imagens na neurorradiologia é extremamente útil. Muitos sinais são bastante específicos e em alguns casos, patognomônicos. Nesta segunda parte os autores descreverão 15 sinais neurorradio-lógicos adicionais. Serão novamente abordadas as principais características de imagem de cada um e sua importân-cia na prática clínica.
Unitermos: Sinais radiológicos; Neurorradiologia; Tomografia computadorizada; Imagem por ressonância magnética. Abstract
Resumo
* Study developed at Montreal General Hospital, McGill Uni-versity Health Centre (MUHC), Montreal, Quebec, Canada.
1. MD, Resident in Radiology and Imaging Diagnosis at Hos-pital Universitário de Brasília, Brasília, DF, Brazil.
2. Titular Member of Colégio Brasileiro de Radiologia e Diagnóstico por Imagem (CBR), Fellow in Clinical Neuroradiology at the Montreal General Hospital, McGill University Health Cen-tre (MUHC), MonCen-treal, Quebec, Canada.
3. MD, Neuroradiologist at Hospital Universitário de Brasília and Hospital Santa Luzia, Brasília, DF, Brazil.
4. MD, Neuroradiologist at Hospital de Base do Distrito Fede-ral, Brasília, DF, Brazil.
5. MD, Neuroradiologist, Head of the Department of Neuroradiology at Medimagem – Hospital da Beneficência Portuguesa de São Paulo and Hospital Santa Catarina, São Paulo, SP, Brazil.
6. MD, Neuroradiologist, Professor of Radiology, Director of the Neuroradiology Fellowship Program, McGill University Health Centre (MUHC), Montreal, Quebec, Canada.
Mailing Address: Dr. Fabrício Guimarães Gonçalves. Depart-ment of Diagnostic Radiology, Montreal General Hospital. 1650 Cedar Avenue. Montreal, Quebec, Canada H3G 1A4. E-mail: gonç[email protected]
Received April 17, 2010. Accepted after revision October 14, 2010.
Barra FR, Gonçalves FG, Matos VL, Jovem CL, Mendonça JLF, Amaral LLF, delCarpio-O’Donovan R. Signs in neuroradiology – Part 2. Radiol Bras. 2011 Mar/Abr;44(2):129–133.
“High heel foot print sign” in the skull base
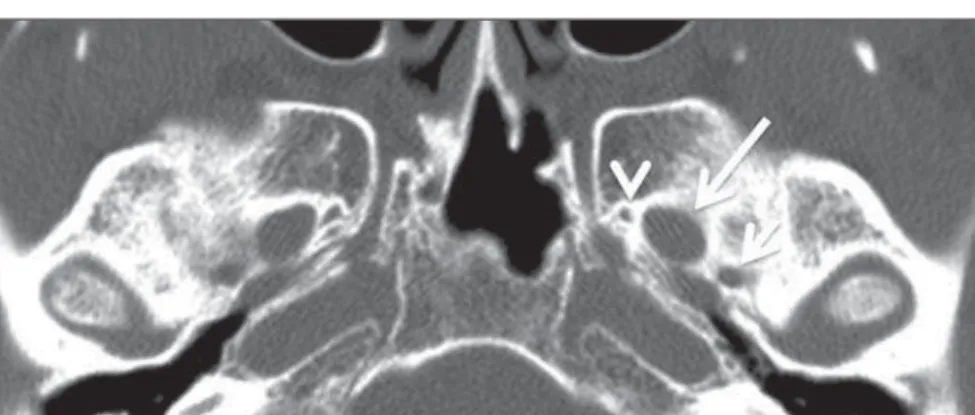
The high heel foot print sign (Figure 1) is useful in the understanding of the intri-cate anatomy of the skull base and repre-sent two relevant foramina. The anterior aspect of the high heel footprint represents the foramen ovale (FO), and the posterior aspect (the heel itself) the foramen spi-nosum (FS). The mandibular nerve, one of the three branches of the trigeminal nerve, is the main FO component(1). Also, the otic
Figure 1. Axial CT image demonstrating normal appearance of the skull base. The high heel foot print sign is evidenced. The small arrow indicates the foramen spinosum, and the large arrow, the foramen ovale. Anteriorly to the high heel footprint is the Vesalius foramen (venous foramen) (arrowhead).
Figure 2. Axial US image of an 18-week-old fetus with spina bifida, at the level of the choroid plexus showing the characteristic lemon sign, secondary to changes in the normal configuration of the fron-tal bone.
ganglion, the accessory meningeal artery, the lesser petrosal nerve and the emissary veins are found in this foramen. The middle meningeal artery is in the FS(2), and the absence of such artery is related to the per-sistent stapedial artery(3).
“Lemon sign” in spina bifida
dys-intracranial pressure .
“Banana sign” in Arnold-Chiari II malformation
The banana sign (Figure 3) is found in cases of defective neural tube, particularly in Arnold-Chiari II malformation. In such cases, the posterior fossa is small, and the cisterna magna loses its typical configura-tion. There is herniation of the brainstem and cerebellar tonsils through the foramen magnum, with the cerebellum surrounding the brainstem with a curved shape of a ba-nana(7,8). The specificity and sensitivity of this sign vary according to the familial risk, the studied population and the operator’s ability, being positive in up to 69% of cases of Chiari II(5).
Figure 3. Ultrasonography image acquired at the second gestational trimester, at the level of the pos-terior fossa. Observe the abnormal appearance of the cerebellum, surrounding the brainstem, and taking the curved shape of a banana (the banana sign).
Figure 4. Axial T1-weighted image at the level of the superior cerebellar peduncles in a patient with Joubert syndrome demonstrating the molar tooth sign.
Figure 6. Axial T2-weighted image acquired at the level of the oropharynx of a 48-year-old patient. Observe a large paraganglioma located in the ca-rotid space on the left (arrow), demonstrating the typical “salt and pepper” sign.
ral tail sign (arrow) is visualized in association with a small parasagittal parietal meningioma at left.
normal superior cerebellar peduncles de-cussation is absent and these become thick-ened and with a more horizontal course as they extend perpendicularly from the brainstem(9). Joubert syndrome is an auto-somal recessive disease characterized by abnormal eye movements, nystagmus, dif-ficulty in following a moving object with eyes, episodes of taquipneia and apnea, besides motor developmental delay(10).
“Dural tail sign” in meningiomas
Dural tail corresponds to a thickened and abnormally enhancing segment of dura mater adjacent to a lesion whose shape is similar to a tail (Figure 5). Dural tail signs, which had been described as highly spe-cific for meningiomas, can also be seen in other pathologies such as extra- and intra-axial tumors. It may correspond to isolated vascular changes, tumor invasion, adjacent non-continuous tumor growth, and tumor-like micronodules. The dural tail sign is poorly specific for meningiomas, but pre-sents good sensitivity, ranging from 50% and 80%(11,12).
“Salt and pepper sign” in paraganglioma
The appearance of salt and pepper (Fig-ure 6) is a highly sensitive and specific sign for head and neck paragangliomas. On T2-weighted images, the salt-like appearance can be explained by the tumor matrix that appears hyperintense due to the presence of slow intratumor flow and hemorrhage and, on post-contrast T1-weighted images, by
the presence of avid enhancement. The pepper-like appearance, can be explained in both on T1- and T2-weighted images by the presence of flow-voids of small vessels within these masses(13).
“Pancake brain sign” in alobar holoprosencephaly
Pancake brain sign (Figure 7) represents the appearance of the cerebral parenchyma in case of alobar holoprosencephaly(14). Holoprosencephaly is a malformation caused by a prosencephalic cleavage de-fect. Basically, holoprosencephalies are categorized into three major groups as fol-lows: lobar holoprosencephaly, semilobar holoprosencephaly and alobar holoprosen-cephaly. Alobar holoprosencephaly is the most severe form of this malformation and
“Molar tooth sign” in Joubert syndrome
presents a single ventricular cavity, fusion of frontal lobes, corpus callosum dysgen-esis, alteration of the third ventricle, olfac-tory bulb and tracts, absence of interhemi-spheric fissure, besides fused thalami and basal ganglia(15,16).
“Hot cross bun sign” in C-type multiple systems atrophy
The hot cross bun sign (Figure 8) can be observed in multiple systems atrophy type C. Such sign is characterized by a cruci-form pontine hyperintensity due to selec-tive loss of neurons of the transverse pon-tocerebellar fibers, with preservation of the pontine tegumentum and of the fibers of the corticospinal tract. Multiple systems atrophy is a neurodegenerative disorder with varying degrees of involvement of the basal ganglia and the olivopontocerebellar complex(17,18).
“Figure eight sign” in lissencephaly
Lissencephalies represent a group of disorders caused by defective neuronal mi-gration in the period between the 8th and 14th gestational weeks, resulting in lack of development of gyri and sulci. Lissen-cephalies are classified into complete (type I – agyria) or incomplete (type II – agyria-pachygyria). In lissencephaly type I, Sylvian fissures are shallow and verti-calized and the brain takes a figure eight
culation, which regresses at birth. In the posterior form of PHPV (the most com-mon) a connective fibrovascular tissue is seen attached to the lens, connecting later-ally to abnormlater-ally elongated ciliary pro-cess. At MRI a retrolental soft tissue and vascular mass is observed in association with a central, low-signal linear image cor-responding to the remnant hyaloid vascu-Figure 7. A neonate TC image demonstrating
typi-cal findings of alobar holoprosencephaly. Note the single ventricular cavity, the absence of the corpus callosum, the third ventricle, the interhemispheric fissure and of the tentorium, besides the fused thalami and basal ganglia. The pancake brain sign is related to an extreme anomaly of prosencepha-lon cleavage, with fused frontal lobes anteriorly to a dorsal cyst that is another typical abnormality.
Figure 8. Axial T2-weighted image acquired at the level of the middle cerebellar peduncles in a 59-year-old female patient with multiple systems at-rophy type C. The hot cross bun sign is character-ized by cruciform pontine hyperintensity.
Figure 9. Axial T2-weighted image of a neonate with lissencephaly demonstrating the typical figure of eight sign. Such pattern is characterized by gen-eralized poor development of gyri and sulci, sylvian fissures narrowing, in association with colpocephaly, flat gyri, thickened cortex and cortico/subcortical atrophy.
configuration because of a narrowing of its middle portion by the Sylvian fissures, as-sociated with the presence of colpocephaly, flat gyri, thickened cortex and cortico/sub-cortical atrophy, characterizing Miller-Dieker syndrome (Figure 9). In lissenceph-aly type II, the cortex is thickened, with an appearance of polymicrogyria, pachygyria, brainstem and cerebellar hypoplasia, hy-drocephalus, characterizing Walker-Warburg syndrome(19,20).
The “face of the giant panda” sign in Wilson’s disease
The face of the giant panda pattern (Fig-ure 10) may be present in Wilson’s disease. Such disease is characterized by hepatocel-lular degeneration caused by a genetic dis-order of the copper metabolism with its consequential accumulation in tissues, par-ticularly liver and brain. On MRI T2-weighted sequences, one can observe hyperintensity in the pontine tegmentum, hypointensity of the periaqueductal gray matter and partially preserved signal in the red nuclei, in the lateral aspect of the sub-stantia nigra pars reticulata and of the upper colliculus(21).
“Martini glass sign” in persistent hyperplastic primary vitreous
Persistent hyperplastic primary vitreous (PHPV) is characterized by the presence of congenital embryonic remnants of hyaline vessels (Figure 11). The primary vitreous is supplied by the embryonal hyaloid
lature that connects the crystalline lens to the optic nerve head, resembling the image of a martini glass. Associatedly, the vitre-ous may present high signal intensity be-cause of hemorrhage, besides the presence of a small ocular globe(22).
“Tram-track sign” in optic nerve sheath meningioma
Optic nerve sheath meningiomas corre-spond to approximately two thirds of the primary tumors in the optic nerve-sheath complex, and are most frequently found in women between their third and fifth de-cade of life. The tram-track sign (Figure 12) is better visualized in the axial plane of enhanced CT or MRI, and corresponds to a central linear hypodensity/hypointen-sity (optic nerve) delimitated by the con-trast uptake of the optic nerve sheath at each of the sides affected by the menin-gioma itself. The tram-track sign is ex-tremely useful in the differentiation be-tween optic nerve sheath meningiomas and optic nerve gliomas. The optic nerve may be thickened and infiltrated by the glioma, but its sheath generally does not demon-strate contrast uptake. The tram-track pat-tern, in spite of being a characteristic sign,
tive disease, which affects particularly young adult individuals. Huntington’s dis-ease causes muscles discoordination and cognitive and behavioral alterations. The finding of ventricular dilatation, as well as basal ganglia atrophy, is very sensitive, but poorly specific(26,27).
“Empty orbit sign” in neurofibromatosis type 1
Neurofibromatosis type 1 is an autoso-mal dominant disease with variable presen-tation, with cerebral and spinal changes seen in one third of the patients. Among the possible alterations, café-au-lait spots, Lisch nodules, plexiform fibromas and op-tic nerve gliomas are highlighted. The empty orbit sign (Figure 14) represents the appearance of the orbit on plain films of the skull and on CT scan because of the lack of the innominate line due to dysplasia of the greater wing of the sphenoid, shorten-ing of the lateral wall of the orbit and flat-tening of the orbital angle(28).
“En coup de sabre” sign in localized scleroderma
Localized scleroderma is characterized by the presence of sclerotic lesions on the skin and subcutaneous tissues. This is dif-ferent from systemic sclerosis because of the absence of significant systemic involve-ment; and generally presents a better prog-Figure 11. Axial T2-weighted image with fat
satu-ration of the right orbit of an 11-month-old patient with leukokoria. Observe the retrolental triangular soft tissue mass (arrow) associated with central, low-signal linear component corresponding to rem-nant hyaloid vasculature that connects the crys-talline lens to the optic nerve head. Such finding is described as martini glass sign and is found in cases persistent hyperplastic primary vitreous.
Figure 12. Axial, post-contrast T1-weighted image with fat saturation of the orbits of a female, 53-year-old patient with progressive loss of visual acuity of the right eye. Observe the optic nerve involved and compressed by a contrast-enhanced circumferential mass surrounding the optic nerve sheath (arrow).
Figure 13. Coronal T2-weighted of a 50-year-old male patient with cognitive deficit, involuntary hands/ fingers movements and muscles discoordination. Observe bilateral atrophy of caudate nuclei and compensatory dilatation of lateral ventricles, a find-ing known as boxcar ventricle, observed in Hun-tington’s disease.
is not specific of optic nerve sheath menin-giomas, and may occur in orbit pseudo-tumors, perioptic neuritis, sarcoidosis, leu-kemia and lymphoma(23,24).
“Boxcar ventricle sign” in Huntington’s disease
neurodegenera-nosis(29). Localized scleroderma invariably affects the head, presenting as a linear, usu-ally frontoparietal lesion (scleroderma “en coup de sabre”) (Figure 15), with progres-sive facial hemiatrophy or Parry-Romberg syndrome where the atrophy extends be-yond the skin to involve the subcutaneous cellular tissue, muscles and bones. Abnor-mal MRI findings are observed in 90% of cases and include hyperintensity on T2-weighted images of the corpus callosum, subcortical regions, deep gray matter and brainstem; and most of times are ipsilateral. Focal atrophy that is the main dermatologi-cal finding may also be observed in the cerebral parenchyma(30).
CONCLUSION
Signs in radiology bring to mind analo-gies with food, animals, mythological char-acters, and objects, among others. Such signs play an extremely relevant role in the decision making process, in the identifica-tion of differential diagnoses and in the achievement of a more accurate specific diagnosis. In spite their degree of specific-ity, signs may be useful in the building of a more relevant and to further narrow the differential diagnosis list.
REFERENCES
1. Kamel HA, Toland J. Trigeminal nerve anatomy: illustrated using examples of abnormalities. AJR Am J Roentgenol. 2001;176:247–51. 2. Krayenbühl N, Isolan GR, Al-Mefty O. The
fora-men spinosum: a landmark in middle fossa sur-gery. Neurosurg Rev. 2008;31:397–401.
3. Silbergleit R, Quint DJ, Mehta BA, et al. The per-sistent stapedial artery. AJNR Am J Neuroradiol. 2000;21:572–7.
4. Thomas M. The lemon sign. Radiology. 2003; 228:206–7.
5. Van den Hof MC, Nicolaides KH, Campbell J, et al. Evaluation of the lemon and banana signs in one hundred thirty fetuses with open spina bifida. Am J Obstet Gynecol. 1990;162:322–7. 6. Aubry MC, Aubry JP, Dommergues M.
Sono-graphic prenatal diagnosis of central nervous sys-tem abnormalities. Childs Nerv Syst. 2003;19: 391–402.
7. Benacerraf BR, Stryker J, Frigoletto FD Jr. Ab-normal US appearance of the cerebellum (banana sign): indirect sign of spina bifida. Radiology. 1989;171:151–3.
8. Roche CJ, O’Keeffe DP, Lee WK, et al. Selections from the buffet of food signs in radiology. Radiographics. 2002;22:1369–84.
9. McGraw P. The molar tooth sign. Radiology. 2003;229:671–2.
10. van Beek EJ, Majoie CB. Case 25: Joubert syn-drome. Radiology. 2000;216:379–82. 11. Wallace EW. The dural tail sign. Radiology.
2004;233:56–7.
12. Rokni-Yazdi H, Azmoudeh Ardalan F, Asadzandi Z, et al. Pathologic significance of the “dural tail sign”. Eur J Radiol. 2009;70:10–6.
13. Neves F, Huwart L, Jourdan G, et al. Head and neck paragangliomas: value of contrast-enhanced 3D MR angiography. AJNR Am J Neuroradiol. 2008;29:883–9.
14. Dubourg C, Bendavid C, Pasquier L, et al. Holo-prosencephaly. Orphanet J Rare Dis. 2007;2:8. 15. Poe LB, Coleman LL, Mahmud F. Congenital
cen-tral nervous system anomalies. Radiographics. 1989;9:801–26.
16. Thakur S, Singh R, Pradhan M, et al. Spectrum of holoprosencephaly. Indian J Pediatr. 2004;71: 593–7.
17. Shrivastava A. The hot cross bun sign. Radiology. 2007;245:606–7.
18. Schrag A, Kingsley D, Phatouros C, et al. Clini-cal usefulness of magnetic resonance imaging in
multiple system atrophy. J Neurol Neurosurg Psy-chiatry. 1998;65:65–71.
19. Shinagare AB, Patil NK. Imaging of congenital malformations of brain: a pictorial essay. The Internet Journal of Radiology. 2008;9(1). 20. Ghai S, Fong KW, Toi A, et al. Prenatal US and
MR imaging findings of lissencephaly: review of fetal cerebral sulcal development. Radiographics. 2006;26:389–405.
21. Kuruvilla A, Joseph S. ‘Face of the giant panda’ sign in Wilson’s disease: revisited. Neurol India. 2000;48:395–6.
22. Lameen H, Andronikou S, Ackermann C, et al. Persistent hyperplastic primary vitreous versus retinal detachment. SA Journal of Radiology. 2006;10:24–5.
23. Johns TT, Citrin CM, Black J, et al. CT evalua-tion of perineural orbital lesions: evaluaevalua-tion of the “tram-track” sign. AJNR Am J Neuroradiol. 1984;5:587–90.
24. Kanamalla US. The optic nerve tram-track sign. Radiology. 2003;227:718–9.
25. Mascalchi M, Lolli F, Della Nave R, et al. Hun-tington disease: volumetric, diffusion-weighted, and magnetization transfer MR imaging of brain. Radiology. 2004;232:867–73.
26. Mühlau M, Wohlschläger AM, Gaser C, et al. Voxel-based morphometry in individual patients: a pilot study in early Huntington disease. AJNR Am J Neuroradiol. 2009;30:539–43.
27. Postert T, Lack B, Kuhn W, et al. Basal ganglia alterations and brain atrophy in Huntington’s dis-ease depicted by transcranial real time sonog-raphy. J Neurol Neurosurg Psychiatry. 1999;67: 457–62.
28. George RA, Godara SC, Som PP. Cranio-orbital-temporal neurofibromatosis: a case report and review of literature. Indian J Radiol Imaging. 2004;14:317–9.
29. Appenzeller S, Montenegro MA, Dertkigil SS, et al. Neuroimaging findings in scleroderma en coup de sabre. Neurology. 2004;62:1585–9. 30. Kister I, Inglese M, Laxer RM, et al. Neurologic
manifestations of localized scleroderma: a case re-port and literature review. Neurology. 2008;71: 1538–45.
Figure 14. Empty orbit sign in a 22-year-old male patient with neurofibromatosis type 1. This case is a courtesy by Doctor Prasad Hanagandi (Montreal, Canada).