Rev Paul Pediatr. 2015;33(1):63–71
1984-1462/© 2014 Sociedade de Pediatria de São Paulo. Published by Elsevier Editora Ltda. All rights reserved.
REVISTA PAULISTA
DE PEDIATRIA
www.rpped.com.brDOI of refers to article: http://dx.doi.org/10.1016/j.rpped.2014.11.011
ORIGINAL ARTICLE
Measurements of body fat distribution: assessment
of collinearity with body mass, adiposity and height
in female adolescents
Patrícia Feliciano Pereira*, Hiara Miguel Stanciola Serrano,
Gisele Queiroz Carvalho, Sônia Machado Rocha Ribeiro,
Maria do Carmo Gouveia Peluzio, Sylvia do Carmo Castro Franceschini,
Silvia Eloiza Priore
Universidade Federal de Viçosa (UFV), Viçosa, MG, Brazil
Received 15 April 2014; accepted 10 July 2014
KEYWORDS Obesity; Adolescents; Body fat distribution; Anthropometry
Abstract
Objective: To verify the correlation between body fat location measurements with the body mass index (BMI), body fat percentage (BF%) and height, according to the nutritio-nal status in female adolescents.
Methods: A controlled cross-sectional study was carried out with 113 adolescents (G1: 38 with normal weight, but with high body fat level, G2: 40 with normal weight and G3: 35 overweight) from public schools in Viçosa-MG, Brazil. The following measures were assessed: weight, height, waist circumference (WC), umbilical circumference (UC), hip circumference (HC), thigh circumference, waist-to-hip ratio (WHR), waist-to-height ra-tio (WHtR), waist-to-thigh rara-tio (WTR), conicity index (CI), sagittal abdominal diameter (SAD), coronal diameter (CD), central (CS) and peripheral skinfolds (PS). The BF% was assessed by tetrapolar electric bioimpedance.
Results: The increase in central fat, represented by WC, UC, WHtR, SAD, CD and CS, and the increase in peripheral fat indicated by HC and thigh circumference were proportional to the increase in BMI and BF%. WC and especially the UC showed the strongest correla-tions with adiposity. Weak correlation between WHR, WTR, CI and CS/PS with adiposity were observed. The height showed correlation with almost all the fat location measures, being fair or weak with waist measurements.
Conclusions: The results indicate colinearity between body mass and total adiposity with central and peripheral adipose tissue. We recommend the use of UC for assessing
nu-*Corresponding author.
64 Feliciano Pereira P et al
tritional status of adolescents, as it showed the highest capacity to predict adiposity in each group, and also showed fair or weak correlation with height.
© 2014 Sociedade de Pediatria de São Paulo. Published by Elsevier Editora Ltda. All rights reserved.
Medidas de localização da gordura corporal: uma avaliação da colinearidade com mas-sa corporal, adiposidade e estatura em adolescentes do sexo feminino
Resumo
Objetivo:Veriicar a correlação entre medidas de localização da gordura corporal com
índice de massa corporal (IMC), percentual de gordura corporal (%GC) e estatura, de acordo com o estado nutricional em adolescentes do sexo feminino.
Métodos:Realizou-se estudo transversal controlado, com113 adolescentes (G1: 38
eutró-icas mas com gordura corporal elevada; G2: 40 eutróeutró-icas e G3: 35 com excesso de peso),
de 14 a 19 anos, de escolas públicas de Viçosa-MG. Aferiu-se peso, estatura, circun-ferência da cintura (CC), circuncircun-ferência umbilical (CUm), circuncircun-ferência do quadril (CQ), circunferência da coxa, relação cintura/quadril (RCQ), relação cintura/estatura (RCE), relação cintura/coxa (RCC), índice de conicidade (IC), diâmetro abdominal sagital (DAS), diâmetro coronal (DC), pregas cutâneas centrais (PCC) e periféricas (PCP). Avaliou-se o %GC por bioimpedância elétrica tetrapolar.
Resultados:O aumento da gordura central, representada pela CC, CUm, RCE, DAS, DC e PCC, e o aumento da gordura periférica indicado pela CQ e da coxa foram proporcionais ao aumento do IMC e %GC. A CC e principalmente CUm apresentaram as correlações mais fortes com a adiposidade, enquanto RCQ, RCC, IC e PCC/PCP as mais fracas. A estatura apresentou correlação com praticamente todas as medidas de localização de gordura, sendo de fraca a regular com as medidas da cintura.
Conclusões:Os resultados indicam colinearidade entre massa corporal e adiposidade to-tal com tecido adiposo central e periférico. Recomenda-se o emprego da CUm na ava-liação do estado nutricional de adolescentes, pois ela apresentou maior capacidade para predizer adiposidade em cada grupo, além de correlação fraca a regular com a estatura. © 2014 Sociedade de Pediatria de São Paulo. Publicado por Elsevier Editora Ltda. Todos os direitos reservados.
PALAVRAS-CHAVE Obesidade; Adolescentes;
Distribuição de gordura corporal;
Antropometria
Introduction
Adolescence starts with the bodily changes of puberty, being a period of major psychosocial and physical changes. Among these, it is worth mentioning the intense growth that interferes with the accumulation and distribution of body fat.1,2 Clinical and epidemiological studies have
estab-lished that body fat distribution is related to cardiovascular risk factors in adults3,4 and also in children and
adoles-cents.5,6 The use of valid measures when assessing body
composition and the fat distribution pattern is required in population studies and clinical practice to attain an early identification of individuals at risk of developing diseases, and to help in the prevention/treatment of obesity.7
Body fat distribution can be assessed by different meth-ods, such as computed tomography (CT) and magnetic reso-nance imaging (MRI), equipment which are more precise and directly measure the amount of visceral fat; however, they are high-cost methods that require extensive training of evaluators, and additionally, CT involves radiation expo-sure.7 Dual-energy X-ray absorptiometry (DXA) – as well as
anthropometry and bioelectrical impedance analysis (BIA) – does not differentiate between subcutaneous and visceral fat. BIA, although not the most accurate method for
assess-ing body composition, is a fast and convenient method for use in field studies.8,9 Anthropometric measurements include
body circumferences, skinfold thickness and some diame-ters, which have the advantage of being relatively simple, inexpensive and non-invasive, and have a good performance in the prediction of visceral fat and cardiovascular risk.10,11
Several anthropometric measurements of body fat have been used in children and adolescents, although the best measure for the pediatric population is yet to be defined.2,5,6,12
It is unclear whether the increase in adiposity in children and adolescents is related to the increase in intra-abdominal fat.13 Thus, the present study aimed to investigate the
cor-relation between peripheral and central fat measurements proposed in the literature with BMI, body fat percentage and height, according to the nutritional status of adolescent girls.
Methods
Measurements of body fat distribution 65
percentage (BF %) by BIA (Tanita®, Model 2220, Illinois, USA).
The adolescents were also asked whether they had had men-arche, and its date of occurrence. Measurements were obtained individually in a room or area established for that purpose inside the schools. Adolescents that met the criteria were invited for a second evaluation carried out by the Section of Nutrition of the Division of Health of Universidade Federal de Viçosa (UFV), where anthropometric and body composition measures were collected. The final sample con-sisted of 38 normal weight adolescents (BMI percentile between 5 and 85)14 but with high body fat percentage (>28%)
(G1-Study group), 40 adolescents with normal weight accord-ing to BMI and normal fat percentage (20-25%) (G2-control group), and 35 with overweight risk/overweight classified according to the Center for Disease Control and Prevention
(CDC) curves (BMI percentile ≥85)14 and high body fat
per-centage (>28 %) (G3-control group). The teenagers included in the study reported the occurrence of menarche for at least 1 year, which corresponds to a greater chance of having overcome the most intense period of physical transforma-tions inherent to puberty.15 Sample size calculation was
car-ried out with Epi Info 6.04 (CDC, Epi Info™ 6, Atlanta, USA) for cross-sectional studies, considering a population of the municipality of 4,507 individuals16 in the age range and
gen-der of the study, prevalence of excess body fat estimated at 25%,15 10% variability and 95% confidence interval, resulting
in a minimum sample size of 35 subjects for each group. This study was approved by the Research Ethics Committee for Human Subjects at UFV. Participation was voluntary after verbal explanation, and after the free and informed consent form was signed by the adolescents and their parents and/or guardians.
Weight was measured in an electronic digital scale with a capacity of 150 kg and precision of 50g. Height was mea-sured using a stadiometer with a length of 2.00m, divided into centimeters and subdivided in millimeters. All mea-surements followed the techniques proposed by Callaway.17
The BMI was calculated as the ratio between total body weight (kg) and height (m2).
The percentage of body fat was assessed by tetrapolar electrical bioimpedance analysis (Biodynamics©, model
310, version 7.1, Washington, USA). The assessment was carried out between 7:00 am and 8:30 am, after a 12-hour fasting and following the specific protocol for this type of evaluation.18
Waist circumference was measured at two locations: smallest abdominal circumference (waist circumference) and at the umbilicus (umbilical circumference), under the clothes and at the end of a normal expiration, using a flex-ible and inelastic measuring tape.17 The hip was measured
at the greatest circumference of the gluteal region,17 over
light clothing. Thigh circumference was measured 3 cm above the patella on the left side of the body in individuals whose right hand was dominant, and on the right side of the body in those whose left hand was dominant.19 Measurements
were taken twice, and the mean value was used in the anal-ysis. Waist-to-hip ratio (WHR) was calculated using the waist circumference and hip circumference measures; waist-to-thigh ratio (WTR) by dividing the umbilical circumference by thigh circumference, and waist-to-height ratio (WHtR) through the ratio between waist circumference and height.
The conicity index (CI) was calculated through the fol-lowing formula:12
C Index = Waist circumference (m)
0.109 √body weight (kg) height (m)
The distance between the back and the abdomen (sagit-tal abdominal diameter, SAD), and the distance between the iliac crests (coronal diameter, CD) were measured with the adolescents in the supine position, knees bent on a flat, firm surface, under the clothes and after a normal expira-tion. The midpoint between the iliac crests was identified and then the reading was performed at the level of the right iliac crest, taking care not to compress the tissues, using a metal caliper with an extension of 50cm, divided into centimeters and subdivided into millimeters (Cescorf®,
Rio Grande do Sul, Brazil).11,20
Subscapular, suprailiac, triceps and biceps skinfolds were assessed on the right side of the body, and all measure-ments were taken by a single evaluator. Each measurement was verified three times, non-consecutively (using the mean value), with a Lange Skinfold Caliper.21 The
measure-ment was repeated in case of divergence >10% between the three values. Peripheral skinfold (PSF) consisted of the sum of triceps and biceps folds, and central skinfold (CSF), of the sum of the subscapular and suprailiac folds, from which we calculated the CSF/PSF ratio.22
For the statistical analysis, the distribution of variables was verified through the Kolmogorov-Smirnov test. Exploratory analysis of data was carried out by measures of central tendency and dispersion. Subsequently, the Mann-Whitney test and/or Student’s t test were used to identify statistical differences in study variables between the three groups of nutritional status, according to variable distribu-tion. Pearson’s and Spearman’s correlation was performed between anthropometric variables and body composition with measures of fat distribution, according to the normal-ity of the variables. The qualitative assessment of the degree of correlation between the variables followed the Callegari-Jacques criteria23 (null correlation: r=0; weak:
0-0.3; fair: 0.3-0.6, strong: 0.6-0.9, very strong: 0.9-1). Analyses were performed using Sigma-statistic 2.0 and STATA software, version 11.0 (StataCorp LP, Texas, USA). The statistical significance was set at p<0.05.
Results
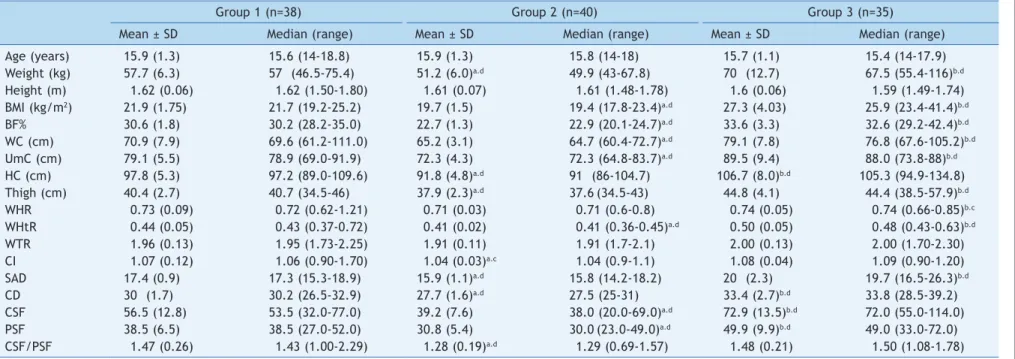
The characteristics of the study population are shown in Table 1. Mean age and height did not differ between the groups, reflecting homogeneity between them. The vari-ables weight, BMI, BF%, waist circumference (WC), umbili-cal circumference (UC), hip, thigh, WHtR, SAD, CD, WTR and PSF in group G1 were significantly higher than in G2, and lower than in G3 (p<0.001). WHR and WTR did not dif-fer between G1 and G2. No statistically significant difdif-fer- differ-ences were observed between G1 and G3 regarding WTR, CI, and CSF/PSF ratio.
66
Feliciano P
ereira P
et al
Table 1 Age, anthropometry and body composition of the adolescents.
Group 1 (n=38) Group 2 (n=40) Group 3 (n=35)
Mean ± SD Median (range) Mean ± SD Median (range) Mean ± SD Median (range) Age (years) 15.9 (1.3) 15.6 (14-18.8) 15.9 (1.3) 15.8 (14-18) 15.7 (1.1) 15.4 (14-17.9) Weight (kg) 57.7 (6.3) 57. (46.5-75.4) 51.2 (6.0)a.d 49.9 (43-67.8) 70. (12.7) 67.5 (55.4-116)b.d
Height (m) 1.62 (0.06) 1.62 (1.50-1.80) 1.61 (0.07) 1.61 (1.48-1.78) 1.6 (0.06) 1.59 (1.49-1.74) BMI (kg/m2) 21.9 (1.75) 21.7 (19.2-25.2) 19.7 (1.5) 19.4 (17.8-23.4)a.d 27.3 (4.03) 25.9 (23.4-41.4)b.d
BF% 30.6 (1.8) 30.2 (28.2-35.0) 22.7 (1.3) 22.9 (20.1-24.7)a.d 33.6 (3.3) 32.6 (29.2-42.4)b.d
WC (cm) 70.9 (7.9) 69.6 (61.2-111.0) 65.2 (3.1) 64.7 (60.4-72.7)a.d 79.1 (7.8) 76.8 (67.6-105.2)b.d
UmC (cm) 79.1 (5.5) 78.9 (69.0-91.9) 72.3 (4.3) 72.3 (64.8-83.7)a.d 89.5 (9.4) 88.0 (73.8-88)b.d
HC (cm) 97.8 (5.3) 97.2 (89.0-109.6) 91.8 (4.8)a.d 91. (86-104.7) 106.7 (8.0)b.d 105.3 (94.9-134.8)
Thigh (cm) 40.4 (2.7) 40.7 (34.5-46) 37.9 (2.3)a.d 37.6(34.5-43) 44.8 (4.1) 44.4 (38.5-57.9)b.d
WHR 0.73 (0.09) 0.72 (0.62-1.21) 0.71 (0.03) 0.71 (0.6-0.8) 0.74 (0.05) 0.74 (0.66-0.85)b.c
WHtR 0.44 (0.05) 0.43 (0.37-0.72) 0.41 (0.02) 0.41 (0.36-0.45)a.d 0.50 (0.05) 0.48 (0.43-0.63)b.d
WTR 1.96 (0.13) 1.95 (1.73-2.25) 1.91 (0.11) 1.91 (1.7-2.1) 2.00 (0.13) 2.00 (1.70-2.30) CI 1.07 (0.12) 1.06 (0.90-1.70) 1.04 (0.03)a.c 1.04 (0.9-1.1) 1.08 (0.04) 1.09 (0.90-1.20)
SAD 17.4 (0.9) 17.3 (15.3-18.9) 15.9 (1.1)a.d 15.8 (14.2-18.2) 20. (2.3) 19.7 (16.5-26.3)b.d
CD 30. (1.7) 30.2 (26.5-32.9) 27.7 (1.6)a.d 27.5 (25-31) 33.4 (2.7)b.d 33.8 (28.5-39.2)
CSF 56.5 (12.8) 53.5 (32.0-77.0) 39.2 (7.6) 38.0 (20.0-69.0)a.d 72.9 (13.5)b.d 72.0 (55.0-114.0)
PSF 38.5 (6.5) 38.5 (27.0-52.0) 30.8 (5.4) 30.0(23.0-49.0)a.d 49.9 (9.9)b.d 49.0 (33.0-72.0)
CSF/PSF 1.47 (0.26) 1.43 (1.00-2.29) 1.28 (0.19)a.d 1.29 (0.69-1.57) 1.48 (0.21) 1.50 (1.08-1.78)
BMI, body mass index; BF%, body fat percentage; WC, waist circumference; UmC, umbilical circumference; HC, hip circumference; WHR, waist/hip ratio; WHtR, waist/height ratio; WTR, waist/thigh ratio; CI, conicity index; SAD, sagittal abdominal diameter; CD, coronal diameter; CSF, central skinfolds; PSF, peripheral skinfolds; CSF/PSF, central/peripheral skin folds.
Student’s t Test and Mann-WhitneyTest. a Difference between G1 and G2. b Difference between G1 and G3. cp<0.05.
dp<0.001.
Table 2 Coeficient of correlation between measures of fat distribution with total body mass, body fat percentage and height in the total population (n=113).
Variables Measures of fat distribution
WC UmC HC Thigh WHR WHtR WTR CI SAD CD CSF PSF CSF/PSF BMI 0.90b.d 0.89b.d 0.89b.d 0.88b.d 0.28b.c 0.89b.c 0.25b.c 0.34b.d 0.86b.d 0.83b.d 0.82b.d 0.77b.d 0.41b.d
BF% 0.73b.d 0.76b.d 0.72b.d 0.67b.d 0.26b.c 0.71b.c 0.31b.d 0.39b.d 0.74b.d 0.67b.d 0.75b.d 0.69b.d 0.37b.d
Height 0.14b 0.18b 0.26a.c 0.14a —0.13a —0.26b.c 0.09a —0.04a 0.11b 0.14b —0.009b —0.02b 0.01a
BMI, body mass index; BF%, body fat percentage; WC, waist circumference; UmC, umbilical circumference; HC, hip circumference; WHR, waist/hip ratio; WHtR, waist/height ratio; WTR, waist/thigh ratio; CI, conicity index; SAD, sagittal abdominal diameter; CD, coronal diameter; CSF, central skinfolds; PSF, peripheral skinfolds; CSF/PSF, central/peripheral skin folds.
a Pearson’s correlation test. b Spearman’s correlation test. cp<0.01.
Measurements of body fat distribution
67
Table 3 Coeficient of correlation between measures of fat distribution with total body mass, body fat percentage and height in normal weight adolescents with high body
fat (G1) (n=38).
Variables Measures of fat distribution
WC UmC HC Thigh WHR WHtR WTR CI SAD CD CSF PSF CSF/PSF BMI 0.69b,e 0.63b,e 0.78b,e 0.78b,e 0.07b 0.69b,e —0.05b 0.09b 0.51b,d 0.59b,e 0.51b,d 0.61b,e 0.19b
BF% 0.26b 0.16b 0.05b 0.12b 0.16b 0.26b 0.06b 0.26b 0.14b —0.15b 0.12b 0.17b —0.03b
Height 0.06b 0.25a 0.40a,c 0.31a —0.15b —0.45b,d —0.07a —0.08b 0.10a 0.17a 0.07a —0.02a 0.10a
BMI, body mass index; BF%, body fat percentage; WC, waist circumference; UmC, umbilical circumference; HC, hip circumference; WHR, waist/hip ratio; WHtR, waist/height ratio; WTR, waist/thigh ratio; CI, conicity index; SAD, sagittal abdominal diameter; CD, coronal diameter; CSF, central skinfolds; PSF, peripheral skinfolds; CSF/PSF, central/peripheral skin folds.
a Pearson’s correlation test. b Spearman’s correlation test. cp<0.05.
dp<0.01. ep<0.001.
Table 4 Coeficient of correlation between measures of fat distribution with total body mass, body fat percentage and height in adolescents with normal weight (G2) (n = 40).
Variables Measures of fat distribution
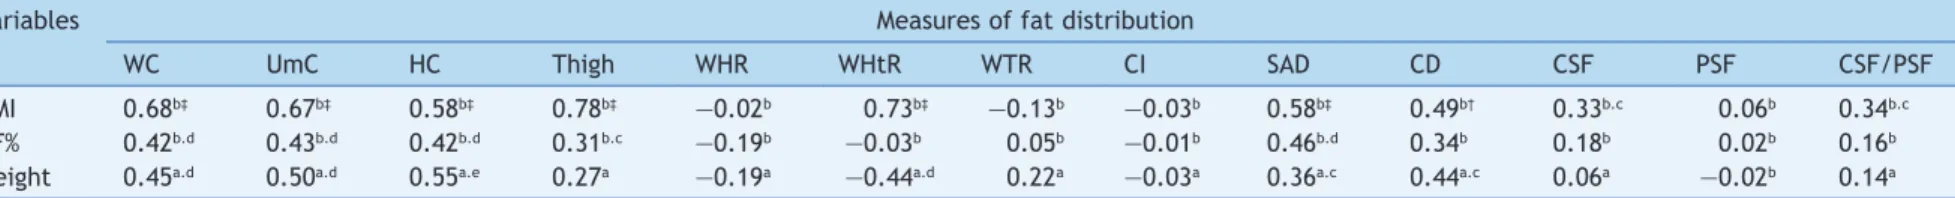
WC UmC HC Thigh WHR WHtR WTR CI SAD CD CSF PSF CSF/PSF BMI 0.68b‡ 0.67b‡ 0.58b‡ 0.78b‡ —0.02b 0.73b‡ —0.13b —0.03b 0.58b‡ 0.49b† 0.33b.c 0.06b 0.34b.c
BF% 0.42b.d 0.43b.d 0.42b.d 0.31b.c —0.19b —0.03b 0.05b —0.01b 0.46b.d 0.34b 0.18b 0.02b 0.16b
Height 0.45a.d 0.50a.d 0.55a.e 0.27a —0.19a —0.44a.d 0.22a —0.03a 0.36a.c 0.44a.c 0.06a —0.02b 0.14a
BMI, body mass index; BF%, body fat percentage; WC, waist circumference; UmC, umbilical circumference; HC, hip circumference; WHR, waist/hip ratio; WHtR, waist/height ratio; WTR, waist/thigh ratio; CI, conicity index; SAD, sagittal abdominal diameter; CD, coronal diameter; CSF, central skinfolds; PSF, peripheral skinfolds; CSF/PSF, central/peripheral skin folds.
a Pearson’s correlation test. b Spearman’s correlation test. cp<0.05.
dp<0.01. ep<0.001.
Table 5 Coeficient of correlation between measures of fat distribution with total body mass, body fat percentage and height in adolescents with excess weight (G3) (n = 35).
Variables Measures of fat distribution
WC UmC HC Thigh WHR WHtR WTR CI SAD CD CSF PSF CSF/PSF BMI 0.83b.e 0.87b.e 0.75b.e 0.65b.e 0.38b.c 0.71b.e 0.26b 0.38b.c 0.75b.e 0.76b.e 0.62b.e 0.47b.d 0.12b
BF% 0.47b.d 0.65b.e 0.55b.e 0.41b.c 0.11b 0.48b.d 0.34b.c 0.32b 0.28b 0.30b 0.67b.e 0.44b.c 0.23b
Height 0.30b 0.39a.c 0.46a.d 0.34b.c —0.06a —0.13b 0.20a —0.04a 0.40b.c 0.34b 0.04b 0.25b —0.30b
BMI, body mass index; BF%, body fat percentage; WC, waist circumference; UmC, umbilical circumference; HC, hip circumference; WHR, waist/hip ratio; WHtR, waist/height ratio; WTR, waist/thigh ratio; CI, conicity index; SAD, sagittal abdominal diameter; CD, coronal diameter; CSF, central skinfolds; PSF, peripheral skinfolds; CSF/PSF, central/peripheral skin folds.
a Pearson’s correlation test. b Spearman’s correlation test. cp<0.05.
68 Feliciano Pereira P et al
population. BMI and BF% were strongly correlated with measures of distribution of body fat, except WHR, WTR, CI and CSF/PSF. For these, the correlations were weak to fair. The strongest correlations were found between BMI and WC (r = 0.90, p<0.001) and between BF% and UC (r=0.76,
p<0.001). Height showed a positive statistically significant correlation (although weak) with HC and a negative one with WHtR.
Table 3 shows the correlation coefficient in the group of adolescents with normal weight but with excess body fat. BMI showed a significant correlation with WC, UC, HC, WHtR, SAD, CD, CSF and PSF. The BF% was not correlated with any measure of fat distribution, whereas height was correlated, but at a fair degree, with HC and WHtR.
In adolescents with normal weight and adequate body fat content, BMI showed a statistically significant fair to strong correlation with virtually all measures of fat distribution, except WHR, WTR, IC and PSF. The BF% showed a fair cor-relation with WC, UC, HC, thigh and SAD. As for the mea-sures of fat distribution and height, they showed a fair cor-relation with WC, UC, HC, SAD, CD and WHtR. The correla-tion with WHtR was a negative one (r=–0.44) (Table 4).
Table 5 shows the correlation coefficients among adoles-cents at risk for overweight/overweight. BMI correlated with all measures of fat distribution, except WTR and CSF/ PSF. The BF%, in turn, correlated with all measures of fat distribution, except WHR, CI, SAD, CD and CSF/PSF. Height showed a positive correlation with UC, HC, thigh and SAD.
Considering the total sample and the analysis per group, the WC and UC showed the strongest correlations with BMI and BF%, in addition to showing a weak to fair association with height in the total sample and in each group.
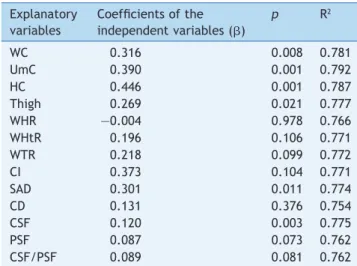
In multiple linear regression analysis between each mea-sure of fat distribution and BF% (dependent variable), after adjustment for age and nutritional status, it was observed that WC, UC, HC, thigh, SAD and CSF showed significant predictive capacity (p<0.05) of BF% (Table 6). When the model included all measures of body fat, just UC remained as a significant predictor (p=0.038); however, the final model indicated multicollinearity (VIF: 11.18; if VIF < 4 there is no multicollinearity) (data not shown in table).
Discussion
The present study investigated the correlation between BMI, BF% and height, with measures of body fat content in female adolescents with different levels of adiposity. The results showed that the increase in central fat, represented by WC, UC, WHtR, SAD, CD and CSF, and in peripheral fat, indicated by HC, thigh and PSF was proportional to the increase in BMI and body fat. Vieira et al.24 found
signifi-cantly higher mean values of WC, HC and WHR in normal adolescents with high percentage of body fat when com-pared to those with normal fat percentage. Similar to the abovementioned study, the results indicate that adoles-cents with normal weight and excess body fat (G1) had a higher proportion of central fat, represented by the differ-ent measures of fat distribution, compared to normal weight ones with adequate body fat (G2); i.e., even though the adolescents were considered as having normal weight according to the BMI, they had excess total body fat and this was reflected in the increase in central fat. These results confirm the limitation of BMI to report on adiposity, particularly on an outpatient basis, and reinforce the importance of routine evaluation of body fat composition and distribution in adolescents.
In the correlation analysis, it was observed that the WC, UC, WHtR, SAD, CD, CSF, HC, thigh and PSF measures were the ones most associated with BMI and BF%, and WC and UC had the best performance compared to the others. In the group analysis, the largest number of correlations between measures of fat distribution with BMI and BF% was found in the group with excess weight and body fat. A greater pro-portion of trunk fat with increased BMI has been previously demonstrated in children and adolescents.12
Regarding WC, it has been previously shown that it is highly correlated with BMI (r=0.89, p=0.001) in female ado-lescents.25 Janssen et al.26 also found a similar correlation
between BMI and WC (r=0.92 to 0.94) in a study with 2,597 children and adolescents aged 5-18 years. Considering the strong correlation between the two, it may be inferred that such parameters are virtually identical, having no indepen-dent effect. However, when evaluating the clinical useful-ness of their combined use in a categorized manner, it was observed that the covariance between them is reduced, and thus the combined use of BMI and WC would be a better predictor of health risk for children and adolescents.
Regarding BF%, a similar study observed a higher correla-tion between WC and BF% (r=0.85, p<0.001) in overweight adolescents (12-18 years) than the present study, when assessed by bipolar electrical bioimpedance, which may have occurred due to possible differences between bipolar
Table 6 Multiple linear regression analysis between the measurements of body fat distribution and BF%, adjusted for age and nutritional status.
Explanatory variables
Coeficients of the independent variables (b)
p R2
WC 0.316 0.008 0.781
UmC 0.390 0.001 0.792
HC 0.446 0.001 0.787
Thigh 0.269 0.021 0.777
WHR —0.004 0.978 0.766
WHtR 0.196 0.106 0.771
WTR 0.218 0.099 0.772
CI 0.373 0.104 0.771
SAD 0.301 0.011 0.774
CD 0.131 0.376 0.754
CSF 0.120 0.003 0.775
PSF 0.087 0.073 0.762
CSF/PSF 0.089 0.081 0.762
Measurements of body fat distribution 69
and tetrapolar models, in addition to the younger age range evaluated in the aforementioned study, which must have included adolescents whose menarche occurred recently or who had not yet had it, and the associations between abdominal fat and total body fat, which are altered during the sexual maturation process.25
Although the WC is a broadly used measure, there is a variety of locations used for its measurement,27 and there
are no methodological standards, thus making it difficult to compare studies. This study evaluated and compared WC and UC, with close correlations of these measurements being observed with BMI and BF%, except in the group with excess weight, in which associations with UC were stronger. This may reflect a preferential accumulation of fat in the umbilical region rather than in the natural waist, with the increased weight and body fat in adolescents. As it is important to monitor the growth and development of ado-lescents over time, it is advisable to be consistent and use a single anatomical point for measuring the waist. Considering that the multiple linear regression analysis indicated that the UC was the main predictor of BF%, even after adjusting for age, nutritional status and by other measures of fat distribution, we recommend the use of this standardized anatomical point for waist measurement.
WHR may reflect different aspects of body composition (fat tissue, muscle mass and skeletal structure), and for a given value, there can be large variations in the level of total body fat and visceral adipose tissue.28 In the present
study, WHR showed a lower correlation than the WC to esti-mate BF%, but the HC showed a similar correlation to the two anatomical points of waist measurement. Thus, it can be stated that in cases where the WC measurement is extremely difficult to be obtained due to an excessive accumulation of abdominal fat, HC could be a good choice regarding adiposity.
Oliveira et al25 found in females that WHR showed weaker
correlations with BMI (r=0.51, p=0.03) and BF% (r=0.50,
p=0.001) than WC, demonstrating that this marker is less dependent on total body fat. Independent effects of waist and hip can be confounded in WHR, indicating that this index has low sensitivity to identify body changes in puberty.27
The thigh circumference, similar to HC, also comprises a peripheral measure of fat content. The analyses indicated close correlations between the two measures for both BMI and BF% in eutrophic adolescents and those with excess body fat. As an advantage, unlike HC, the thigh circumfer-ence is not affected by variations in the pelvic architec-ture.13 The weak correlations found for WTR, an index
sel-dom used in adolescents, may be due to the reason men-tioned for WHR, i.e., the isolated effect of the measures seems to be diluted when using the ratio between them. Apparently, the use of UC and thigh circumference mea-sures separately, when compared to the use of WTR, has a better performance in predicting adiposity. Recently, it has been proposed the use of the thigh circumference and HC as alternatives to evaluate changes related to growth in body composition and proportions, in places where no imaging methods are available.28
One question that has been discussed is whether the use of waist combined with height would be superior to waist circumference alone in predicting cardiovascular risk.29
Although the precise effect of height on WC is quantitative-ly unknown, it is known that it influences the magnitude of WC throughout growth and also in adult life.4 In this study,
it was observed that the WC and the WHtR showed close correlations with BMI and BF%, except in G2, in which the WHtR, unlike the WC, showed no association with BF%.
In general, the CI was not a good indicator of body mass and total body fat. In a study with children and adoles-cents, this index was not a good indicator of fat content in the trunk, probably because the associations between the measures are not good indicators of obesity.12 Moreover, the
SAD has been reported as similar or even superior to WC as a predictor of metabolic risk in adults.4,5 This study did not
assess metabolic parameters, but we observed a similar correlation between these measures with BMI and BF% in the general population. CD had not yet been evaluated in adolescents, and this is the first study about it. In adult women, there was a strong correlation (r=0.91, p<0.001) between this diameter and total adipose tissue evaluated by MRI.20 In the present study, the CD showed similar
behav-ior to the SAD, demonstrating a relative dependence between height and the abdominal width.
Regarding the skinfolds, in general, the CSF showed a stronger correlation with BMI and BF% than PSF, and both had a higher association than the CSF/PSF ratio. This is probably due to the small variation in ratio values. In the case of overweight adolescents with high body fat, it is particularly important to consider the fragility of the skin folds in predicting body fat, as the thickness of the folds often exceeds the recommended limit (>40 mm) to obtain good quality measurements.30
This study also aimed to assess the influence of height on measures of fat distribution. Height was positively correlat-ed with HC, and negatively with WHtR. In the control groups, besides these two, WC, UC, thigh, SAD and CD showed a significant correlation, demonstrating that they seem to be influenced by the adolescents’ height. The strongest correlation was with HC, which derives from the fact that this measure is influenced by the skeletal struc-ture.13 Its association with WHtR is probably due to the fact
that it participates in the ratio, as well as the influence it would have on the WC, as previously discussed. Weaker cor-relations were observed for WC and UC. It is important to mention that a low correlation with height is desirable for any indicator of obesity. As height increases with age, the strong correlation of an indicator of fat distribution with height may disguise the true association with adiposity.27
Several anthropometric indicators of fat distribution have been proposed in the literature as predictors of body fat level and its distribution.9,13,19,25,30 However, such surveys
are limited regarding the number of evaluated anthropo-metric measurements. Dissimilarly, this controlled cross-sectional study was based on the measurement of several circumferences, skinfold thicknesses and diame-ters; however, one limitation is the lack of data from the early adolescent years, thus restricting the recommenda-tions for the final phase. Considering that anthropometric measures in the assessment of body composition in adoles-cents have good accuracy,30 and that excess body fat,
70 Feliciano Pereira P et al
assessment of body fat distribution should be routine in pediatric care.
It can be concluded that the increase in central and peripheral fat was proportional to the increase in BMI and body fat, indicating collinearity between the specific fat deposits with total fat. The waist and umbilical circumfer-ences were the body fat measure locations that showed the strongest correlations with BMI and BF%, in addition to showing a weak to fair association with height in the total sample and in each group. A weak correlation between anthropometric measures and height is desirable, especial-ly in a period of intense growth, to prevent height from concealing the real association with adiposity. As for the anatomical location of the waist measurement, the umbili-cus location was more related to adiposity than the small-est waist point in the overweight group.
As it is important to monitor the growth and develop-ment of adolescents over time, it is advisable to standard-ize the use of one measure of body fat location. Considering that abdominal fat, more than total fat, has been associat-ed with cardiometabolic risk, it is recommendassociat-ed the use of waist circumference measured at the umbilicus as a mea-sure that reflects the adipose tissue in this region, associ-ated at least with BMI, in the assessment of the nutritional status of adolescents.
Funding
This study is part of the project “Influence of body fat on the risk factors for cardiovascular disease in female adoles-cents” funded by Fundação de Amparo à Pesquisa do Estado de Minas Gerais (FAPEMIG), process APQ -1506-4.08-07 .
Conlicts of interest
The authors declare no conflicts of interest.
Acknowledgements
To all adolescents and their parents/guardians who allowed their participation, making this work possible. To CAPES (Coordenação de Aperfeiçoamento de Pessoal de Nível Superior) for the grant given to the Post-Graduate Program in Nutrition Science.
References
1. Miranda VP, de Faria FR, de Faria ER, Priore SE. Somatic maturation and body composition in female healthy adolescents with or without adjustment for body fat. Rev Paul Pediatr. 2014; 32:78-84.
2. Bénéice E, Garnier D, Simondon KB, Malina RM. Relationship between stunting in infancy and growth and fat distribution during adolescence in Senegalese girls. Eur J Clin Nutr. 2001; 55:50-8.
3. Snijder MB, Zimmet PZ, Visser M, Dekker JM, Seidell JC, Shaw JE. Independent and opposite associations of waist and hip
circumferences with diabetes, hypertension and dyslipidemia: the AusDiab Study. Int J Obes Relat Metab Disord. 2004;28:402-9. 4. Ashwell M, Gunn P, Gibson S. Waist-to-height ratio is a better
screening tool than waist circumference and BMI for adult cardiometabolic risk factors: systematic review and meta-analysis. Obes Rev. 2012;13:275-86.
5. Pereira PF, Serrano HM, Carvalho GQ, Lamounier JA, Peluzio MC, Franceschini SC, et al. Waist and waist-to-height ratio: useful to identify the metabolic risk of female adolescents? Rev Paul Pediatr. 2011;29:372-7.
6. Staiano AE, Gupta AK, Katzmarzyk PT. Cardiometabolic risk factors and fat distribution in children and adolescents. J Pediatr. 2014;164:560-5.
7. Goran MI, Gower BA. Relation between visceral fat and disease risk in children and adolescents. Am J Clin Nutr. 1999;70:149S-56.
8. Newton RL, Alfonso A, White MA, York-Crowe E, Walden H, Ryan D et al. Percent body fat measured by BIA and DEXA in obese, African-American adolescent girls. Int J Obes (Lond). 2005; 29:594-602.
9. Sun Q, van Dam RM, Spiegelman D, Heymsield SB, Willet WC, Hu FB. Comparison of dual-energy x-ray absorptiometric and anthropometric measures of adiposity in relation to adiposity-related biologic factors. Am J Epidemiol. 2010;172:1442-54. 10. Williamson DF, Kahn HS, Worthman CM, Burnette JC, Russell CM.
Precision of recumbent anthropometry. AJHB. 1993;5:159-67. 11. Garaulet M, Hernández-Morante JJ, Tébar FJ, Zamora S,
Canteras M. Two-dimensional predictive equation to classify visceral obesity in clinical practice. Obesity (Silver Spring). 2006;14:1181-91.
12. Taylor RW, Jones IE, Williams SM, Goulding A. Evaluation of waist circumference, waist-to-hip ratio, and the conicity index as screening tools for high trunk fat mass, as measured by dual-energy X-ray absorptiometry, in children aged 3-19 y. Am J Clin Nutr. 2000;72:490-5.
13. Teixeira PJ, Sardinha LB, Going SB, Lohman TG. Total and regional fat and serum cardiovascular disease risk factors in lean and obese children and adolescents. Obes Res. 2001;9:432-42. 14. Centers for Disease Control and Prevention; National Centers
for Health Statistics. CDC/NCHS (2000), growth charts for the United States: methods and development. Vital Health Stat. 2002;11:1-190.
15. Vieira PC, Priore SE, Franceschini SC, Monteiro JB. Composição corporal de adolescentes após menarca. Rev Min Educ Fis. 2002;10:237-486.
16. Brasil – Ministério do Planejamento, Orçamento e Gestão; Instituto Brasileiro de Geograia e Estatística. Censo demográico 2000: características gerais da população. Rio de Janeiro: IBGE; 2000. Available from: http://www.ibge.gov.br/ home / est at ist ica/ populacao/ ce nso2 0 00 /populacao/ censo2000_populacao.pdf
17. Callaway CW, Chumlea WC, Bouchard C, Himes JH, Lohman TG, Martin AD. Circumferences. In: Lohman TG, Roche AF, Martorell R, editors. Anthropometric standardization reference manual. Champaign: Human Kinetics Books; 1988. p. 39-54.
18. Barbosa KB. Métodos para avaliação do consumo alimentar e sua relação com os marcadores de risco para a síndrome metabólica em adolescentes do sexo feminino [tese de mestrado]. Viçosa (MG): UFV; 2006.
19. Asayama K, Hayashi K, Kawada Y, Nakane T, Uchida N, Hayashibe H, et al. New age-adjusted measure of body fat distribution in children and adolescents: standardization of waist-hip ratio using multivariate analysis. Int J Obes Relat Metab Disord. 1997;21:594-9.
Measurements of body fat distribution 71
21. Frisancho AR. New norms of upper limb fat and muscle areas for assessment of nutritional status. Am J Clin Nutr. 1981;34: 2540-5.
22. Wärnberg J, Nova E, Moreno LA, Romeo J, Mesana MI, Ruiz JR, et al. Inlammatory proteins are related to total and abdominal adiposity in a healthy adolescent population: the AVENA Study. Am J Clin Nutr. 2006;84:505-12.
23. Callegari-Jacques SM. Bioestatística: princípios e aplicações. 3rd ed. Porto Alegre: Artmed; 2006.
24. Vieira PC, Faria ER, Faria FR, Sperandio N, Gontijo CA, Cecon RS, et al. Fatores associados à adiposidade em adolescentes do sexo feminino eutróicas com adequado e elevado percentual de gordura corporal: elaboração de um modelo de risco. ALAN. 2011;61:279-87.
25. Oliveira CL, Veiga GV, Sichieri R. Anthropometric markers for cardiovascular disease risk factors among overweight adolescents. Nutrition Research. 2001;21:1335-45.
26. Janssen I, Katzmarzyk PT, Srinivasan SR, Chen W, Malina RM, Bouchard C, et al. Combined inluence of body mass index and waist circumference on coronary artery disease risk factors among children and adolescents. Pediatrics. 2005;115:1623-30.
27. Goran MI, Gower BA, Treuth M, Nagy TR. Prediction of intra-abdominal and subcutaneous intra-abdominal adipose tissue in healthy pre-pubertal children. Int J Obes Relat Metab Disord. 1998;22:549-58.
28. Kahn HS. The waist-to-hip ratio as an index of central obesity. JAMA. 1996;275:1160.
29. McCarthy HD. Measuring growth and obesity across childhood and adolescence. Conference on “Childhood nutrition and obesity: currents status and future challenges” Symposium 2: Data collection. Proceedings of the Nutrition Society Irish Section Meeting 2013 Jun 21. p. 1-8.