Association between
anthropometric markers of body
adiposity and hypertension in
an adult population of Cuiabá,
Mato Grosso
Associação entre marcadores
antropométricos de adiposidade
corporal e hipertensão arterial na
população adulta de Cuiabá, Mato
Grosso
Larissa Silva BARBOSA
1Luiz César Nazário SCALA
1,2Márcia Gonçalves FERREIRA
1,31 Instituto de Saúde Coletiva, Universidade Federal de Mato Grosso 2 Faculdade de Ciências Médicas,Universidade Federal de Mato Grosso 3 Faculdade de Nutrição, Universidade Federal de Mato Grosso
Paper presented in the 18th World Epidemiology Congress and 7th Brazilian Epidemiology
Con-gress.
Financial support to an Integrated Research Project by the National Council of Scientiic and Tech-nological Development (CNPQ) – Process 52.0861/99-0.
Approved by the Research Ethics Committee of the University Hospital Júlio Muller of Mato Grosso Federal University, Protocol # 063/2002
Mailing addresses: - Larissa Silva Barbosa. Rua 265 B, Quadra 117 B, Lote 18, Apto 04, Setor Leste Universitário, Goiânia-GO, CEP 74610-310. Phone: (62) 3201-7705 Fax: (62) 3201-3537
- Luiz César Nazário Scala. Av. Rubens de Mendonça, 2.391 – 18º andar – Bosque da Saúde, Cuiabá-MT, CEP 78050-000. Phone: (65) 3642-1884; Fax: (65) 3642-6658
- Márcia Gonçalves Ferreira. Av. Marechal Deodoro, 829/1202, Bairro Araés, Cuiabá-MT, CEP 78005-505. Phone: (65) 3615-8828; Fax: (65) 3615-8811
Author responsible for mail: Larissa Silva Barbosa – [email protected]. Rua 265B Qd. 117B Lote 18 Apto 04 - Setor Leste Universitário - Goiânia – Goiás CEP: 74.610-310. Phone: (62) 3201-7705 FAX: (62) 3201-3537
Resumo
OBJETIVO: Avaliar a associação entre mar-cadores antropométricos de adiposidade corporal (índice de massa corporal e circun-ferência da cintura) e hipertensão arterial. MÉTODOS: Estudo de corte transversal, de base populacional, realizado no período de 2003 a 2004, com 1298 indivíduos de 20 a 59 anos. Foram considerados hiper-tensos os indivíduos com pressão arterial
≥ 140/90 mmHg ou em uso de medicação
anti-hipertensiva. A análise multivariada foi realizada por meio de regressão de Poisson, As associações entre os indicadores antro-pométricos e a hipertensão arterial foram analisadas por regressão de Poisson, ajusta-da por potenciais fatores de confusão (sexo, idade, escolaridade, tabagismo, consumo de bebida alcoólica e atividade física no lazer). A curva ROC foi utilizada para determinar o melhor ponto de corte do IMC para detec-ção da hipertensão arterial. RESULTADOS: A prevalência de hipertensão arterial foi de 28,3%, sendo 33,5% no sexo masculino e 23,5% no feminino. Após ajuste para o IMC e potenciais fatores de confusão, a circunferência da cintura perdeu associação com o desfecho avaliado, permanecendo apenas o IMC com poder de explicação para a hipertensão arterial (RP = 1,05, p = 0,001). O melhor ponto de corte para o IMC no sexo masculino foi de 25,6 Kg/m2 e no
sexo feminino, 25,7Kg/m2. CONCLUSÕES:
A associação observada entre a circunfe-rência da cintura e hipertensão arterial em muitos estudos pode estar relacionada à ausência de controle de potenciais fatores de confusão nas análises, bem como à não remoção do efeito da adiposidade total. Novas investigações devem ser conduzidas na população brasileira, a fim de se verificar as verdadeiras associações entre indicado-res antropométricos e vários desfechos, estudando-se também os melhores pontos de corte desses indicadores.
ABSTRACT
OBJECTIVE: To assess the association be-tween the anthropometric indexes of body adiposity (body mass index - BMI and waist circumference) and hypertension. METH-ODS: This is a population-based cross-sectional study, carried out from 2003 to 2004, with 1,298 individuals between 20 and 59 years of age. Individuals with blood pres-sure 140/90 mmHg using anti-hypertensive medication were considered hypertensive. Multivariate analysis was performed using Poisson’s regression, adjusted for potential confounding factors (sex, age, schooling, smoking, alcohol consumption and physi-cal activity during leisure time). The ROC curve was used to determine the best BMI cutoff point for detection of hypertension. RESULTS: The prevalence of hypertension was 28.3%, being 33.5% among males, and 23.5% among females. After adjustment for BMI and potential confounding factors, waist circumference lost its association with the evaluated outcomes, and BMI alone accounted for hypertension (Prevalence ratio = 1.05, p = 0.001). The best cutoff point for BMI for males was 25.6 Kg/m2, and
for females, 25.7 Kg/m2. CONCLUSIONS:
The association observed between waist circumference and hypertension in several studies may be related to the lack of control of potential confounding factors in analy-ses, and to the fact that the effect of total body adiposity was not eliminated. Further investigations should be conducted in the Brazilian population to check true associa-tions among anthropometric indexes with several outcomes, also investigating the best cutoff points for such indexes.
KEY WORDS: Hypertension; Body mass index; Waist circumference.
INTRODUCTION
Obesity is a universal disease of growing prevalence that has been gaining alarming proportions, even in countries which, pa-radoxically, still suffer the effects of hunger and chronic malnutrition1. Studies have
widely shown that the increase in morbidity and mortality due to chronic-degenerative diseases is associated to excess weight, es-pecially to the deposit of abdominal fat2,3,
favoring the occurrence of cardiovascular events, particularly coronary events4.
There are many indirect methods that make it possible to accurately estimate the total quantity of body fat, as well as its dis-tribution, such as electrical bioimpedance, computerized tomography, dual energy x-ray absorptiometry (DEXA), magnetic resonance, and others. On the whole, these methods, although more accurate, are expensive and complex. To conduct epidemiological studies, the use of anthro-pometry has been recommended because it is a simple, easy-to-obtain, low-cost, and accurate method 5.
One of the most widely used indexes in the anthropometric evaluation of body composition is the Body Mass Index (BMI). Its broad dissemination is due to its capacity to express the energy reserves of individuals, ease to obtain, applicability, low correlation with height, and good correlation with body fat measures6.
As people differ in relation to body composition and location of fat (android or gynecoid patterns), the relation between BMI and morbidity risk may be affected, considering that the main complications of obesity are associated to greater accu-mulation of abdominal fat, regardless of body weight7.
Approximately 20% to 30% of the pre-valence of hypertension may be due to overweight or obesity8. Studies suggest that
The waist-hip ratio (WHR) and waist cir-cumference alone are the most widely used measures to estimate abdominal fat, espe-cially in epidemiological studies conducted in Europe, United States and in some Asian countries10. However, differences related
to body proportions and physical build of populations may lead to differences in the association that the waist circumference may have with abdominal adiposity 5. In this
manner, variations in the body composition of different ethnic groups may change the predictive power of this indicator.
There was an increase in the predictive value of waist circumference as a marker of fat location in the last decade; however, Brazilian studies are non-conclusive. Many studies conducted in Caucasian popula-tions show the utility of this indicator as a predictor of visceral fat, especially because it is a more easily obtainable measurement with lower operating cost than BMI7,11. On
the other hand, some studies have shown that, in the case of the Brazilian population, waist circumference may not be a good predictor of fat location, due to its high correlation with total fat12,13.
The objective of this investigation was to analyze the association between total fat (BMI) and body fat distribution (waist circumference) anthropometric markers and hypertension, after adjustment for potential confounding factors, and define the best cutoff point.
METHODS
This is a cross-sectional population-based study, with a probabilistic sample of adults living in the urban zone of the municipality of Cuiabá, MT, Brazil, between February 2003 and August 2004.
The sample size was calculated conside-ring the population of 474,458 inhabitants14,
with 20% hypertension prevalence in the adult population, 95% confidence interval, and estimation error of 2%, which resulted in a sample of 1531 households.
Households were selected through simple random sampling, stratified
pro-portionally by the population density of each macro-zone. Based on the listing of the census sectors that comprised the urban area of Cuiabá in 200014, the sample
was proportionally distributed per sector. Sectors where there were schools, military quarters, hospitals, hotels, and condos were excluded. Then, blocks were randomly drafted, after they had been numbered clockwise, from the face of the block, and finally the household to be visited. Only one dweller was interviewed, drafted from the dwellers aged between 18 and 74 years, so as to avoid information interdependence problems between interviewees. Bedridden or disabled individuals, pregnant women, and infants were also excluded. With the aim of assessing only adults (20 to 59 years), the final sample of this study was limited to 1298 individuals.
The collection of anthropometric data and blood pressure was carried out in hou-seholds by trained examiners with standar-dized procedures.
To take measurements in compliance with the techniques described by Lohman et al.15 (1988), individuals examined were
stan-ding, without shoes, feet together and arms straight alongside the body, looking ahead. Weight was recorded in Kg, measured with portable digital scales of the brand Plenna Litthium Digital, MEA – 08128 model, with capacity for 150 kg. Height was measured using a Seca portable height measuring unit, Body Metter 208 model.
Waist circumference was measured using a flexible and inextensible measure tape, of the brand Cardiomed, with accuracy of 0.1 cm, on the horizontal plane, at the level of the natural waist, that is, at the nar-rowest part between the iliac crest and the lowest rib. This point was chosen because it is considered the site that more accurately reflects visceral fat tissue16. The tape was
The measurement of blood pressure was done with a semi-automatic device (brand OMRON – HEM 705 CP). Each interviewee had his/her pressure measured twice, before and after answering the socio-demographic questionnaire, which took 30 minutes on average. This study used the values obtained in the second blood pressure measurement. Blood pressure was measured with the per-son sitting, with cuffs in adequate size to arm circumference, respecting the width/ length proportion of 1:2. This measurement was only taken after thirty minutes if the person examined had had coffee or smoked, or after five minutes of rest.
Individuals with systolic blood pressure (SBP) ≥ 140 mmHg and/or diastolic blood
pressure (DBP) ≥ 90 mmHg and those
using anti-hipertensive medication were considered hypertensive17. Individuals who
reported having hypertension and who controlled the disease with the use of low-sodium diet and exercise were also classified as hypertensive.
For BMI classification, the cutoff points recommended by the World Health Orga-nization were used18. Waist circumference
was analyzed based on the cutoff points in relation to the risk of developing metabolic complications, as suggested by the World Health Organization18.
Information about the practice of leisure time physical activity was obtained in the interview. Schooling was grouped accor-ding to years of education, adapted from IBGE (2000)14: 0 to 4 years, 5 to 7 years, 8 or
more years.
Smoking was measured as cigarettes/ day. Those who reported never having smoked cigarettes, ex-smokers, those who smoked regularly in the past but had com-pletely quit smoking for at least 30 days were categorized as nonsmokers. And those who reported currently smoking cigarettes, pipe or cigar were classified as smokers.
Alcohol consumption referred to the type, frequency and quantity of alcohol in-take, as expressed in grams of ethanol/day. The database was structured in the Epi-info 2000program with double entry
to correct inconsistencies. The statistical analysis used the programs EPI INFO 6.0 and STATA/SE version 9.0.
The dependent variable was the pre-sence or abpre-sence of systemic hypertension (SHT). The main explanatory variables were BMI and waist circumference.
Analysis of the correlation between anthropometric indexes was conducted using Pearson’s correlation coefficient. For an adjusted estimate of prevalence ratios, Poisson’s regression was used19 so as to
find the adjusted effects of the explanatory variables in the association between anthro-pometric markers and hypertension.
Although BMI and waist circumference variables were treated as categories in the bivariate analysis, they were entered in the regression model as continuous variables, with the aim of not loosing information. BMI and waist circumference variables were mutually adjusted in the regression model.
Analyses of ROC curves (Receiver Ope-rating Characteristic)were used to identify the best cutoff point and the discriminative power of anthropometric markers for the hypertension outcome. The areas under the ROC curve provided the global probability of an anthropometric marker classifying correctly the presence or absence of hyper-tension. The area under the ROC curve in the perfect test is equal to 1.0. If the 95% confidence interval of the area under the curve includes the value 0.50, it means that the performance of the test is no better than chance20.
This project was approved by the Ethics Committee of the University Hospital Júlio Muller, of Mato Grosso Federal University (Protocol # 063/2002). All participants signed a Free and Informed Consent Form.
RESULTS
Of the 1,298 individuals interviewed, 47.5% were male. The overall prevalence of hypertension was 28.3%, being 33.5% for males and 23.5% for females.
linear increase in the prevalence of hyperten-sion was observed with the increase of age (ρ
< 0.001). An inverse and linear association was detected between the prevalence of hy-pertension and schooling, in that individuals with up to 4 years of education presented a hypertension prevalence ratio approximately 1.6 times greater than individuals with 8 years
or more education (Table 1).
The association between the variables related to lifestyle and hypertension is also presented in Table 1. As to smoking, ex-smokers were found to present a hyperten-sion prevalence ratio about 1.5 times greater than non-smokers. The hypertension prevalence ratio was greater and statistically
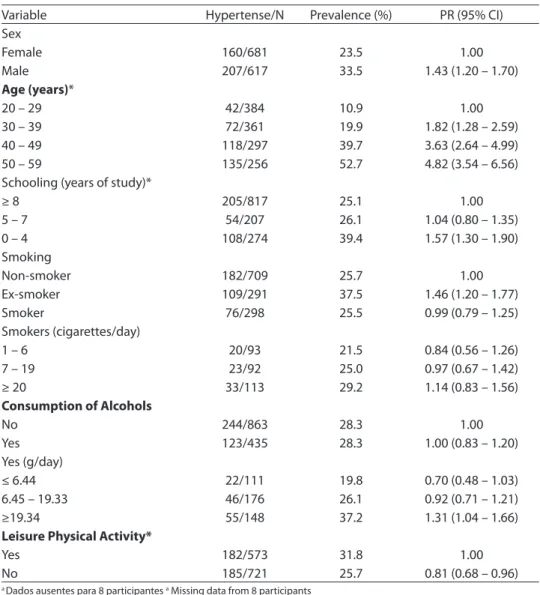
Tabela 1 - Prevalência de hipertensão, razão de prevalência (RP) e intervalo de coniança (IC 95%) segundo características sócio-econômicas e demográicas e relacionadas ao estilo de vida na população estudada, Cuiabá (MT), 2003 – 2004.
Table 1 - Prevalence of hypertension, prevalence ratio (PR) and conidence interval (95% CI) according to socio-economic and demographic factors and those related to the lifestyle of the population studied, Cuiabá (MT), 2003 – 2004.
Variable Hypertense/N Prevalence (%) PR (95% CI)
Sex
Female 160/681 23.5 1.00
Male 207/617 33.5 1.43 (1.20 – 1.70)
Age (years)*
20 – 29 42/384 10.9 1.00
30 – 39 72/361 19.9 1.82 (1.28 – 2.59)
40 – 49 118/297 39.7 3.63 (2.64 – 4.99)
50 – 59 135/256 52.7 4.82 (3.54 – 6.56)
Schooling (years of study)*
≥ 8 205/817 25.1 1.00
5 – 7 54/207 26.1 1.04 (0.80 – 1.35)
0 – 4 108/274 39.4 1.57 (1.30 – 1.90)
Smoking
Non-smoker 182/709 25.7 1.00
Ex-smoker 109/291 37.5 1.46 (1.20 – 1.77)
Smoker 76/298 25.5 0.99 (0.79 – 1.25)
Smokers (cigarettes/day)
1 – 6 20/93 21.5 0.84 (0.56 – 1.26)
7 – 19 23/92 25.0 0.97 (0.67 – 1.42)
≥ 20 33/113 29.2 1.14 (0.83 – 1.56)
Consumption of Alcohols
No 244/863 28.3 1.00
Yes 123/435 28.3 1.00 (0.83 – 1.20)
Yes (g/day)
≤ 6.44 22/111 19.8 0.70 (0.48 – 1.03)
6.45 – 19.33 46/176 26.1 0.92 (0.71 – 1.21)
≥19.34 55/148 37.2 1.31 (1.04 – 1.66)
Leisure Physical Activity*
Yes 182/573 31.8 1.00
No 185/721 25.7 0.81 (0.68 – 0.96)
a Dados ausentes para 8 participantes a Missing data from 8 participants b Dados ausentes para 8 participantes b Missing data from 4 participants c Dados ausentes para 3 participantes c Missing data from 3 participants
significant among individuals in the last tertile of ethanol consumption as compared to those who did not drink alcohol.
In this study, strong association between BMI and waist circumference was noted for both sexes. For males, correlations between these anthropometric markers were greater for individuals aged 37 years or more (r = 0.81, ρ < 0.001). For the group of women,
correlation between these variables was greater (r = 0.88, ρ < 0.001) among
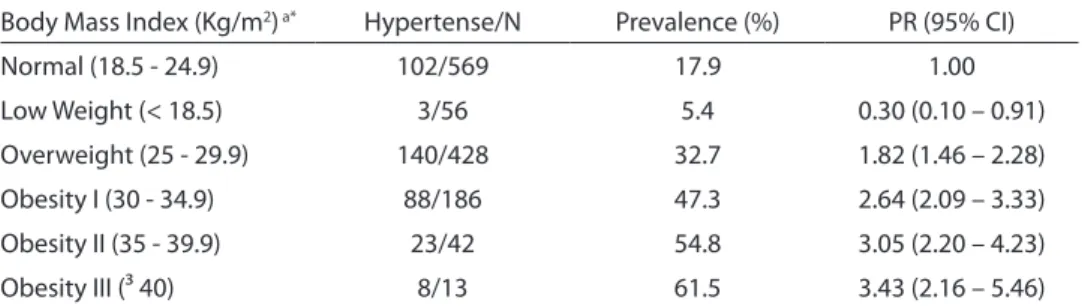
partici-pants who were aged less than 37 years. A direct linear association was observed between the prevalence of hypertension and total fat, as evaluated by BMI (Table 2). Individuals with grade III obesity presented hypertension prevalence ratio approxima-tely 3.4 times greater than that observed among normal individuals. Among overwei-ght individuals, this prevalence ratio was 1.8 times greater than among normal individu-als. The low-weight category presented a protective effect for hypertension.
As to fat location, men with very high waist circumference values were noted to present hypertension prevalence ratio 2.4 times greater as compared to normal waist circumference values, and this association was linear and direct. For women, the same trend was observed, with a greater associa-tion than that found among men (Table 3). In the non-adjusted analysis, BMI and
waist circumference were found to maintain the association with hypertension, when the brut prevalence ratio was analyzed (PR = 1.08; ρ < 0.001 and PR = 1.02; ρ < 0.001),
respectively. However, after adjusting for BMI and potential confounding factors (sex, age, schooling, smoking, alcohol consump-tion, and leisure physical activity), waist circumference lost its association with the target outcome, and only BMI remained associated to hypertension (PR = 1.05; ρ =
0.001) (Table 4).
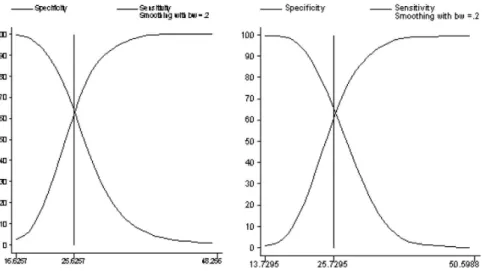
Figure 1 shows the curves of BMI sensitivity and specificity as predictors of hypertension, identifying the best cutoff points for both sexes. The best cutoff point for the detection of hypertension among men and women was similar (25.6 Kg/m2 for
men and 25.7 Kg/m2 for women). The BMI’s
discriminatory power for hypertension, as evaluated by the area under the ROC curve showed that its capacity to correctly classify the presence or absence of hypertension was approximately 68% for men and 69% for women. In both cases, the lower limit of the 95% CI did not reach the value 0.50.
DISCUSSION
Reverse causality is a possibility in this study, however, associations between body fat and anthropometric markers with
Tabela 2 - Prevalência de hipertensão arterial, razão de prevalência (RP) e intervalo de coniança (IC 95%) segundo a classiicação do índice de massa corporal na população estudada, Cuiabá (MT), 2003 – 2004.
Table 2 - Prevalence of hypertension, prevalence ratio (PR) and conidence interval (CI 95%) according to the classiication of body mass index in the population studied, Cuiabá (MT), 2003-2004.
Body Mass Index (Kg/m2) a* Hypertense/N Prevalence (%) PR (95% CI)
Normal (18.5 - 24.9) 102/569 17.9 1.00
Low Weight (< 18.5) 3/56 5.4 0.30 (0.10 – 0.91)
Overweight (25 - 29.9) 140/428 32.7 1.82 (1.46 – 2.28)
Obesity I (30 - 34.9) 88/186 47.3 2.64 (2.09 – 3.33)
Obesity II (35 - 39.9) 23/42 54.8 3.05 (2.20 – 4.23)
Obesity III (³ 40) 8/13 61.5 3.43 (2.16 – 5.46)
a Dados ausentes para 4 participantes a Missing data from 4 participants
hypertension have been shown in many stu-dies21,22 controlling confounding variables
for these associations.
This study found a prevalence of 28.3% hypertensive individuals. Population-based surveys conducted in some cities in Brazil show prevalence rates for hypertension (≥140/90 mmHg) ranging between 22.3%
and 44.0%, considering differences in age distribution and social level of the groups investigated17.
A statistically significant increase in the prevalence of hypertension was observed with the increase in age, in concordance
with other authors, among both men and women23.
Higher hypertension prevalence rates were found in lower schooling individuals (4 years or less). Low schooling has been pointed as one of the most important factors associated to hypertension, with prevalence ratios between 1.4 and 7.3 in the comparisons between illiterate people and those with university education24. The study
conducted by Freitas et al.25 (2001) showed
a high prevalence of SHT in the group that had less schooling (49.5%), thus confirming the findings of this study.
Tabela 3 - Prevalência de hipertensão arterial, razão de prevalência e intervalo de coniança (IC 95%) segundo a classiicação da circunferência da cintura de acordo com o sexo, Cuiabá (MT), 2003 – 2004.
Table 3 - Prevalence of hypertension, prevalence ratio (PR) and conidence interval (CI 95%) according to the classiication of the waist circumference according to sex, Cuiabá (MT), 2003-2004.
Variable Hypertense/N Prevalence (%) PR (95% CI)
Male
Waist circumference (cm) a*
Normal (< 94) 98/413 23.7 1.00
High (94 - 102) 53/105 50.5 2.13 (1.65 – 2.75)
VeryHigh (≥ 102) 55/95 57.9 2.44 (1.91 – 3.11)
Female
Waist circumference (cm) b*
Normal (< 80) 30/299 10.0 1.00
High (80 – 88) 37/155 23.9 2.81 (1.61 – 4.93)
VeryHigh (≥ 88) 92/224 41.1 4.09 (2.82 – 5.95)
a Dados ausentes para 4 participantes a Missing data from 4 participants b Dados ausentes para 3 participantes b Missing data from 3 participants
* ρ < 0,001 (associado ao teste do Qui-Quadrado para tendência linear) * ρ < 0,001 (associated to chi-square for linear trend)
Tabela 4 - Razão de Prevalência (RP) bruta e ajustada entre os indicadores antropométricos e hipertensão arterial, Cuiabá (MT), 2003 – 2004 (n = 1.278)*.
Table 4 - Gross and adjusted prevalence ratio (PR) between anthropometric indicators and hypertension, Cuiabá (MT), 2003-2004 (n = 1,278)*.
Variable PR gross 95% CI PR adjust1 95% CI
Body Mass Index (Kg/m2) 1.08 1.06 – 1.10 1.05 1.02 – 1.08
Waist circumference (cm) 1.02 1.02 – 1.03 1.00 1.00 – 1.01 11 Ajustado por sexo, idade, escolaridade, tabagismo, consumo de bebida alcoólica e atividade física no lazer.
1 Adjusted for sex, age, education, smoking, alcohol consumption and physical activity during leisure time.
* Apenas 1.278 indivíduos apresentaram todos os dados que entraram no modelo desta regressão. Aqueles para os quais não se tinha informação sobre qualquer uma das variáveis do modelo foram excluídos da análise.
In the study mentioned above, indivi-duals belonging to the last tertile of ethanol consumption presented a hypertension prevalence ratio 1.31 times greater than the group of people who did not drink alcohol. Research has shown that excessive alcohol consumption is one of the factors accoun-ting for increase in blood pressure levels26,27.
Probably, the direct association obser-ved in this study between physical activity and hypertension may be the result of the reverse causality very common in cross-sectional studies, as the harmful role of sedentism is well documented in the lite-rature as contributing to the increase of the prevalence of non-transmissible chronic diseases, including hypertension28.
This study found a positive and linear association (p<0.001) between the incre-ase in BMI and waist circumference with hypertension. This result has been found both in prospective and cross-sectional studies, in many populations, independent of age29, showing that excess fat tissue is
one of the main risk factors associated to hypertension.
These studies confirm the importance of excess total weight and accumulation of vis-ceral fat in the prevalence of hypertension. However, the anthropometric indicators most widely used in epidemiological studies (BMI, waist circumference and waist-hip ra-tio) may not reflect the same risk in different populations. The existence of differences in the relation between body fat and BMI and/ or waist circumference in different popula-tions is already well established. This ha-ppens partly due to the influence of factors such as race and age in body composition, as well as due to differences in food intake and physical activity pattern5. These
diffe-rences modulate the degree of association between anthropometric indicators and cardiovascular risk factors.
Very few studies have presented ad-justed estimates of the relation between anthropometric markers and hypertension. In this study, the waist circumference lost its explanatory power for hypertension after the removal of the effect of total fat, as evaluated by BMI.
Harris et al.21 (2000) showed that the
Figura 1 - Índice de massa corporal e hipertensão arterial: sensibilidade, especiicidade e melhor ponto de corte, discriminados por sexo, Cuiabá (MT), 2003 – 2004.
Figure 1 - Body mass index and hypertension: sensitivity, speciicity and best cutof point, presented by sex, Cuiabá (MT), 2003-
odds ratio between the first and last quin-tiles of waist abdominal in men, which was 3.06, became 1.33 after adjusting for BMI. Among women, these values went from 5.4 to 3.04. These results may be explained, at least partly, by the high correlation observed between these two body fat markers.
The findings of this study agree with other Brazilian studies that evaluated the predictive capacity of anthropometric ma-rkers with relation to outcomes associated cardiovascular risk. In a population-based study conducted in the city of Rio de Ja-neiro22, the high correlation between BMI
and waist circumference was clear, and the waist-hip ratio was less correlated to total fat. The authors concluded that, waist-hip ratio could predict hypertension more effectively than waist circumference alone.
The possible limitation of this study was the lack of information about the hip circumference. This would have permitted evaluating the association between waist/ hip ratio and hypertension, as this indica-tor seems to have better predictive power in evaluation of the association between fat locationand the outcomes related to chronic diseases in the Brazilian population.
Lemos-Santos et al.12 (2004) tested the
hypothesis that the waist circumference could predict the lipid profile of a popula-tion male blood-donors, independently of the explanatory power of total fat, evaluated by BMI and fat percentage. A high correla-tion between BMI and waist circumference was observed (r = 0.90 and 0.83, for the younger and older, respectively). The waist-hip ratio showed more independent, with less association with BMI (r = 0.52 and 0.40, for the younger and older, respectively). The authors concluded that the waist-hip ratio alone could predict the relation high HDL/cholesterol, an important factor for cardiovascular risk.
In this study, only BMI presented pre-dictive capacity for hypertension, after adjustment for important confounding fac-tors. The best cutoff points of this indicator showed to be similar to the recommenda-tions of the World Health Organization18.
Pitanga and Lessa13 (2005) in Salvador-BA
found similar BMI values in a study in which high coronary risk was the outcome (24.0 Kg/m2 for men and 26.0 Kg/m2 for women).
FINAL CONSIDERATIONS
It is noted that in Brazil, well-controlled studies evaluating the performance of in-dicators of fat location in the detection of chronic diseases have failed to show asso-ciations between waist circumference and outcomes related to cardiovascular risk. This study confirms this result, showing that it is still necessary to improve investigations in this field.
It is possible to conclude that the im-portance of identifying individuals at risk of presenting hypertension and other metabo-lic disorders related to diet and obesity and the operational simplicity of the indicator BMI stress the relevance of using the cutoff points recommended by the WHO16 (1998)
as part of the strategies of public health programs meant to prevent and control overweight in adults. This recommenda-tion is considered important, although the association found between BMI and hyper-tension, in this study, has been small, after adjusting for other well-established risk factors for hypertension.
Acknowlegements
Larissa Silva Barbosa received a master’s grant from the National Council of Scientific and Technological Development (CNPQ).
Contributors
Barbosa LS participated in the collec-tion, analysis and interpretation of the data as well as in the drafting of this paper. Scala LCN participated directly in the design of the study and in the writing of this paper. Ferrreira MG participated in the analysis and interpretation of data, preparation and review of the final version of this paper.
REFERENCES
1. Monteiro CA, Conde WL, Popkin BM. Is obesity replacing or adding to undernutrition? Evidence from different social classes in Brazil. Public Health Nutr 2002; 5(1A): 105-12.
2. Haffner SM. Abdominal adiposity and cardiometabolic risk: do we have all the answers? Am J Med 2007; 120(9): S10-6.
3. Nestel P, Lyu R, Low LP, Sheu WH, Nitiyanant W, Saito I et al. Metabolic syndrome: recent prevalence in East and Southeast Asian populations. Asia Pac J Clin Nutr 2007; 16(2): 362-7.
4. Okosun IS, Liao Y, Rotimi CN, Prewitt E, Cooper RS. Abdominal adiposity and clustering of multiple metabolic syndrome in white, black and Hispanic Americans. Ann Epidemiol 2000; 10: 263-70.
5. World Health Organization. Physical Status: The Use and Interpretation of Anthropometry. Geneva; 1995 (WHO - Technical Report Series 854).
6. Stevens J, Cai J, Evenson KR, Thomas R. Fitness and fatness as predictors of mortality from all causes and from cardiovascular disease in men and women in the lipid research clinics study. Am J Epidemiol 2002; 156: 832-41.
7. Visscher TL, Seidell JC. Time trends (1993-1997) and seasonal variation in body mass index and waist circumference in the Netherlands. Int J Obes Relat Metab Disord 2004; 28(10): 1309-16.
8. Millen BE, Fada PA, Quatromoni MS et al. Validation of a dietary pattern approach for evaluating nutritional risk: the Framingham Nutrition Studies. Jr Am Diet Assoc 2001; 101: 187-94.
9. De Simone G, Devereux RB, Chinali M, Roman MJ, Best LG, Welty TK, Lee ET, Howard BV. Strong Heart Study Investigators. Risk factors for arterial hypertension in adults with initial optimal blood pressure: the Strong Heart Study. Hypertension 2006; 47(2): 162-7.
10. Zhu SK, Wang ZM, Heshka S, Heo M, Faith MS, Heymsfield S. Waist circumference and obesity-associated risk factors among whites in the National Health and Nutrition Examination Survey: clinical action thresholds. Am J Clin Nutr 2002; 76: 743-9.
11. Poirier P, Lemieux I, Mauriège P, Dewailly E, Blanchet C, Bergeron J et al. Impact of Waist Circumference on the Relationship between Blood Pressure and Insulin: The Quebec Health Survey. Hypertension 2005; 45: 363-367.
12. Lemos-Santos MGF, Valente JG, Gonçalves-Silva RMV, Sichieri R. Waist circumference an waist-to-hip ratio as predictors of serum concentration of lipids in Brazilian men. Nutrition 2004; 20(10): 857-62.
13. Pitanga FJG, Lessa I. Indicadores antropométricos de obesidade como instrumento de triagem para risco coronariano elevado em adultos na cidade de Salvador - Bahia. Arq Bras Cardiol 2005; 85(1): 26-31.
14. IBGE - Instituto Brasileiro de Geografia Estatística – Censo demográfico do Brasil. Rio de Janeiro; 2000.
15. Lohman TG, Roche AF, Martorell R. Anthropometric Standardization Reference Manual. Illinois: Human Kinetics Books; 1988.
16. Wang J, Thornnton JC, Bari S, Williamson B, Gallagher D, Heymsfield SB, et al. Comparisons of waist
circumferences measured at 4 sites. Am J Clin Nutr 2003; 77(2): 379-84.
17. Sociedade Brasileira de Hipertensão, Sociedade Brasileira de Cardiologia e Sociedade Brasileira de Nefrologia. V Diretrizes Brasileiras de Hipertensão Arterial. Hipertensão 2006; 9(4): 126-156.
18. World Health Organization. Obesity: Preventing and Managing the Global Epidemic. Geneva; 1998. (WHO - Technical Report Series 894).
19. Barros AJ, Hirakata VN. Alternatives for logistic regression in cross-sectional studies: an empirical comparison of models that directly estimate the prevalence ratio. BMC Med Res Methodol 2003; 3: 21.
20. Hanley JA, Mcneil BJ. The meaning and use of the area under a receiver operating characteristic (ROC) curve. Radiology 1982; 143: 29-36.
21. Harris MM, Stevens J, Thomas N, Schreiner P, Folsom AR. Associations of fat distribution and obesity with hypertension in a bi-ethnic population: the ARIC study. Atherosclerosis Risk in Communities Study. Obes Res 2000; 8(7): 516-24.
22. Pereira RA, Sichieri R, Marins VMR. Razão cintura/ quadril como preditor da hipertensão arterial. Cad Saúde Pública. 1999;15(2):333-44.
23. Mill JG, Molina MC, Silva IO, Marquezini AJ, Ferreira AVL, Cunha RS, Herkenhoff FL. Epidemiologia da hipertensão arterial na cidade de Vitória, Espírito Santo. Hipertensão 2004; 7(3): 109-16.
24. Ortega KC, Jr Mion D, Nobre F. Hipertensão Arterial. In: Jr Mion D, Nobre F. Risco Cardiovascular Global. São Paulo: Lemos Editorial; 1999. p. 65-76.
25. Freitas OC, Carvalho FR, Neves JM, Veludo PK, Parreira RS, Gonçalves RM, et al. Prevalência da hipertensão arterial sistêmica na população urbana de Catanduva, São Paulo, Brasil. Arq Bras Cardiol 2001; 77 (1): 9-15.
27. Stranges S, Notaro J, Freudenheim JL, Calogero RM, Muti P, Farinaro E et al. Relationship of alcohol drinking pattern to risk of hypertension: a population-based study. Hypertension 2004; 44: 813-19.
28. Conceição TV, Gomes FA, Tauil PL, Rosa TT. Valores de pressão arterial e suas associações com fatores de risco cardiovascular em servidores da Universidade de Brasília. Arq Bras Cardiol 2006; 86(1): 26-31.