1. Exercise Physiology Laboratory (LABOFISE) – Department of Bioscienc-es and Physical Activity – Rio de Janeiro Federal University (UFRJ) – Rio de Janeiro.
Received in 11/11/03. 2nd version received in 26/4/04. Approved in 30/4/04. Correspondence to: Fernando A.M .S. Pompeu, Av. Brigadeiro Trompow ski, 212, Cidade Universitária, Ilha do Fundão – 21941-590 – Rio de Janeiro, RJ. Fax: (21) 2562-6801, e-mail: [email protected]
Arm cross-section areas: technical implications
and applications for body composition and
maximal dynamic strength evaluation
Fernando A.M .S. Pompeu1,Daniele Gabriel1, Bianca Gama Pena1 and Pedro Ribeiro1
O
RIGINALA
RTICLEKey w ords: Upper-arm muscle area. Upper-arm fat percentile area. Body adiposity.
Limbs and trunk maximal strength. Bench press. ENGLISH VERSION
ABSTRACT
Arm muscular tissue and fat ring areas can be evaluated by an-thropometric measures. The objective of this study w as to investi-gate the application of one technique that infers these areas to estimate body adiposity and the maximal strength of upper limbs and trunk, as w ell as its objectivity. For that, a sample of 40 healthy men (25 ± 6 years; 72.6 ± 9.4 kg) w as divided in tw o groups: VI (n = 30) internal validation and VE (n = 10) external validation. It w as determined to VI the muscle area (AM B), fat absolute area (AGB) and fat percentile upper-arm area (APB) using the values of circumfer-ence and triceps skinfold, as w ell as the sum of seven and eight skinfold thickness (Σ8DC) and the maximal w eight lifted in bench press (1-RM ) by tw o evaluators separately (A and B). In VE only AM B and 1-RM w ere obtained. M ultiple and simple regression anal-yses and Student t-test w ere applied (α≤ 0.05). The variance of
Σ8DC w as explained in 93% (EPE = 14.6 mm) from AGB and w eight, the AM B explained in 66% (EPE = 9 kg) of the 1-RM variance by itself and there w as no significant difference betw een the maxi-mal w eight measured and predicted in VE group. Satisfactory intr-aclass correlations betw een the evaluators to AM B (ICC = 0.99),AGB (ICC = 0.96) and ATB (ICC = 0.99) w ere also found. Therefore it may be concluded that the anthropometric technique that infers mus-cle and fat upper-arm areas can be used w ith good agreement betw een evaluators to estimate body adiposity and upper limbs and trunk strength.
INTRODUCTION
Several valid and precise techniques(1,2) to infer body composi-tion have been developed. These quantificacomposi-tions depend on com-plex and expensive laboratorial procedures. In face of these diffi-culties, the accurate study of body composition is yet infeasible or imprecise for a large number of professional from the sports area. The development of simpler, less expensive and precise techniques becomes necessary for field applications. One of the techniques may be the estimation of the fat tissue and the upper arm muscle mass. These inferences are based on anthropometric measures that enable both the resolution of problems related to body adipos-ity as w ell as problems related to muscular strength(2).
Himes et al.(3) suggested that the inference technique of tissue areas is effective for the prediction of the body fat absolute w eight; how ever, this technique w ould be ineffective for the estimation of the body density and fat percentile. Until this moment, no similar study w as performed w ith the Brazilian population. These studies are necessary, once the anthropometric inferences of the body
composition are population-specific. Thus, doubts w ith regard to the employment validity of the fat percentile upper-arm area for the estimation of the body adiposity still remain.
The inference anthropometric technique of the muscular area and upper-arm fat proceeds from abstractions derived from calcu-lations of concentric circle areas. How ever, as the arm is not a perfect cylinder, the fat distribution around it is not homogeneous. Thus, this technique may not be satisfactorily precise. Also consid-ering that the variation betw een evaluators for the skinfold tech-nique on the estimation of the body adiposity may exceed 200%(4), the validity and objectivity study of the arm tissue areas determi-nation technique is relevant.
The accurate estimation of the upper-arm muscular area should present a good relation w ith the maximal voluntary strength (FVM )(5). For the measure of the FVM , the free bench press exercise may be employed. The maximal load lifted once (1-RM ) in this exercise presents high correlation w ith the same test performed for other muscular groups of trunk and upper limbs(6). In the practical appli-cation field, the FVM indirect estimation may minimize the risks of articular and muscular lesions, besides other possible injuries dur-ing the performance of maximal load tests in muscular exercise gyms.
This study, therefore, had as objectives: a) to determine and to evaluate the relation betw een the upper-arm fat area (AGB) and oth-er anthropometric variables such as the body adiposity (Σ8DC); b) to verify if the inclusion of the biceps skinfold thickness in the calcu-lation of the AGB improves the relation of this area w ith body adi-posity; c) to evaluate the relation betw een upper-arm muscular area (AM B) and trunk and upper limbs strength; and d) to assess the subjectivity of the technique on the inference of the upper-arm muscular area (AM B) and upper-arm fat area (AGB).
M ETHODS
Forty healthy male individuals and students from the Physical Education course (EEFD/UFRJ) w ho had experience on counter-resistance exercises w ere volunteers in this study. These individu-als w ere randomly divided into tw o groups namely: VI (n = 30), internal validation, and VE (n = 10), external validation. Each indi-vidual signed a consent form in w hich all procedures adopted as w ell as the possible risks w ere described.
Anthropometry
w ere measured according to Gordon et al.(8). For the tw o last mea-sures, a mechanical balance (FILIZOLA®, Br), for the arm
circum-ference, a metallic measure tape (SANNY®, Br) and for the
skin-folds, a skinfold caliper (LANGE®, USA) w ere used.
The body adiposity w as estimated through the sum of skinfold thickness mentioned above. The biceps and triceps (Σ7DC) skinfolds w ere not employed in this calculation but only the triceps skinfold thickness (Σ8DC), w hen the tw o first w ere included in the calcula-tion of the upper-arm segment area.
Calculation of the arm cross-section area (ATB) and its com-ponents
The calculation of ATB, AM B, AGB and APB, w as based on proce-dures described by Frisancho(9,10), thus:
ATB = C2÷ (4 x π) (Eq. 1) w here:
ATB = arm total cross-section (cm2) C = arm circumference (cm)
The arm muscular area (AM B) is calculated as follow s:
AM B = [C – (T x π)]2÷ (4 x π) (Eq. 2) w here:
AM B = arm transversal muscular area (cm2) C = arm perimeter (cm)
T = triceps skinfold (cm)
The arm fat area (AGB) w as calculated as follow s:
AGB = ATB – AM B (Eq. 3) w here:
AGB= arm fat transversal area (cm2) ATB = arm total transversal area (cm2) AM B = arm muscular transversal area (cm2)
Finally, the arm fat percentile area (APB) w as calculated as fol-low s:
APB = (AGB÷ ATB) x 100 (Eq. 4) w here:
APB = arm fat percentile area (% ) AGB = arm fat transversal area (cm2) ATB = arm total transversal area (cm2)
In this study, the sumof triceps and biceps skinfold measures w ere also applied for the determination of AM B. When this proce-dure w as performed, these tw o measures w ere not applied in the sum of skinfold measures in order to represent the body adiposity.
M aximal voluntary strength test
The equipments used for the test of a maximal repetition (1-RM ) w ere: a bench w ith a bar support; other bench for feet sup-port; a long-bar dumbbell (HBL) and free w eights (WEIDER®,USA).
The last tw o equipments w ere previously w eighted w ith the ob-jective of confirming the w eight announced by the manufacturer. Prior to the beginning of tests, a specific w arm-up in the region to be put in motion w as performed. Later, the executions of some repetitions only w ith the bar w ere employed for the exercise rec-ognition and corrections. The exercise requested consisted of lift-ing the HBL held up at the shoulders w idth w ith hands in pronation up to the xiphoid process and to elevate it once again up to the elbow complete extension. Three attempts w ere allow ed for the determination of the maximal load, employing the tw o-minute in-terval for recovery betw een attempts.
Statistical analysis
The descriptive statistics w ith average and standard deviation and the Student t-test for independent samples w ere employed for the comparison betw een groups. For the VE group, the paired Student t-test w as employed in order to compare the result of the
1-RM measured to the result predicted from the formula deduced for group VI. For the study of the objectivity of AM B, AGB and ATB and for the inclusion of the biceps skinfold in the method, the multiple and linear regression analysis and the calculation of the coefficient of the intraclass correlation (ICC) w ere employed. The level of sig-nificance adopted in this study w as α ≤ 0.05. The calculations for this study w ere performed w ith the SPSS for Window s®
applica-tive.
RESULTS
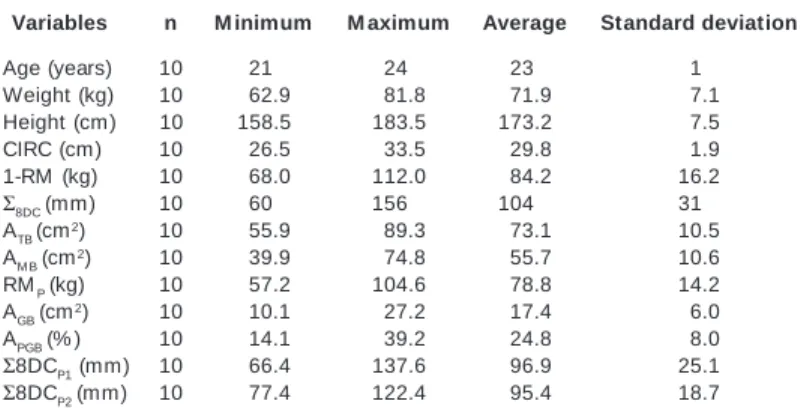
No significant differences betw een the anthropometric variables and the load of 1-RM of groups VI and VE (tables 1 and 3) w ere observed. A matrix of correlation for the parameters studied in group VI w as presented in table 2. The body adiposity, determined through the eight skinfold thickness, w as explained in 84% by the arm fat area (figure 1). This prediction may be improved through the inclu-sion of the variable w eight, w hat increased the determination cor-relation up to 88.2% (Eq. 5). The inclusion of other variable did not improve this model significantly.
Σ8DC = – 22.477 + 3.505 (AGB) + 0.786 (w eight) (Eq. 5) r = 0.93 and EPE = 14.6 mm
Applying the equation above (Eq. 5) for data from group VE, non-significant differences w ere observed betw een values measured (104.1 ± 31.3 mm) and predicted (95.4 ± 18.7 mm).
The inclusion of the biceps skinfold (AGBTB) did not improve sig-nificantly (n = 30, r = 0.90, EPE = 16 mm, Σ7DC = 23.972 + 3.974A
G-BTB) the predicting pow er of the sum of seven skinfold thickness
TABLE 1
Anthropometric data from internal validity group (VI)
Variables n M inimum M aximum Average Standard deviation
Age (years) 30 018 045 025 06 Weight (kg) 30 052.9 094.6 072.7 10.0 Height (cm) 30 161.5 197.0 173.8 08.0 CIRC (cm) 30 024.0 034.5 030.3 02.6 1-RM (kg) 30 050.0 112.0 081.6 15.6
Σ8DC (mm) 30 040 184 089 38 Σ7DC (mm) 30 038 175 085 38
ATB (cm2) 30 045.8 094.7 073.5 12.5
AM B (cm2) 30 041.1 082.1 057.9 09.3
AGB (cm2) 30 004.7 038.2 015.6 08.3
APGB (% ) 30 009.9 041.7 020.5 08.7
Where: CIRC = arm circumference, 1-RM = one maximal repetition in free bench press, Σ7DC =
sum of subscapular, suprailiac, abdomen, axillary, chest, thigh and leg skinfolds, Σ8DC = sum of
subscapular, suprailiac, abdomen, axillary, chest, thigh and leg skinfolds, ATB = arm total area, AM B
= arm muscular area, AGB = arm fat area and APGB = arm fat percentile area.
TABLE 2
Correlation matrix for data from group VI
Age Weight Height CIRC 1-RM ΣΣΣΣΣ7DC ΣΣΣΣΣ8DC ATB AM B AGB APGB
Age 1.00 0.20 –0.27 0.30 –0.11 –0.33 –0.32 –0.33 –0.13 –0.34 –0.23 Weight 1.00 –0.51* * 0.71* * –0.24 –0.72* *–0.74* *–0.71* *–0.33 –0.69* *–0.60* *
Height –1.00 0.00 –0.04 –0.10 –0.12 –0.00 –0.04 –0.05 –0.07 CIRC 1.00 –0.62* *–0.61* *–0.62* *–0.99* *–0.75* *–0.66* *–0.48* *
1-RM –1.00 –0.09 –0.11 –0.60* *–0.81* *–0.01 –0.15
Σ7DC –1.00 –0.99
* *–0.61* *–0.01 –0.90* *–0.87* *
Σ8DC –1.00 –0.62* *–0.01 –0.92* *–0.88* *
ATB –1.00 –0.74* *–0.67* *–0.48* *
AM B –1.00 –0.00 –0.22
AGB –1.00 –0.97* *
APGB –1.00
* * Significant correlation for the level of 0.01 (2-talhada). CIRC = arm circumference, 1-RM = one maximal repetition in free bench press, Σ7DC = sum of subscapular, suprailiac, abdomen, axillary,
chest, thigh and leg skinfolds, Σ8DC = sum of subscapular, suprailiac, abdomen, axillary, chest,
thigh and leg skinfolds, ATB = arm total area, AM B = arm muscular area, AGB = arm fat area and APGB
(Σ7DC). The data predicted for Σ7DC (106 ± 39 mm) from AGBTB w ere significantly higher; how ever, these values presented strong asso-ciation (r = 0.99).
When data from all subjects (n = 40) measured by tw o evalua-tors (A and B) are compared to each other, a non-significant differ-ence w as observed for ATB (A = 73.3 ± 12.0 cm2 and B = 72.9 ± 11.8 cm2). This parameter presented good correlation betw een evaluators (ICC = 0.99, EPE = 3.20 cm2, y = 2.12 + 0.977x). How -ever, a small but significant difference betw een evaluators for AM B (A = 57.7 ± 9.9 cm2 and B = 57.0 ± 10.3 cm2) w as observed. This area (AM B) w as also strongly associated betw een evaluators (ICC = 0.99, EPE = 2.11 cm2, y = 11.208 – 0.110x). Finally, the A
GB w as not different betw een evaluators (A = 15.5 ± 8.0 cm2 and B = 15.9 ± 7.2 cm2) and also presented correlated measures (ICC = 0.96, EPE = 8.01 cm2, y = 7.280 – 0.110x).
In figure 2, it is observed that the AM B presented good correla-tion w ith the load of 1-RM test in the free bench press exercise for group VI (r = 0.81). The application of the equation presented in this figure for data from group VE did not generate results signifi-cantly different betw een loads measured (84.2 ± 18.3 kg) and pre-dicted (78.8 ± 14.2 kg). These measured and prepre-dicted values (1-RM ) w ere w ell correlated (r = 0.80). The arm m uscular area estimated w ith the inclusion of the biceps skinfold (AM BBT) w as sig-nificantly smaller (52.7 ± 9.4 cm2). The data derived by both meth-ods (AM B and AM BBT) presented strong correlation (r = 0,97). The predicting capacity of 1-RM from the application of AM BBT w as not improved (r = 0.78, EPE = 10.0 kg, 1-RM = 13.488 + 1.293 AM BBT).
DISCUSSION
The several methods proposed for the estimation of the body adiposity through anthropometric variables generally use diame-ters, circumferences, height of limbs and skinfold thickness. De-spite the large number of anthropometric techniques for the study of the body composition, studies correlating specifically fat area of a segment w ith body adiposity for the Brazilian population w ere not found. It seems possible to expect a satisfactory predicting pow er of body adiposity from technique for the segment study, once the incidence of the gynoid fat distribution is prevalent in w omen and android in men. This hypothesis may be confirmed through results of the present study, w hich suggest w ith good external validity that the AGB combined w ith w eight may be em-ployed in the estimation of the body adiposity. The modification of this technique through the inclusion of the biceps skinfold thick-ness did not improve the relation mentioned above. The arm
mus-cular area may also be employed for the estimation of the maximal voluntary strength. In the present w ork, a good external validity for the relation betw een the load of 1-RM in the free bench press exercise and the AM B w as observed. The parameters of the arm fat and muscular areas may be estimated w ith satisfactory error be-tw een evaluators.
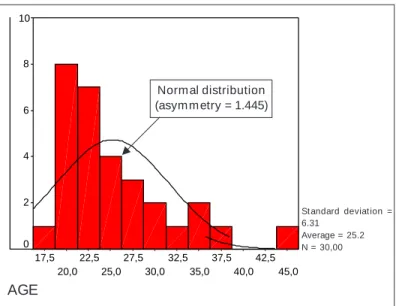
The proportion betw een body tissues is changed w ith the age(8,9,11). The subcutaneous fat tissue increases w ith the aging(12,14). Based on this phenomenon, in the second half of the 70th decade, Pollock et al.(15,16) suggested different equations for the prediction of the body density of w omen and men from different age ranges. In this procedure, the overestimation of the body density values of older individuals w as corrected, including the age in years in the regression equation. Jackson et al.(17) and Guedes(18) performed the same correction in their methods and achieved excellent results for the estimation of the body density. M ore recently(19), a high accuracy on the estimation of the body adiposity w as reported from the use of skinfold thickness compared to the method of neutron activation analysis and tritium dilution, w hen individuals w ere di-vided by age ranges. Therefore, it is expected that age plays a relevant role as independent variable. How ever, in the present study, age has not contributed to improve the relation betw een AGB and the sum of skinfold thickness. It is observed that the age distribu-tion of subjects from this study w as not gaussian, being a positive asymmetry distribution curve (figure 3). Such asymmetry may have reduced the importance of this criterion as predictor.
The estimation error of adiposity through the arm tissue areas method w as close to error observed in studies of the body compo-sition. For such comparison, due to the difference on the units adopted (g/mm3, % , kg or cm2), the EPE of the method w as divid-ed by the average of the group studidivid-ed; this allow divid-ed announcing the EPE as average percentage. The EPE announced so w as sim-ilar to EPE found in literature(16,20,21) for estimations of the body composition. Durnin and Womersley(22) and Baumgartner et al.(23) found indexes (EPE) of 22% and 25-30% of the average for the
y = 4,158x + 24,475 R2
= 0,8396
30 45 60 75 90 105 120 135 150 165 180 195
0 5 10 15 20 25 30 35 40 45
8DC Linear (8DC)
Fig. 1 – Dispersion diagram betw een body adiposity (Σ8DC) and arm fat area (group VI)
Sum
of 8 s
kinfolds
(m
m
)
Arm fat area (cm2)
y = 1,3606x + 2,7527 R2 = 0,6612
50 60 70 80 90 100 110 120
40 50 60 70 80 90
1-RM Linear (1-RM)
Fig. 2 – Dispersion diagram betw een arm muscular area and load in 1-RM
test (group VI)
Arm muscular area (cm2)
1-R
M
benc
h pres
s
(kg)
TABLE 3
Anthropometric data from external validation group (VE)
Variables n M inimum M aximum Average Standard deviation
Age (years) 10 021 024 023 01 Weight (kg) 10 062.9 081.8 071.9 07.1 Height (cm) 10 158.5 183.5 173.2 07.5 CIRC (cm) 10 026.5 033.5 029.8 01.9 1-RM (kg) 10 068.0 112.0 084.2 16.2
Σ8DC (mm) 10 060 156 104 31
ATB (cm2) 10 055.9 089.3 073.1 10.5
AM B (cm
2) 10 039.9 074.8 055.7 10.6
RMP (kg) 10 057.2 104.6 078.8 14.2
AGB (cm
2) 10 010.1 027.2 017.4 06.0
APGB (% ) 10 014.1 039.2 024.8 08.0 Σ8DCP1 (mm) 10 066.4 137.6 096.9 25.1 Σ8DCP2 (mm) 10 077.4 122.4 095.4 18.7 CIRC = arm circumference, 1-RM = one maximal repetition in free bench press, Σ7DC = sum of
subscapular, suprailiac, abdomen, axillary, chest, thigh and leg skinfolds, Σ8DC = sum of
subscapu-lar, suprailiac, abdomen, axillary, chest, thigh and leg skinfolds, ATB = arm total area, AM B = arm
muscular area, AGB = arm fat area, APGB = arm fat percentile area, Σ8DCP1 = sum of 8 skinfolds
prediction of fat in men, employing the hydrostatic w eighting and the bioelectrical impedance techniques, respectively.
Heymsfield et al.(24) studied the possibility of improving the in-ference technique of AGB, suggested by Frisancho(10,11) and Katch and Hortobagyi(25). Those authors demonstrated that half of the triceps skinfold underestimates the subcutaneous fat tissue radi-us w hen determined through computerized tomography. De Kon-ing et al.(26) used the sum of the biceps and triceps skinfolds thick-ness to infer AM B and AGB determ ined by anthropom etry and computerized tomography and found results similar to results from the first study(24). The last study(26) demonstrated that the area cal-culated through the anthropometric technique underestimated the measure through tomography. In face of such considerations, and considering the present results, the inclusion of the biceps skin-fold measure seems not to improve the method.
The variance of the maximal voluntary strength of trunk and up-per limbs w as explained in 66% through AM B. Other studies also observed correlation betw een cross-section muscular area w ith 1-RM in men(27,28). In a study(25), a correlation of A
M B for men and w omen w as proposed, comparing values obtained through com-puterized tomography to values estimated through anthropome-try. Such results are based on the hypothesis that the strength of a given muscle is proportional to its cross-sectional area(5,29,30). Thus, besides the technique error(31), it is likely that the involvement of other muscles in the exercise may have affected the FVM predic-tion. The specific tension values (TESP) observed in the present study (14.2 ± 1.7 N/cm2) w ere close to the variation proposed by Eno-ka(32) (16 – 30 N/cm2) for in situ experiments. The t-test applied betw een values measured and values predicted of group VE for both the body adiposity and the 1-RM indicates a good external validity. We may, therefore, use the equations expecting accept-able error ranges w hen individuals similar to those from this study are analyzed. The consideration of the humerus bone area may improve the relations found in the present study. How ever, the subtraction of 10.0 cm2 as bone area index, as proposed in the study adopted as reference(9,10), w ill increase the number of calcu-lations w ith no alterations of regressions here observed.
Objectivity studies include the intra-evaluator error and the va-lidity of the method. In the case of the present technique the intra-evaluator error seems to be similar to those observed in other in-vestigations. Heymsfield et al.(24) obtained variation coefficients of 7.1% for AM B and 1.0% for the arm total area betw een tw o evalu-ators. Other authors also observed satisfactory results for intra-evaluator measures for arm circumference and triceps skinfold separately(30-33). How ever, a higher objectivity of A
GB in relation to
AM B is expected due to the smaller area occupied by the fat tissue. Thus, small differences observed in values of circumference and triceps skinfolds w ill be less evident in AGB than in AM B. The ATB may be determined w ith low er variation betw een evaluators, pos-sibly due to the small sum of errors for the attainment of variables ATB, once the skinfold thickness is not employed in this calculation. Finally, it has been concluded that the inference anthropometric technique of muscular and arm fat areas may be employed w ith reasonable agreement betw een evaluators for the estimation of the body adiposity and maximal voluntary strength of trunk and upper limbs.
ACKNOWLEDGM ENTS
The authors of this study express their acknow ledgments to Hospital dos Servidores do Estado and to AACEA-HSE, represented by Dr. Aluysio S. Aderaldo Jr. for the significant contribution for the performance of this w ork.
All the authors declared there is not any potential conflict of inter-ests regarding this article.
REFERENCES
1. Forslund AH, Johansson AG, Sjodin A, Bryding G, Ljunghall L, Hambraeus L. Evaluation on modified multicompartment models to calculate body composi-tion in healthy males. Am J Clin Nutr 1996;63:856-62.
2. Withers RT, LaForgia J, Pillans K, Shipp NJ, Chatterton BE, Schultz CG, Leaney F. Comparisons of tw o-, three-, and four-compartment models of body composi-tion analysis in men and w omen. J Appl Physiol 1998;85:238-45.
3. Himes JH, Roche AF, Webb P. Fat areas as estimates of total body fat. Am J Clin Nutr 1980;33:2093-100.
4. M cArdle WD, Katch FI, Katch VL. Exercise Physiology. 4th ed. Baltimore:
Will-iams & Wilkins, 1996.
5. Åstrand PO, Rocahl K, Dahl HA, Strømme SB. Textbook of w ork physiology: Physiological bases of exercise. 4th ed. Champaign: Human Kinetics, 2003.
6. Jackson A, Watkins M , Patton RW. A factor analysis of tw elve isotonic strength performances on universal gym. M ed Sci Sports Exerc 1980;12:274-7. 7. Pollock M L, Wilmore J. Exercício na saúde e na doença. 2s ed. Rio de Janeiro:
M edsi, 1986.
8. Gordon CC, Chumlea WC, Roche AF. Stature, recumbent length, and w eight. In: Lohman TG, Roche AF, M artorell R, editors. Anthropometric standardization ref-erence manual. Champaign: Human Kinetics, 1988;3-8.
9. Frisancho AR. Triceps skinfold and upper arm muscle areas for assessment of nutritional status. Am J Clin Nutr 1974;27:1052-8.
10. Frisancho AR. New norms of upper limb fat and muscle areas for assessment of nutritional status. Am J Clin Nutr 1981;34:2540-5.
11. Baumgartner RN, Heymsfield SB, Lichtman S, Wang J, Pierson RN. Body com-position in elderly people: effect of criterion estimates on predictive equations. Am J Clin Nutr 1991;53:1345-53.
12. Willams DP, Going SB, Lohman TG, Hew itt M J, Harber AE. Estimation of body fat from skinfold thickness in middle-aged and older men and w omen: a multiple component approach. American Journal of Human Biology 1992;4:595-605. 13. Clasey JL, Kanaley JA, Wideman L, Heymsfield SB, Teates CD, Gutgesell M E,
Thorner M O, Hartman M L, Weltman A. Validity of methods of body composition assessment in young and older men and w omen. J Appl Physiol 1999;86: 728-38.
14. Baumgartner RN, Rhyne RL, Troup C, Wayne S, Gandy PJ. Appendicular skeletal muscle are assessed by magnetic resonance imaging in older people. Journal of Gerontology 1992;47:M 67-72.
15. Pollock M L, Laughridge E, Coleman B, Linnerud AC, Jackson A. Prediction of body density in young and middle-aged w omen. J Appl Physiol 1975;38:745-9. 16. Pollock M L, Hickman T, Kendrick Z, Jackson A, Linnerud AC, Daw son G. Predic-tion of body density in young and middle-aged men. J Appl Physiol 1976;40:300-4.
17. Jackson AS, Pollock M L. Generalized equations for predicting body density of men. Br J Nutr 1978;40:497-504.
18. Guedes DP. Composição corporal: princípios, técnicas e aplicações. 2a ed.
Lon-drina: APEF, 1994.
19. Beddoe AH, Samat SB. Body fat prediction from skinfold anthropometry refer-enced to a new gold standard: in vivo neutron activation analysis and tritium dilution. Physiol M eas 1997;19:393-403.
45,0 42,5 40,0 37,5 35,0 32,5 30,0 27,5 25,0 22,5 20,0 17,5 10
8
6
4
2
0
Distribuição normal (Assimetria = 1,445)
St andard deviat ion = 6.31
Average = 25.2 N = 30,00
Fig. 3 –Distribution of age frequencies of group VE Norm al distribution (asym m etry = 1.445)
20. Jackson AS, Pollock M S, Graves JE, M ahar M T. Reliability and validity of bio-elect rical im pedance in det erm ining body com posit ion. J Appl Physiol 1988;64:529-34.
21. Lean M , Hans TS, Deurenberg P. Predicting body composition by anthropomet-ric measurements. Am J Clin Nutr 1996;63:4-14.
22. Durnin JV, Womersley J. Body fat assessed from total body density and its esti-mation from skinfold thickness: measurements on 481 men and w omen aged from 16 to 72 years. Br J Nutr 1974;32:77-97.
23. Baumgartner RN, Chumlea CW, Roche AF. Estimation of body composition from bioelectric impedance of body segments. Am J Clin Nutr 1989;50:221-6. 24. Heymsfield SB, M cM anus C, Smith J, Stevens V, Nixon DW. Anthropometric
measurements of muscle mass: revised equations for calculating bone-free arm muscle area. Am J Clin Nutr 1982;36:680-90.
25. Katch FI, Hortobagyi T. Validity of surface anthropometry to estimate upper-arm muscularity, including changes w ith body mass loss. Am J Clin Nutr 1990;52:591-5.
26. De Koning FL, Binkhorst RA, Kauer JM G, Thijssen HOM . Accuracy of an anthro-pometric estimate of the muscle and bone area in a transversal cross-section of the arm. Int J Sports M ed 1986;7:246-9.
27. M ayhew JL, Piper FC, Ware JS. Anthropometric correlates w ith strength perfor-m ance aperfor-m ong resist ance t rained at hlet es. J Sport s M ed Phys Fit ness 1993;33:159-65.
28. M ayhew JL, Piper FC, Ware JS. Relationships of anthropometric dimensions to strength performance in resistance trained athletes. Journal of Physical Educa-tion and Sport Science 1993;5:7-16.
29. Schantz P, Randall-Fox E, Hutchison W, Tydén, Åstrand PO. M uscle fibre type distribution, muscle cross-sectional area and maximal voluntary strength in hu-mans. Acta Physiol Scand 1983;117:219-26.
30. Kasarskis EJ, Berryman S, English T, Nyland J, Vanderlees T, Schneider A, Berg-er R, M cClain C. The use of uppBerg-er extremity anthropometrics in the clinical as-sessm ent of pat ient s w it h am yot rophic lat eral sclerosis. M uscle Nerve 1997;20:330-5.
31. Forbes GB, Brow n M R, Griffiths HJ. Arm muscle plus bone area: anthropometry and CAT scan compared. Am J Clin Nutr 1988;47:929-31.
32. Enoka RM . Bases neuromecânicas da cinesiologia. 2a ed. São Paulo: M anole,
2000.
33. M ueller WH, M alina RM . Relative reliability of circumferences and skinfolds as measures of body fat distribution. Am J Phys Anthropol 1987;72:437-9. 34. Ferrario M , Carpenter M A, Chambless LE. Reliability of body fat distribution
measurements. The ARIC study baseline cohort results. International Journal of Obesity 1995;19:449-57.
35. Benefice E, M alina R. Body size, body composition and motor performances of m ild-t o-m oderat ely undernourished Senegalese children. Ann Hum Biol 1996;23:307-21.