Body composition in adults with neurofibromatosis type 1
MARCIO SOUZA1, ANN JANSEN1, ALINE MARTINS1, LUIZ RODRIGUES1, NILTON REZENDE1*
1Internal Medicine, Universidade Federal de Minas Gerais, Belo Horizonte, MG, Brazil
S
UMMARYStudy conducted at Universidade Federal de Minas Gerais (UFMG), Belo Horizonte, MG, Brazil
Article received: 1/16/2016
Accepted for publication: 2/15/2016
*Correspondence:
Address: Alameda Álvaro Celso, 55 Belo Horizonte, MG – Brazil Postal code: 30150-260 [email protected]
Financial support: The authors received inancial support from two Brazilian government funding agencies: CAPES, National Council of Technological and Scientiic Development – CNPq (#471725/2013-7) and FAPEMIG (#APQ-00928-11; #PPM-00120-14). The funding sources played no role in the design, analysis, writing, or decision to publish.
http://dx.doi.org/10.1590/1806-9282.62.09.831
Objective: To evaluate the body composition and nutritional status of neurofi-bromatosis type 1 (NF1) adult patients.
Method: A cross-sectional study of 60 NF1 patients (29 men, 31 women) aged
≥ 18 years who were evaluated from September 2012 to September 2013 in a Neurofibromatosis Outpatient Reference Center. Patients underwent nutri-tional assessment including measurements of weight, stature, waist circumference (WC), upper-arm circumference (UAC), and skinfolds (biceps, triceps, subscapu-lar, suprailiac). Body mass index (BMI), upper-arm total area (UATA), upper-arm muscle area (UAMA), upper-arm fat area (UAFA), body fat percentage (BFP), fat mass, fat-free mass, fat mass index, and fat-free mass index were also calculated.
Results: The mean age of the study population was 34.48±10.33 years. The
prevalence of short stature was 28.3%. Low weight was present in 10% of the sample and 31.7% of patients had a BMI ≥ 25 kg/m2. Reduced UAMA (<5th
per-centile) was present in 43.3% and no difference was found in UAFA between the sexes. The BFP was considered high in 30% and 17 (28.3%) patients had a WC above the World Health Organization cutoffs.
Conclusion: In this study, NF1 patients had a high prevalence of underweight, short stature, and reduced UAMA, with no difference between the sexes. Reduced UAMA was more prevalent in underweight patients; however, this was also observed in the normal and overweight patients. Further studies should investigate the distribution of body tissues in NF1 patients, including differences between men and women, and the influence of diet and nutrition on clinical features in NF1.
Keywords: neurofibromatosis type 1, nutritional status, anthropometry, body
composition, adult.
I
NTRODUCTIONNeurofibromatosis type 1 (NF1) is the most prevalent form in a group of three genetic diseases called neurofi-bromatoses, and is caused by inherited or de novo
muta-tions on chromosome 17, resulting in reduced neurofi-bromin synthesis, which subsequently reduces tumor suppression.1 The diagnostic criteria for NF1 are almost
exclusively clinical, and were established by the National Institutes of Health (NIH) Consensus.2 The most common
clinical features of NF1 are café au lait spots, dermal
neu-rofibromas, plexiform neuneu-rofibromas, axillary and/or inguinal freckling, Lisch nodules, and bone dysplasia. However, NF1 can also exhibit multisystemic involvement including musculoskeletal, cardiovascular, endocrine,
ophthalmic, central and peripheral neural system, learn-ing deficits and speech disorders.3-5
Recently, the first study of nutrient intake in NF1 patients was published,6 and, although the clinical
man-ifestations of NF1 are well established, data on body com-position are scarce4,7-10 and not well known. Low weight,
short stature, and reduced body mass index (BMI) were found previously in NF1 patients and can be used as nutritional status indicators. However, these character-istics had different prevalence rates in the small number of studies available.4,7-10 Most of these studies were
Body composition is related to health.11 Altered body
composition, or excess fat, can greatly increase the risk of cardiovascular disease, diabetes, hypertension, and can-cer.11 In other hand, muscle plays a central role in
whole-body protein metabolism and altered muscle metabolism plays a key role in the genesis and prevention of many common pathologic conditions and chronic diseases.12
Epidemiological and clinical studies use the anthropom-etry by measuring circumferences and skinfolds. The upper-arm composition is also used as an indicator of fat and muscle distribution. Several studies have shown the direct association of disease, biochemical changes, and nutritional status with upper-arm composition.13,14
The NF1 nutritional status assessment is relevant, because features of this disease as underweight or short height can influence patients’ health and quality of life. Therefore, the present study aimed to assess the body composition of NF1 adult patients.
M
ETHODSample
The present cross-sectional study included all NF1 patients aged ≥ 18 years from a Brazilian Neurofibromatosis Out-patient Reference Center (NORC) evaluated between September 2012 and September 2013. The study was approved by the Ethics Committee of the Federal Univer-sity of Minas Gerais. All patients provided their written informed consent. Patients were excluded based on mus-culoskeletal limitations, presence of a neurofibroma at the measurement site, or the use of medications that might compromise the nutritional assessment.
Data collection
The anthropometric measurements used in this study followed the protocol provided by the World Health Or-ganization (WHO).15 Weight was measured to the nearest
100 g with a mechanical scale (Welmy®), which was checked
regularly before each investigation, and height was mea-sured using a vertical stadiometer (Welmy®). Weight and
height were used to calculate patients’ BMI.15 The BMI
categories used in this study were normal weight (BMI 18.5-25 kg/m2), underweight (BMI < 18.5 kg/m2), and
overweight (BMI ≥ 25.0 kg/m2).15 Fat mass index (FMI)
and fat-free mass index (FFMI) were also calculated using the equations according to VanItallie et al.:16
FMI = fat mass (kg) / height (m)2
FFMI = fat-free mass (kg) / height (m)2
Waist circumference (WC) was measured at the mid-point between the iliac crest and the rib cage. According to the WHO,11 the minimum normal cutoff points for
WC are 94 cm and 80 cm in men and women, respec-tively. To calculate the body fat percentage (BFP), skin-fold thickness was measured to the nearest millimeter (mm) using a caliper (Cescorf®). These readings were
made at four sites on all subjects: at the biceps (BS), triceps (TS), subscapular (SS), and supra-iliac (SIS) areas. These measurements were taken on the right side of the body with the subject standing in a relaxed position. Body density was calculated using the linear regression equations for men and women according to Durnin and Womersley.17 These equations do not use plenty of
skin-fold thickness, which may be of interest in NF1 patients, as the presence of a neurofibroma at the measurement site was an exclusion criterion in this study, as previ-ously stated. The BFP was then calculated using Siri’s equation,18 and classified as normal, high, or low
accord-ing to Lohman’s criteria.19
The upper-arm circumference (UAC)20 was measured
at the midway point between the acromion and the olec-ranon process of the elbow of the right arm using a tape measure to the nearest 0.10 cm. The upper-arm composi-tion was assessed based on anthropometric measurements of UAC and TS utilizing standard equations, with values in percentiles, according to the National Center for Health Statistics (NCHS) reference and classified by Frisancho.20
The following equations20,21 for upper-arm total area
(UATA), upper-arm muscle area (UAMA), and upper-arm fat area (UAFA) were used:
a. UATA (cm2) = (UAC)2 / (4 x π)
b. UAMA (cm2) = {(UAC – TS x π)2 / (4 x π)} – 10 → Male
c. UAMA (cm2) = {(UAC – TS x π)2 / (4 x π)} – 6.5 → Female
d. UAFA (cm2) = UATA – UAMA
Statistical analyses
All statistical analyses were conducted using the Statisti-cal Package for Social Sciences (SPSS®) version 19.0 for
Student’s t-test for independent samples. Quantitative variables that were not normally distributed were pre-sented as median and interquartile range (IQR), or min-imum and maxmin-imum, and compared using the non-para-metric Mann-Whitney U test. P-values < 0.05 were considered statistically significant.
R
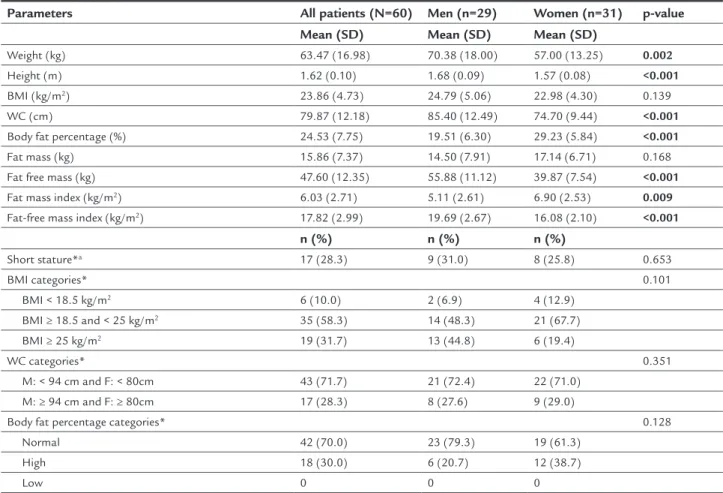
ESULTSSixty patients aged 18 to 64 years were included in this study. Twenty-nine patients (48.3%) were men. The mean age was 34.48±10.33 years, and there was no difference between men and women (p=0.980). No patients were excluded based on the exclusion criteria. Anthropometric and body composition data are shown in Table 1.
The distribution of anthropometric data classified in categories of height, BMI, WC, and BFP are also presented in Table 1. Using the BMI categories, 6 of the 60 patients (10%) were classified as underweight,
35 (58.3%) were normal weight, and 19 (31.7%) were overweight. After analyzing the WC categories, 17 of the 60 (28.3%) patients had measurements above the WHO minimum normal cutoff points.11 After analyzing
the BFP categories, 18 of the 60 (30%) patients were classified as having a high BFP. There were no signifi-cant differences in the categorization of BMI, WC, and BFP between the sexes.
Table 2 shows the classification of body composition variables using upper-arm parameters. Regarding the UAFA, there was no difference between sexes, and only 6.6% of patients had increased UAFA (> 95th percentile).
However, in terms of UAMA, 43.3% of patients had values below the 5th percentile, representing 51.7% of men and
35.5% of women with NF1 in this study. When this data was stratified by sex, men showed greater UAMA than women, which was to be expected (p<0.001).
TABLE 1 Anthropometric and body composition data of NF1 patients and its distribution in categories.
Parameters All patients (N=60) Men (n=29) Women (n=31) p-value
Mean (SD) Mean (SD) Mean (SD)
Weight (kg) 63.47 (16.98) 70.38 (18.00) 57.00 (13.25) 0.002
Height (m) 1.62 (0.10) 1.68 (0.09) 1.57 (0.08) <0.001
BMI (kg/m2) 23.86 (4.73) 24.79 (5.06) 22.98 (4.30) 0.139
WC (cm) 79.87 (12.18) 85.40 (12.49) 74.70 (9.44) <0.001
Body fat percentage (%) 24.53 (7.75) 19.51 (6.30) 29.23 (5.84) <0.001
Fat mass (kg) 15.86 (7.37) 14.50 (7.91) 17.14 (6.71) 0.168
Fat free mass (kg) 47.60 (12.35) 55.88 (11.12) 39.87 (7.54) <0.001
Fat mass index (kg/m2) 6.03 (2.71) 5.11 (2.61) 6.90 (2.53) 0.009
Fat-free mass index (kg/m2) 17.82 (2.99) 19.69 (2.67) 16.08 (2.10) <0.001
n (%) n (%) n (%)
Short stature*a 17 (28.3) 9 (31.0) 8 (25.8) 0.653
BMI categories* 0.101
BMI < 18.5 kg/m2 6 (10.0) 2 (6.9) 4 (12.9)
BMI ≥ 18.5 and < 25 kg/m2 35 (58.3) 14 (48.3) 21 (67.7)
BMI ≥ 25 kg/m2 19 (31.7) 13 (44.8) 6 (19.4)
WC categories* 0.351
M: < 94 cm and F: < 80cm 43 (71.7) 21 (72.4) 22 (71.0) M: ≥ 94 cm and F: ≥ 80cm 17 (28.3) 8 (27.6) 9 (29.0)
Body fat percentage categories* 0.128
Normal 42 (70.0) 23 (79.3) 19 (61.3) High 18 (30.0) 6 (20.7) 12 (38.7)
Low 0 0 0
SD: standard deviation; BMI: body mass index; WC: waist circumference; M: male; F: female; ashort stature was considered when percentile < 5; *categorical variables were compared using
Comparing patients with normal or reduced UAMA (< 5th
percentile), there was no difference in height between groups (p=0.316), but comparing sexes, there was no difference for height between men with normal or reduced UAMA (p=0.526), and it was significantly lower in women with UAMA under 5th percentile (p=0.022). NF1 patients with reduced UAMA
showed lower weight (p<0.001), BMI (p<0.001), fat mass (p<0.001) and fat-free mass (p=0.024), for both men and women, but FMI were lower only for women (0.013).
D
ISCUSSIONIn our study, compared to the non-NF1 population, NF1 patients were found to be underweight and present short stature, as well as reduced UAMA, with no sex differ-ences for categories of these variables. Reduced muscle mass (as indicated by UAMA) was more prevalent in un-derweight patients (83.3%); however, this was also observed in normal (54.3%) and overweight (11.8%) patients. A small number of patients (1.7%) had low adipose tissue.
With regard to anthropometric characteristics, the prevalence of underweight adults in the Brazilian popu-lation is 2.7% (1.8% in men and 3.6% in women).22 In this
study, the prevalence of underweight is above the 5% mark that the WHO uses to identify malnutrition in a popula-tion.22 In addition, 13 of the 29 men (44.8%) and 6 of the
31 women (19.4%) were overweight, while in the Brazilian adult population, this prevalence is 49% (50.1% in men
Short stature was present in 28.3% of the sample, which was higher than seen in a study by Petramala et al.,7 and lower than seen in the studies of Souza et al.4 and
Trovo-Marques et al.8 These studies were conducted in
different age groups, and also included children in the analyses. In the Brazilian population survey,22 the average
height (in centimeters) of adults living at the same region in Brazil was high compared to patients with NF1 of this study.
The body composition analysis showed that women had a higher BFP compared to men with NF1, although in absolute values of fat (in kilograms), there was no dif-ference between the sexes. This may be due to the lower weight and lower fat-free mass shown by women with NF1. Men with NF1 had a larger UATA, UAC, and UAMA compared with women, while UAFA was similar between the sexes. This difference may be caused primarily by muscle mass, as there was no difference in UAFA and the bone gap difference between the sexes was already con-sidered in the equations used.21 The UAMA was considered
low in 43.3% of patients in this study, representing 51.7% of men and 35.5% of women. The average values of UAMA have been shown to be higher in men than in women in other studies; however, the absolute values of this research were lower than the values found in other national and international studies.23-26
Stevenson et al.10 used quantitative peripheral
com-TABLE 2 Classification of body composition variables in percentiles according to the NCHS Standard.20
Parameters All patients (N=60) Men (n=29) Women (n=31) p-value*
UATA (cm2) – Mean ± SD 65.52±20.92 72.78±22.31 58.72±17.24 0.008
UATA categories – n (%) 0.505
< p5 (Low) 9 (15.0) 5 (17.2) 4 (12.9) p5 – p95 (Normal) 50 (83.3) 23 (79.3) 27 (87.1) > p95 (High) 1 (1.7) 1 (3.5) 0
UAMA (cm2) – Mean ± SD 39.59±14.69 48.01±14.87 31.71±9.24 <0.001
UAMA categories – n (%) 0.205
< p5 (Low) 26 (43.3) 15 (51.7) 11 (35.5) p5 – p95 (Normal) 34 (56.7) 14 (48.3) 20 (64.5)
> p95 (High) 0 0 0
UAFA (cm2) – Mean ± SD 25.93±8.93 24.77±9.08 27.01±8.79 0.337
UAFA categories – n (%) 0.067
< p5 (Low) 1 (1.7) 0 1 (3.2)
p5 – p95 (Normal) 55 (91.7) 25 (86.1) 30 (96.8) > p95 (High) 4 (6.6) 4 (12.9) 0
muscle of NF1 patients and volunteers not affected by the disease. This study demonstrated that children with NF1 have lower muscle cross-sectional area than their controls, but this did not lead to major advances in the pathophysiology of this finding. Furthermore, reduced muscle strength is a feature described in NF1 patients by Souza et al.27 also recruited from NORC. According to
Pompeu et al.,23 the UAMA has good correlation with the
maximal voluntary strength.
This study found anthropometric differences between men and women with NF1. Although changes in weight and fat accumulation are expected comparing sexes, it seems that this difference is larger than the commonly found in people without NF1 and should receive attention in further studies. Probably, men and women are affected by NF1 in different ways in their body compartments, which can be related to situations like AMB greater in men and/or fat accumulation greater in women. Other studies28,29 have also found differences between men and
women for variables such as BMI, reinforcing the need to assess the impact of NF1 in each sex.
In our study, body composition was inadequate in terms of muscle mass. Low muscle mass is usually associ-ated with low weight and malnutrition,15 which was also
found in this study. However, we also found low muscle mass in normal weight and overweight patients, suggest-ing that the BMI values should be interpreted with caution when assessing the nutritional status in NF1 patients, or that the BMI cutoff points must be adapted to changes in body composition. The reduced muscle mass can in-dicate an early sarcopenia in NF1 patients. It may have multiple causes that should be investigated in further studies, as poor blood flow to muscle, mitochondrial dysfunction, decreased caloric intake, a decline in ana-bolic hormones, or an increase in proinflammatory cito-kines.30 Souza et al.6 showed a decreased caloric intake in
NF1 patients, but the authors discussed a possible over-estimation of the daily energy expenditure when using the predictive equations.
Nutritional status can influence patients’ quality of life.31,32 Previous studies have shown that the clinical
se-verity and social representations of NF1 are correlated with quality of life, as reported by NF1 patients and their families.33,34 The importance of nutritional care in NF1
patients and their clinical features must be investigated further in future studies.
This study has limitations, such as convenience sam-pling and selection bias, that may have been caused by selecting patients with nutritional conditions including obesity and diabetes. All patients who had previously been
treated in the outpatient center were invited to participate in this study to minimize this error. Randomization and the inclusion of a control group (with unaffected patients) would be useful in improving the external validity of similar studies. Additionally, UAMA is not the gold stan-dard method for assessing muscle mass, and further stud-ies should use better parameters to investigate the muscle mass in NF1 patients.
C
ONCLUSIONNF1 patients in this study had a high prevalence of un-derweight, short stature, and reduced UAMA, with no difference between the sexes. Reduced UAMA was more prevalent in underweight patients; however, it was also observed in the normal and overweight patients. Further studies should investigate the distribution of body tissues in NF1 patients with standard methods and investigate the possible correlation and impact of the nutritional status on the clinical features of the disease.
R
ESUMOComposição corporal em adultos com neurofibromatose tipo 1
Objetivo: avaliar a composição corporal e o estado
nu-tricional de adultos com neurofibromatose tipo 1 (NF1).
Método: estudo transversal com 60 pacientes com NF1
(29 homens, 31 mulheres) com idade ≥ 18 anos que foram avaliados de setembro de 2012 a setembro de 2013 em um Centro de Referência em Neurofibromatoses. Pacien-tes foram submetidos à avaliação nutricional, incluindo medidas de peso, estatura, circunferência da cintura (CC), circunferência do braço e dobras cutâneas (bíceps, tríceps, subescapular, suprailíaca). Índice de massa corpórea (IMC), área total do braço (ATB), área muscular do braço (AMB), área adiposa do braço (AAB), percentual de gordura, mas-sa gorda, masmas-sa livre de gordura, índice de masmas-sa gorda e índice de massa livre de gordura foram calculados.
Resultados: a idade média da amostra foi de 34,48±10,33
anos. A prevalência de baixa estatura foi 28,3%. Baixo peso esteve presente em 10% da amostra e 31,7% apresentaram IMC ≥ 25 kg/m2. A AMB reduzida esteve presente em 43,3% e não foram encontradas diferenças na AAB entre os sexos. O percentual de gordura foi considerado alto em 30% da amostra, e 28,3% apresentaram CC acima dos pontos de corte da Organização Mundial de Saúde.
Conclusão: neste estudo, pacientes com NF1
foi mais prevalente em pacientes com baixo peso, no en-tanto também foi observada em pacientes com peso nor-mal ou sobrepeso. Estudos futuros devem investigar a distribuição de tecidos corporais na NF1, incluindo dife-renças entre sexos, e a influência da nutrição nas mani-festações clínicas da doença.
Palavras-chave: neurofibromatose tipo 1, estado
nutri-cional, antropometria, composição corporal, adulto.
R
EFERENCES1. Rodrigues LO, Batista PB, Goloni-Bertollo EM, de Souza-Costa D, Eliam L, Eliam M, et al. Neurofibromatoses: part 1 – diagnosis and differential diagnosis. Arq Neuropsiquiatr. 2014; 72(3):241-50.
2. National Institutes of Health Consensus Development Conference Statement: neurofibromatosis. Bethesda, Md., USA, July 13-15, 1987. Neurofibromatosis. 1988; 1(3):172-8.
3. Riccardi VM. Neurofibromatosis type 1 is a disorder of dysplasia: the importance of distinguishing features, consequences and complications. Birth Defects Res A Clin Mol Teratol. 2010; 88(1):9-14.
4. Souza JF, Toledo LL, Ferreira MC, Rodrigues LOC, Rezende NA. Neurofibromatose tipo 1: mais comum e mais grave do que se imagina. Rev Assoc Med Bras. 2009; 55(4):394-9.
5. Ferner RE, Huson SM, Thomas N, Moss C, Willshaw H, Evans DG, et al. Guidelines for the diagnosis and management of individuals with neurofibromatosis 1. J Med Genet. 2007; 44(2):81-8.
6. Souza MLR, Jansen AK, Martins AS, Rodrigues LOC, Rezende NA. Nutrient intake in neurofibromatosis type 1: a cross-sectional study. Nutrition 2015; 31(6):858-62.
7. Petramala L, Giustini S, Zinnamosca L, Marinelli C, Colangelo L, Cilenti G, et al. Bone mineral metabolism in patients with neurofibromatosis type 1 (von Recklingausen disease). Arch Dermatol Res. 2012; 304(4):325-31. 8. Trovó-Marqui AB, Goloni-Bertollo EM, Valério NI, Pavarino-Bertelli EC,
Muniz MP, Teixeira MF, et al. High frequencies of plexiform neurofibromas, mental retardation, learning difficulties, and scoliosis in Brazilian patients with neurofibromatosis type 1. Braz J Med Biol Res. 2005; 38(9):1441-7. 9. Szudek J, Birch P, Friedman JM. Growth in North American white children
with neurofibromatosis 1 (NF1). J Med Gen. 2000; 37(12):933-8. 10. Stevenson D, Moyer-Mileur LJ, Carey JC, Quick JL, Hoff CJ, Visckochil DH.
Case-control study of the muscular compartments and osseous strength in neurofibromatosis type 1 using peripheral quantitative computed tomography. J Musculoskelet Neuronal Interact. 2005; 5(2):145-9. 11. World Health Organization. Waist circumference and waist-hip ratio. Report
of WHO Expert Consultation. Geneva: WHO; 2011.
12. Wolfe RR. The underappreciated role of muscle in health and disease. Am J Clin Nutr. 2006; 84(3):475-82.
13. Hurtado-López EF, Larrosa-Haro A, Vásquez-Garibay EM, Macías-Rosales R, Troyo-Sanromán R, Bojórquez-Ramos MC. Liver function test results predict nutritional status evaluated by arm anthropometric indicators. J Pediatr Gastroenterol Nutr. 2007; 45(4):451-7.
14. Chomtho S, Fewtrell MS, Jaffe A, Williams JE, Wells JC. Evaluation of arm anthropometry for assessing pediatric body composition: evidence from healthy and sick children. Pediatr Res. 2006; 59(6):860-5.
15. World Health Organization. Physical status: the use and interpretation of anthropometry. Geneva: WHO; 1995. (Technical Report Series No. 854). 16. VanItallie TB, Yang MU, Heymsfield SB, Funk RC, Boileau RA.
Height-normalized indices of body’s fat-free mass and fat mass: potentially useful indicators of nutritional status. Am J Clin Nutr. 1990; 52(6):953-9. 17. Durnin JV, Womersley J. Body fat assessed from total body density and its
estimation from skinfold thickness: measurements on 481 men and women aged from 16 to 72 years. Br J Nutr. 1974; 32(1):77-97.
18. Siri WE. Body composition from fluid spaces and density analysis of methods. In: Brozek J, Henschel A, editors. Techniques for measuring body composition. Washington (DC): National Academy of Sciences; 1961.
19. Lohman TG. Advances in body composition assessment: current issues in exercises science. Champaign: Human Kinetic Publisher; 1992. 150 p. 20. Frisancho AR. Anthropometric standards for the assessments of growth and
nutritional status. Ann Abor: University of Michigan Press; 1990. 189 p. 21. Heymsfield SB, McManus C, Smith J, Stevens V, Nixon DW. Anthropometric
measurements of muscle mass: revised equations for calculating bone-free arm muscle area. Am J Clin Nutr. 1982; 36(4):680-90.
22. Instituto Brasileiro de Geografia e Estatística. Pesquisa de orçamentos familiares POF 2008-2009: antropometria e estado nutricional de crianças, adolescentes e adultos no Brasil. Rio de Janeiro: IBGE; 2010.
23. Pompeu FAMS, Gabriel D, Pena BG, Ribeiro P. Arm cross-section areas: technical implications and applications for body composition and maximal dynamic strength evaluation. Rev Bras Med Esporte. 2004; 10(3):207-11. 24. Anselmo MAC, Burini RC, Angeleli AYO, Mota NGS, Campana AO. Avaliação
do estado nutricional de indivíduos adultos sadios de classe média. Ingestão energética e proteica, antropometria, exames bioquímicos do sangue e testes de imunocompetência. Rev Saúde Pública. 1992; 26(1):46-53.
25. Arechabaleta G, Castillo H, Herrera H, Pacheco M. Composición corporal en una población de estudiantes universitarios. Rev la Facultad Medicina (Caracas). 2002; 25(2):209-16.
26. Soares V, Avelar IS, Andrade SRS, Vieira MF, Silva MS. Body composition of chronic renal patients: anthropometry and bioimpedance vector analysis. Rev Latinoam Enferm. 2013; 21(6):1240-7.
27. Souza JF, Passos RL, Guedes AC, Rezende NA, Rodrigues LO. Muscular force is reduced in neurofibromatosis type 1. J Musculoskelet Neuronal Interact. 2009; 9(1):15-7.
28. Rodrigues LO, Rodrigues LOC, Castro LL, Rezende NA, Pinheiro ALP. Non-invasive endothelial function assessment in patients with neurofibromatosis type 1: a cross-sectional study. BMC Cardiovasc Disord. 2013; 13:18. 29. Koga M, Yoshida Y, Imafuku S. Nutritional, muscular and metabolic
characteristics patients with neurofibromatosis type 1. J Dermatol. 2016; 43(7):799-803.
30. Morley JE, Anker SD, Von Haehling S. Prevalence, incidence, and clinical impact of sarcopenia: facts, numbers, and epidemiology – update 2014. J Cachexia Sarcopenia Muscle. 2014; 5(4):253-9.
31. Maijó M, Clemente SJ, Ivory K, Nicoletti C, Carding SR. Nutrition, diet and immunosenescence. Mech Ageing Dev. 2014; 136-137:116-28.
32. Olszanecka-Glinianowicz M, Zygmuntowicz M, Owczarek A, Elibol A, Chudek J. The impact of overweight and obesity on health-related quality of life and blood pressure control in hypertensive patients. J Hypertens. 2014; 32(2):397-407. 33. Page PZ, Page GP, Ecosse E, Korf BR, Leplege A, Wolkenstein P. Impact of
neurofibromatosis 1 on quality of life: a cross-sectional study of 176 American cases. Am J Med Genet A. 2006; 140(18):1893-8.