AR
TIGO
AR
TICLE
Exposure to NO
2and children hospitalization
due to respiratory diseases in Ribeirão Preto, SP, Brazil
Exposição ao NO
2e internações por doenças respiratórias
em crianças em Ribeirão Preto, SP, Brasil
Resumo Os efeitos da exposição aos poluentes do ar sobre a saúde humana são principalmente refletidos nas doenças respiratórias, em crianças e idosos. Este estudo, do tipo ecológico de séries tem-porais, foi realizado em Ribeirão Preto/SP para examinar o papel da exposição a poluentes do ar e internações hospitalares por doenças respiratórias em crianças de até 10 anos de idade. O período de estudo foi entre 01.01.2011 e 31.12.2013. Material
partículado (PM10), dióxido de nitrogênio (NO2)
e ozônio (O3), temperatura e umidade relativa
do ar foram analisadas para estimar a associação com internações hospitalares usando um modelo linear generalizado da regressão de Poisson com defasagens de zero até sete dias após a exposição, ajustado pelo dia da semana, sazonalidade e
tem-peratura efetiva. Foi adotado alfa = 0,05. NO2
quando analisado no modelo unipoluente mos-trou significância nos lags 2 e 3 e quando avaliado no modelo multi-poluente foi significativo nos lags 2 até 5, e lag 7, com risco relativo entre 1,05 e 1,09
por 10 µg/m3 de aumento em sua concentração,
com excesso de 150 internações e aumento subs-tancial dos custos para o sistema de saúde públi-ca. Os dados permitem que o gestor local de saúde possa tomar medidas para minimizar estes efeitos.
Palavras-chave Poluentes do ar, Dióxido de ni-trogênio, Material particulado, Ozônio, Doenças respiratórias
Abstract The effects of exposure to air pollut-ants on human health are mainly reflected in respiratory diseases in children and elderly ones. An ecological time series study was carried out in Ribeirão Preto/SP data to examine the role of ex-posure to air pollutants and hospital admissions due to respiratory diseases in children under 10 years old. The study period was between January, 2011 and December, 2013. Particulate Matter
(PM10),Nitrogen dioxide (NO2), and ozone (O3),
temperature and air relative humidity, were ana-lyzed to estimate the association with hospital ad-missions using a generalized linear model of Pois-son’s regression with lags of zero up to seven days after exposure to pollutants, adjusted by the day of the week, seasonality and effective temperature.
The significance level adopted was p < 0.05. NO2,
when analyzed in single pollutant model shown to be significant at lag 2 and 3 and when analyzed in the multi-pollutant model it shown to be sig-nificant at lags 2 up to 5, and lag 7 with relative
risk between 1.05 and 1.09 per 10 µg/m3 increase
in NO2 concentration, with an excess of 150
hos-pital admission and substantial increase in costs to Public Health System. The data enable the lo-cal health managers can take action to minimize these effects.
Key words Air pollutants, Nitrogen dioxide, Par-ticulate material, Ozone, Respiratory diseases
Priscila Camargo Carvalho 1
Lígia Furitani Nakazato 1
Luiz Fernando Costa Nascimento 1
C
ar
valho PC
Introduction
Acute respiratory diseases, especially pneumonia, play an important role in morbidity and mortali-ty, in the world and in Brazil, representing an im-portant cause of death in children in developing countries1.
In 2014, approximately 370,000 hospital-izations due to acute respiratory infections and asthma in children under 10 years old happened in Brazil, while in the state of São Paulo were about 68,000. There was also in Brazil 1,409 deaths in this age group. The financial expens-es for the Unified Health System in Brazil were approximately R$ 260 million and in São Paulo were R$ 56 million2. (1 US$ ≈ R$ 2.50)
Daily exposure to air pollutants have been as-sociated with the increased morbidity and mor-tality due to respiratory acute infectious diseases. These effects were demonstrated in studies in large cities3,4 and in medium sized5-9. In addition,
international studies have also shown the harm-ful effects of air pollution on health10,11.
Among the major air pollutants studied are the particulate matter, with less than 10 micra of aerodynamic diameter - PM10, nitrogen dioxide (NO2), carbon monoxide (CO), ozone (O3) and sulfur dioxide (SO2); PM10 is emitted from me-chanical dispersions of organic materials and the uncontrolled combustion, in addition to the ones that happen in combustion engines of vehicles, incinerators and power plants. NO2 and NO have as main sources the vehicle fleet and, on a small-er scale, the powsmall-er plants, gas industries and gas stoves. O3is a secondary pollutant and has as its precursors nitrogen oxides and hydrocarbons, and SO2 is produced by vehicle and industrial combustion12,13.
The mechanisms by which they act these pol-lutants are still poorly understood and, among these mechanisms can be pointed to the forma-tion of free radicals of oxygen and nitrogen re-sulting from high concentrations of particulate matter, ozone and nitrogen oxides, which initiate inflammatory response the release of mediators such as cytokines that when they reach the sys-temic circulation lead to effects on the respirato-ry system, including14.
Children and elderly people are the most age group affected due to respiratory diseases.
The objective of this study was to estimate the association between the exposure to nitrogen dioxide and admissions due to acute respiratory infections diseases in under 10 years of age chil-dren residents in Ribeirão Preto, in the years 2011 to 2013.
Methods
An ecological study of time series was carried out with data of acute tracheitis and laryngitis hospitalizations (J04.0 to J04.9 of ICD-10th
revi-sion), pneumonia (J12.0 to J18.9), bronchitis and bronchiolitis (J20.0 the J21.9) and asthma (J45.0 to J45.9) in children of both sexes aged between 0 to 9 years old and residents in Ribeirão Preto. This city is located in Southeastern of Brazil, geographical coordinates 21º 10’ S and 47º 48’ W, it is a medium-sized city located at 546 m above sea level and had an humid climate with rainy summers and dry winters. It has important agricultural activity favored by soil characteris-tic of the city (red earth and sandstone) and its main products sugarcane, citrus, among others, and beyond, it has its significant industrial sector. The city presents estimated population of just over 600,000 inhabitants and is located 310 km from São Paulo. It is crossed by Anhanguera and Candido Portinari highway and presents intense flow of heavy vehicles like trucks and buses, with a total fleet vehicle about 500 thousand cars on 201315.
The concentration data of pollutants PM10, NO2, in their daily averages and O3, in their dai-ly maximum 8 hours, temperature and average relative air humidity were obtained from the São Paulo State Environmental Agency (Cetesb), which has a metering station in Ribeirão Preto. The data of hospitalizations were obtained from the Department of Information and Informatics of the Unified Health System (Datasus) from the city, considering the study period between January 1st, 2011 and December 31st, 2013.
Poisson regression was used to estimate rel-ative risks of exposures in the outcome - hospi-talization. A database with daily hospitalization data was constructed for each pollutant and cli-mate variable, considering zero lags up to seven days, because the effects of exposure to pollutants can be evidenced not only on the same day but in subsequent days and seven days lag are the most used window to analyze the effects of air pollutants exposure in human respiratory diseas-es. Therefore, it was chosen a generalized linear model for Poisson regression (GLM). Models with one pollutant and with two and three pol-lutants simultaneously were built adjusted for days of the week, by seasonality and the effective temperature (ET), which is calculated using the following mathematical expression.
aúd e C ole tiv a, 23(8):2515-2522, 2018
In addition, it was considered an increase of 10 µg/m3 on NO
2levels and calculated the relative
risk for hospitalization.
The possible correlations between admissions and pollutants were estimated and it was also cal-culated the proportional attributable risk (PAR), wher PAR = 1-1 / RR where RR is the relative risk obtained by exponentiation of the coefficients provided by Poisson regression; cost reduction of these hospitalizations were estimated, using aver-age values obtained of Datasus portal. Analyzes were performed using Stata v 9. The results were expressed as relative risk estimate.
Results
One thousand eight hundred and eight hospital admissions occurred during the study period. Mean daily hospital admission was 1.66 (dp = 1.64) and ranging from 0 to 10 hospitalizations per day. Pneumonia (825 hospital admissions – 45.6%) and bronchitis-bronchiolitis (748 - 41.4%) were the most prevalent diseases, asthma (224 – 12.4%) and laryngitis-tracheitis (11 – 0.06%) were the other hospital admissions.
The descriptive analysis is in Table 1. In the studied data, there were days that were not ac-counted for by Cetesb, such as NO2 with 83 days (7.8%), PM10 with 81 days (7.6%) and O3 with 31 days (2.9%). During the study period, there were 2 days that exceeded of the allowed limit of PM10, 4 overtaking of O3 and there was none of the NO2, being the air quality standards set for PM10 is up to 120 µg/m3, for the NO
2 is up to 260
µg/m3, for the O
3 is up to 140 µg/m3 16.
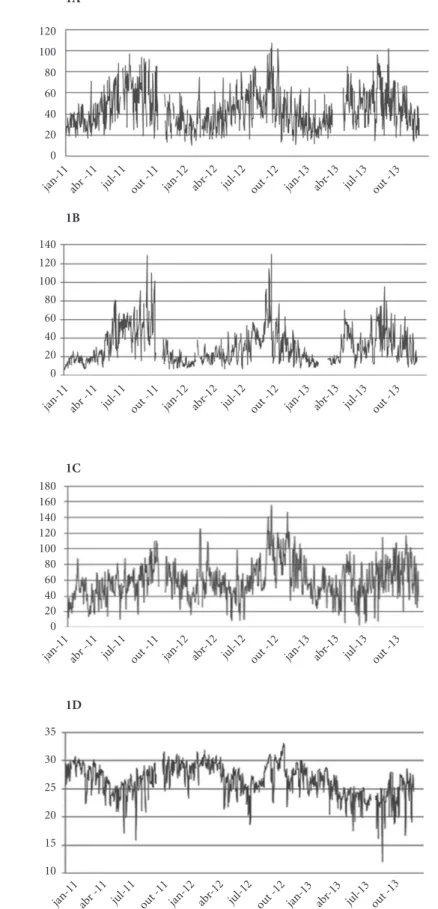
The distribution of concentrations of pollut-ants over time is in Figures 1A - 1D. Figure 1A shows that the concentration of NO2has a sea-sonally feature and has an increased concentra-tion in June and July during the coldest months
of the year with little rain and less winds allowing less dispersion of pollutants, as well as PM10 (1B) that also has this feature.
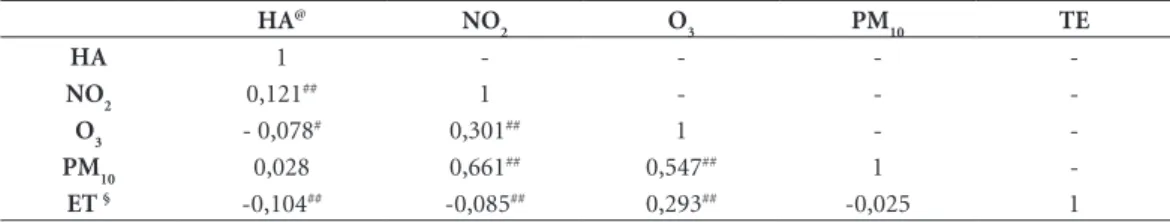
Table 2 shows the matrix of Pearson correla-tion coefficients. It can be seen a significant as-sociation between hospital admissions and NO2 and positive associations between pollutants. It is also possible to observe a negative association be-tween the effective temperature with the NO2, in other words, the lower the temperature, the high-er the concentration of this pollutant, except for O3, that the higher the temperature, the greater its concentration. And it can also be observed that there was no association of PM10 with admissions and effective temperature.
Table 3 contains the coefficients of Poisson regression analysis of pollutants concentrations. It can be observed that exposure to NO2, when analyzed alone, presented itself as a risk factor for hospitalizations in the lag 2 and 3 and, when analyzed together, it is associated with PM10 in lag 2 to lag 5 and 7, with ozone in the lag 2, lag 3 and lag 7. In the analysis with other pollutants, NO2 was strongly associated with the lag 2 (RR = 1.0077), lag 3 (RR = 1.0086), 4 lag (RR = 1.0051), 5 lag (RR = 1.0058) and 7 (RR = 1.0090), as shown in Table 4.
Figure 2 shows that with an increase of 10 µg/ m3 in the concentration of NO
2, the relative risk
increases up to 9 percentage points. Thereby, it calculates the population attributable fraction (FAP) and, with the reduction of 10 µg/m3, there
is a drop of about 150 admissions, generating a decrease in average expenses about R$ 260 thou-sand, considering the cost of each hospital ad-mission as R$ 1,800.0017.
Discussion
This is the first study, as far it is of our knowledge, carried out in Ribeirão Preto, SP, about the effects of NO2 exposure in pediatric hospitalizations in children of both sexes aged between 0 to 9 years old due to respiratory disease, and it were able to identify the harmful role of exposure to NO2 and also showed that when considered in association with other pollutants it potentiates the effects of such exposure.
The results of this study can identify a later effect of NO2 in lags 2 and 3 when analyzed alone and when analyzed together with other pollut-ants also proved to be a more delayed effect, with significance at lag 2 up to lag 5 and lag 7 after exposure.
Table 1. Descriptive analysis of the study variables.
Ribeirão Preto – SP, Brazil, 2011-2013.
Mean (SD)# Minimum-Maximum
Hospital admission O3(µg/m3)
1,66 (1,64)
60,3 (23,43)
0-10
3-156 PM10 (µg/m3) 30,8 (18,56) 6-130
NO2 (µg/m3) 44,2 (18,30) 10-107
ET ## 26,3 (2,81) 12,0 – 32,9
C
ar
valho PC
Figure 1. Daily values of concentrations of pollutants in mg/m3: (1A) NO
2, (1B) PM10, (1C) O3 and (D). Effective
temperature (0C) in Ribeirão Preto – SP, Brazil, 2011–2013. 1A
120 100 80 60 40 20 0
jan-11 abr -11 jul-11 out -11 jan-12 abr-12 jul-12 out -12 jan-13 abr-13 jul-13 out -13
1B
140 120 100 80 60 40 20 0
jan-11 abr -11 jul-11 out -11 jan-12 abr-12 jul-12 out -12 jan-13 abr-13 jul-13 out -13
1C 180 160 140 120 100 80 60 40 20 0
jan-11 abr -11 jul-11 out -11 jan-12 abr-12 jul-12 out -12 jan-13 abr-13 jul-13 out -13
1D
35 30 25 20 15 10
aúd
e C
ole
tiv
a,
23(8):2515-2522,
2018
Hospitalizations considered in this study, which involved asthma, bronchitis, bronchiolitis, pneumonia, acute tracheitis and laryngitis make up 83% of respiratory diseases hospitalizations in children in this age range2.
Exposure to nitrogen dioxide was also associ-ated with pediatric hospitalizations in Sorocaba5,
where an acute effect of this pollutant noted the
same day of exposure when occurred hospital-ization; it should be noted that in Sorocaba the daily average concentration of NO2 was close to that found in Ribeirão Preto (48.1 µg/m3), which
could explain the association of the NO2 present in both studies but in Sorocaba just one group of disease was studied – Pneumonia (J12 – J18).
On the other hand, in a study conducted in São Paulo, where the concentration of NO2 was 103.5 µg/m3, it observed that with the increase
of 10µg/m3 in NO
2 concentrations had a positive
association with admissions due to respiratory diseases most significant on the fifth day after exposure3, different from our study where the
greatest significance in the lag 7, possibly due to the difference in the mean concentration of this pollutant, because in Sao Paulo this concentra-tion was approximately 2.5 times greater with a possible sharper dose-response effect.
In addition to our study, Nicolussi et al. also found an association between respiratory diseas-es and air pollutants in Ribeirao Preto, showing an association to air pollutants with allergic dis-eases in school children, the symptoms of allergic rhinitis were more frequent in the dry season and coincided with the increase in PM10 and NO218.
This study confirms the association found by
Table 2. Pearson correlation matrix between pollutants hospital admission – Ribeirão Preto-SP, Brazil,
2011-2013.
HA@ NO
2 O3 PM10 TE
HA 1 - - -
-NO2 0,121## 1 - -
-O3 - 0,078# 0,301## 1 -
-PM10 0,028 0,661## 0,547## 1
-ET § -0,104## -0,085## 0,293## -0,025 1
# p < 0,05 ## p < 0,01 @ hospital admission §Effective Temperature.
Table 4. Relative risks and respective confidence
intervals (95%) of hospitalizations from zero to seven days in the model multipoluente, Ribeirão Preto–SP, Brazil, 2011 – 2013.
NO2 RR (IC = 95%)
Lag 0 1,001 (0,997 - 1,005) Lag 1 1,002 (0,998 -1,0068)
Lag 2 1,008 (1,004 - 1,012)
Lag 3 1,009 (1,005 - 1,012)
Lag 4 1,005 (1,001 - 1,009)
Lag 5 1,006 (1,002 - 1,010)
Lag 6 1,004(0,999 - 1,008)
Lag 7 1,009 (1,005 - 1,013)
The values in bold indicate p – value < 0,05.
Table 3. Coefficients and standard deviations provided by Poisson regression of admissions to the lags of zero to
seven days of exposure to pollutants, Ribeirão Preto – SP, Brazil, 2011 – 2013.
NO2 NO2 + PM10 NO2 + O3 NO2 + PM10 + O3
Lag 0 0.00136 (0.00146) 0.00071 (0.00195) 0.00128 (0.00160) 0.00072 (0.00199)
Lag 1 0.00236(0.00142) 0.00208 (0.00190) 0.00289 (0.00155) 0.00200 (0.00194)
Lag 2 0.00362 (0.00142) 0.00711 (0.00193) 0.00496 (0.00156) 0.00773 (0.00197)
Lag 3 0.00328 (0.00141) 0.00809 (0.00192) 0.00545 (0.00156) 0.00861 (0.00196)
Lag 4 0.00158 (0.00144) 0.00484 (0.00192) 0.00292 (0.00156) 0.00505 (0.00196)
Lag 5 0.00119 (0.00145) 0.00567 (0.00194) 0.00297 (0.00158) 0.00583 (0.00198)
Lag 6 -0,00028 (0.0015) 0.00359 (0.00195) 0.00200 (0.00159) 0.00390 (0.00200)
Lag 7 0.00200 (0.00144) 0.00824 (0.00198) 0.00569 (0.00160) 0.00898 (0.00203)
C
ar
valho PC
Castro et al.19, in which there was a positive
asso-ciation between exposure to NO2 and lung func-tion, with an increase of 10 µg/m3 for the
pollut-ant study, there was a decrease in peak expiratory in lags 2 and 3, even if these articles do not make reference to other respiratory diseases mentioned in our work, the harmful effect of NO2 is the same presented by our article in Ribeirao Preto.
In Rome, admissions for respiratory diseas-es in children were associated with NO2 and O3, where ozone had a strong effect on acute respi-ratory diseases and NO2 with hospitalizations by asthma10.
As can be observed the NO2 has a great role in admissions for respiratory diseases, because with the increase of 10 µg/m3 in their concentrations,
would increase 150 hospitalizations, that is, there would be an excess in hospital costs an average of R$ 260 thousand, for it is important to the de-velopment of public policies that reduce risks to Public Health, especially in the children’s health.
Nitrogen dioxide, in the presence of sunlight, reacts with hydrocarbons and oxygen forming ozone, being one of the main precursors of this pollutant in the troposphere. Nitrogen dioxide, when inhaled, reaches the outermost portions of the lung due to its low solubility in water11.
Its toxic effect is related to the fact that he is an oxidizing agent. The acute exposure to NO2 in-creases bronchial responsiveness, and wheezing and exacerbation of bronchial asthma, chronic
obstructive pulmonary disease and cardiovascu-lar diseases can occur and may also increase sus-ceptibility to infections20.
This study may have limitations, one of them is that in this article were studied only the pol-lutants O3, PM10 and NO2, but not the impact of exposition to other pollutants such as CO and SO2, which are not quantified by measuring station of Cetesb. The data of air pollution were detected in a fixed monitoring site, not represent-ing with accurately the level of individual expo-sure to pollutants; this could underestimate the impact of pollution on health. It is also assumed that children moved freely, and it has a restricted movement around town exposing themselves to pollutants on an ongoing basis.
Another limitation lies in the fact that they are secondary data that even obtained from offi-cial source (Datasus) may contain diagnostic er-ros; on the other hand, this source is commonly used in epidemiological studies about the effects of pollution on health, but it has a more import-ant aspect which is the accounting effect of the procedure. In addition, the Datasus does not tell the nutritional status, housing, medical history of the child, breastfeeding and passive smokers that may be associated with respiratory diseases.
Despite all these limitations it was still pos-sible to find association between pollution and hospital admissions due to respiratory diseases and it was the nitrogen dioxide that had
statisti-Figure 2. Relative risks and respective intervals of confidence in the hospitalizations according to the increase of
10 µg/m3 in the concentration of NO2,in the lags of zero to seven days in exposure to pollutants, Ribeirão Preto
– SP, Brazil, 2011 – 2013.
1.15
1.10
1.05
1.00
0.95
aúd
e C
ole
tiv
a,
23(8):2515-2522,
2018
cal significance, and can be considered a risk fac-tor for respirafac-tory diseases. The results presented here allow municipal manager to deploy policies aiming the reduced concentrations of air pollut-ants with the possible decrease of the incidence of hospitalizations due to respiratory diseases, re-duce financial costs for the Public Health System (SUS) and also reduce the social costs of the child and his family.
Collaborations
PC Camargo, LF Nakazato e LFC Nascimento participated in all stages of the article.
Acknowledgment
C
ar
valho PC
References
1. Mukai AO, Nascimento LFC, Alves KSC. Spacial anal-ysis of hospitalizations for pneumonia in the Vale do Paraíba region. J Bras Pneumol 2009; 35(8):753-758.
2. Brazil. Ministry of Health (MS). Departmentof Information and Informatics of the United Health System, Datasus. [cited 2015 May 17]. Available from: http://tabnet.datasus.gov.br/cgi/deftohtm.exe?sim/ cnv/obt10SP.def
3. Gouveia N, Freitas CU, Martins LC, Marcilio IO. Hospital admissions for respiratory and cardiovascular causes associated with air pollution in the city of São Paulo, Brasil. Cad Saude Publica 2006; 22(12):2669-2677.
4. Martins LC, Latorre MRDO, Cardoso MRAC, Gonçalves FLT, Saldiva PHN, Braga ALF. Air pollution and care for pneumonia and influenza in São Paulo, Brasil. Rev Saude Publica 2002; 36(1):88-94.
5. Negrisoli J, Nascimento LFC. Air pollutants and hospi-talizations for pneumonia in children. Rev Paul Pediatr 2013; 31(4):501-506.
6. Nascimento LFC, Pereira LAA, Braga ALF, Módolo MCC, Carvalho Júnior JA. Air pollution effects on chil-dren´s health in São José dos Campos, SP. Rev Saude Publica 2006; 40(1):77-82.
7. Cesar ACG, Nascimento LFC, Carvalho Júnior JA. Associations between exposure to particulate matter and hospitalizations for respiratory diseases in chil-dren. Rev Saude Publica 2013; 47(6):1209-1212.
8. Jasinski R, Pereira LAA, Braga ALF. Air pollution and hospital admissions for respiratory diseases in children and adolescentes in Cubatão, São Paulo, between 1997 and 2004. Cad Saude Publica 2011; 27(11):2242-2252.
9. César ACG, Nascimento LFC, Mantovani KCC, Vieira LCP. Fine particulate matter estimated by mathemat-ical model and hospitalizations for pneumonia and asthma in children. Rev Paul Pediatr 2016; 34(1):18-23.
10. Fusco D, Forastiere F, Michelozzi P, Spadea T, Ostro B, Arcà M, Perucci CA. Air pollution and hospital ad-missions for respiratory conditions in Rome, Italy. Eur Respir J 2001; 17(6):1143-1150.
11. Karr C, Lumley T, Schreuder A, Davis R, Larson T, Ritz B, Kaufman J. Effects of subchronic and chronic expo-sure to ambient air pollutants on infant bronchiolitis. Am J Epidemiol 2007; 165(5):553-560.
12. Cançado JED, Braga A, Pereira LAA, Arbex MA, Saldiva PHN, Santos UP. Clinical repercussions of exposureto air pollution. J Bras Pneumol 2006; 32(1):5-11.
13. Arbex MA, Santos UP, Martins LC, Saldiva PHN,
Pereira LAA, Braga ALF. Air pollution and respiratory system. J Bras Pneumol 2012; 38(5):643-655.
14. World Health Organization (WHO). Air quality
guide-lines. Global update 2005. Particulate matter, ozone, ni-trogen dioxide and sulfur dioxide. Copenhagen: WHO; 2005.
15. Brazilian Institute of Geography and Statistics (IBGE).
Cities. [Cited 2015 May 30]. Available from: http:// www.cidades.ibge.gov.br/xtras/perfil.php?lang=&cod-mun=354340.
16. Environmental Company of São Paulo. Air quality.
[Cited 2015 May 25]. Available from: http://ar.cetesb. sp.gov.br/qualar
17. Brazil. Health Ministry (MS). Department of
Information and Informatics of the United Health System. DATASUS. [Cited 2015 June 22]. Available from: http://tabnet.datasus.gov.br/cgi/tabcgi.exe?sih/ cnv/niSP.def.
18. Nicolussi FH, Santos APM, André SCS, Veiga TB,
Takayanagui AMM. Air pollution and allergic respi-ratory diseases in schoolchildren. Rev Saude Publica 2014; 48(2):326-330.
19. Castro HA, Hacon S, Argento R, Junger WL, Mello CF,
Castiglioni Júnior N, Costa JG. Respiratory diseases anda ir pollution in the city of Vitória, Espírito Santo, Brazil. Cad Saude Publica 2007; 23(4):630-642.
20. Arbex MA, Cançado JED, Pereira LAA, Braga ALF,
Saldiva PHN. Biomass burning and effects on health. J Bras Pneumol 2004; 30(2):158-175.
Artigo apresentado em 21/12/2015 Aprovado em 24/08/2016
Versão final apresentada em 26/08/2016
This is an Open Access article distributed under the terms of the Creative Commons Attribution License BY