Space-time description of dengue outbreaks in Cruzeiro, São Paulo,
in 2006 and 2011
RENATA MARZZANODE CARVALHO1, LUIZ FERNANDO COSTA NASCIMENTO2*
1Doctor of Health Sciences. Department of Mechanical Engineering. Faculty of Engineering of Guaratinguetá. São Paulo State University (Unesp), São José do Rio Preto, SP, Brazil. 2Doctor of Public Health. Department of Medicine. University of Taubaté, Taubaté, SP, Brazil
S
UMMARYStudy conducted at the University of
Taubaté, Taubaté, SP
Article received: 7/3/2013 Accepted for publication: 2/3/2014
*Correspondence:
Address: Rua Durval Rocha, 500 Vila Paraíba
Postal Code: 12515-710 Guaratinguetá – SP
Phone: +55 12 3125-1103 Fax: +55 12 3621-8796
http://dx.doi.org/10.1590/1806-9282.60.06.016
Conflict of interest: none
Objective: to identify patterns in the spatial and temporal distribution of cases of dengue fever occurring in the city of Cruzeiro, state of São Paulo (SP).
Methods: an ecological and exploratory study was undertaken using spatial analysis tools and data from dengue cases obtained on the SinanNet. The analy-sis was carried out by area, using the IBGE census sector as a unit. The months of March to June 2006 and 2011 were assessed, revealing progress of the disea-se. TerraView 3.3.1 was used to calculate the Global Moran’s I, month to month, and the Kernel estimator.
Results: in the year 2006, 691 cases of dengue fever (rate of 864.2 cases/100,000 inhabitants) were georeferenced; and the Moran’s I and p-values were signiicant in the months of April and May (IM = 0.28; p = 0.01; IM = 0.20; p = 0.01) with higher densities in the central, north, northeast and south regions. In the year 2011, 654 cases of dengue fever (rate of 886.8 cases/100,000 inhabitants) were georeferenced; and the Moran’s I and p-values were signiicant in the months of April and May (IM = 0.28; p = 0.01; IM = 0.16; p = 0.05) with densities in the same regions as 2006. The Global Moran’s I is a global measure of spatial autocorre-lation, which indicates the degree of spatial association in the set of informa-tion from the product in relainforma-tion to the average. The I varies between -1 and +1 and can be attributed to a level of signiicance (p-value). The positive value points to a positive or direct spatial autocorrelation.
Conclusion: we were able to identify patterns in the spatial and temporal dis-tribution of dengue cases occurring in the city of Cruzeiro, SP,and locate the census sectors where the outbreak began and how it evolved.
Keywords: dengue, geographic information systems, epidemiological surveil-lance, ecological study, spatial distribution of the population.
I
NTRODUCTIONIn the 1980’s, new cases of dengue were reported in Bra-zil1 and in the state of São Paulo, and in 1986 dengue was deined as a disease requiring compulsory notiication.2 The Vale do Paraíba suffered a dengue outbreak in 2002, on the state’s northern coast, municipality of São Sebas-tião, with 972 indigenous contaminations.3,4
A study conducted in the city of São José do Rio Pre-to between September 2001 and August 2006 using a spa-tial approach enabled the identiication of areas at higher risk for the occurrence of dengue fever, concentrated in the north part of the city. The geocoding process was ob-tained through equalization of the addresses of dengue cases with the segment map supplied by the city hall.5
Georeferencing and spatial analysis techniques have been increasingly used to assess the distribution of vectors and diseases transmitted by them, contributing to impro-ved surveillance and control activities. Its greatest use is to outline strategies dependent upon the different realities of which the city is composed. Thus, the use of these tools enables the identiication of risk areas that deserve inten-siication and/or prioritization of control measures. Sou-za-Santos & Carvalho6 demonstrated that the analysis of spatial data is an important tool in the surveillance and control not only of Aedes aegypti, but other insect vectors.
geoprocessing and spatial analysis techniques in the pro-gram, provided that these are used immediately after con-ducting the activities, can contribute to control actions, indicating the spatial clusters with greater incidence. Car-valho and Nascimento,8 who conducted the irst study in São Paulo’s Vale do Paraíba, using geoprocessing techni-ques to study the spatial and temporal distribution of dengue fever, were able to identify a pattern of the out-break occurring in the city of Cruzeiro in 2006.
This article has the objective of identifying patterns in the spatial and temporal distribution of dengue cases occurring in the city of Cruzeiro in the months of March, April, May and June 2006, compared with the same months
in 2011. The two years chosen can be justiied by the oc-currence of outbreaks, and the months listed correspond to the period with the greatest incidence of cases.
M
ETHODSThe area under study refers to the city of Cruzeiro loca-ted at the far eastern end of the state of São Paulo, in the region known as Vale do Paraíba; latitude 22º 33’ South and longitude 44º 60’ West, at an altitude of 514 meters, occupying 331 km², 36 km² of which constitutes urban area, and 295 km² rural area(Figure 1).9
FIGURE 1 Location of the city of Cruzeiro with territorial
boundaries and highlighting the Presidente Dutra Highway.10
The climate is tropical (hot and humid), with temperatures varying between 20 and 27°C. The hottest months are from November to April, and the coldest between May and Octo-ber. Rain is most present between December and March, with January being the wettest month. The driest period is covered between the months of June and September.
The cases of dengue fever occurring in the city are no-tiied to the Municipal Epidemiological Surveillance sec-tor and conirmed by laborasec-tory or clinical-epidemiolo-gical criteria in accordance with guidelines from the Ministry of Health.11
The ecological and exploratory study consisted in lis-ting the cases of dengue fever reported and conirmed, identifying the address and the date of onset of the irst symptoms, and distributing the data on the city map in accordance with the 96 census sectors for the year 2000 provided by the Brazilian Institute of Geography and Sta-tistics (available at: downloads.ibge.gov.br/downloads_ geociencias.htm).
The following approach were used to verify the asso-ciation between the incidence of dengue, and mapping of cases in the years 2006 and 2011 for the months of March, April, May and June; spatial statistical analyses were used to check for autocorrelation using the Local and Global Moran’s Iand the Kernel estimator.
To identify the presence of spatial autocorrelation, the Global Moran’s I was used (IM), which analyzed if the-re wethe-re any sector clusters with high rates, and clusters with low rates. The IM varies between -1 and +1 and may be attributed a signiicance level (p-value), considering the rates of each census sector in relation to the rates of neighboring sectors, and the average of this rate.
Once calculated, it is important to establish its statisti-cal validity, estimating its signiicance. If this value corres-ponds to an extreme simulation of a distribution, it is a va-lue with statistical signiicance. The closer to 1 (one), the greater the similarity between neighbors. The value 0 (zero) indicates that there is no correlation, and negative values in-dicate dissimilarity. The public domain application Terra-View developed by the Image Processing Division (DPI) of the National Institute of Spatial Research was used (availa-ble at: www.dpi.inpe.br/terraview/index.php).
The Kernel estimator, as stated, evaluates the events using analysis units. Taking into account that the popu-lation data is grouped and the oficial minimum grou-ping unit is the census sector, when attributing the known population data to the centroid of the region, there is the possibility of estimating the intensity of this process (po-pulation) using a Kernel function. The darker areas (hot spots) correspond to the higher density of cases.
R
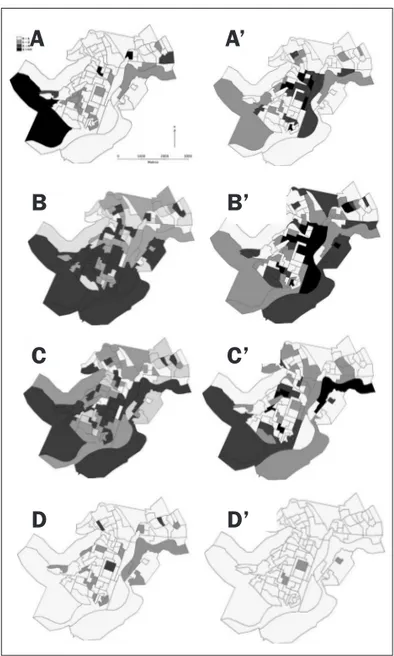
ESULTSThematic maps with the distribution of cases (Figure 2), according to the months of the year in 2006, show that the irst cases occurred in March, in the central and eas-tern region, on the banks of the Paraíba do Sul river and its efluent stream, called Córrego da Barrinha, also follo-wing the route of the railroad that cuts the central region of the city and highway linking Cruzeiro to Lavrinhas. In the month of April, cases appear in practically all census sectors, heading to the south, southeast, central region and northeast. In May, 76 (79%) census sectors had at least 1 case of dengue fever, with the highest number of cases in the central, south, southeast and east regions, following the course of the Paraíba do Sul river and Córrego da Bar-rinha stream. In June, only two sectors presented 3 cases, located in the north/northeast and central/south regions.
The Global Moran’s I and respective p-values for March, April, May and June are shown in Table 1. It can be seen that the Global Moran’s I was signiicant in the months of April and May, with a positive autocorrelation. In 2011, 654 cases of dengue fever were georeferenced (rate of 886.8 cases/100,000 inhabitants). The irst cases also occurred in March, in the north, northeast, central, south and southeast regions, with latter cases occurring in the north region. In the month of March, 70 cases were re-gistered, varying from 0 to 14 per census sector, while in April, 292 cases were recorded, varying from 0 to 24, 279 cases in May, varying from 0 to 26, and 13 cases in June, varying from 0 to 2 cases per census sector. It was not pos-sible to identify the address of 55 conirmed cases. The im-possibility of geocoding these cases was due, above all, to the absence or insuficiency of data contained in the Sinan database and failure to complete the Notiication Form.
TABLE 1 Moran’s I and p-values of the spatial distribution of dengue cases, Cruzeiro 2006 and 2011
Months Moran 2006 p-value Moran 2011 p-value
March 0.08 0.09 0.23 0.01
April 0.28 0.01 0.16 0.05
May 0.20 0.01 0.05 0.24
June 0.01 0.46 0.08 0.09
The thematic maps with distribution of cases (Figure 2), according to the months from the irst half of 2011, show that the irst cases occurred in March, near to the banks of the Paraíba do Sul River, and the Cruzeiro-Passa Qua-tro and Cruzeiro-Lavrinhas highways. In the month of April, the cases are located in the Central, South, North, Northwest and Northeast regions, taking over the entire urban extent of the city. In May, 80 (83%) of the census
sectors had at least 1 case of dengue. In the month of June, only one sector presented more than one case of dengue fever, situated in the north region.
The Global Moran’s I and respective p-values for March, April, May and June 2011 are shown in Table 1. Note that the Global Moran’s I was signiicant in the months of March and April, with a positive autocorrela-tion and signiicance.
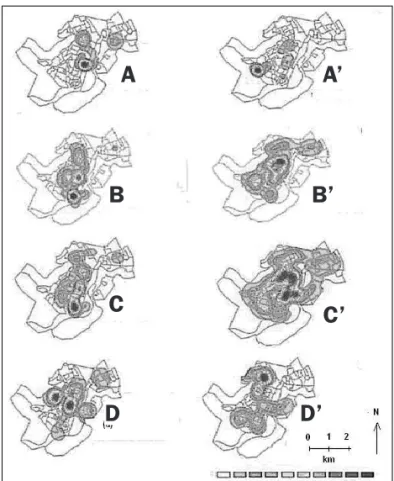
In March 2006, the highest density of cases occurred in the Central and North regions, as demonstrated by the Ker-nel estimator. In the months of April and May the highest density occurred in the North, Central and South regions. In June, the hot spot manifested in the Central, North, Nor-theast, Northwest and Southeast regions (Figure 3).
FIGURE 2 Distribution of cases of dengue according to census
sectors occurring in the months of March (A), April (B), May (C), and June (D) 2006, and in the months of March (A’), April (C’), May (C’) and June (D’) 2011, Cruzeiro, 2006 and 2011.
A
A’
B
B’
C
C’
group immunity against this agent can be identified as possible factors that led to the occurrence of the outbreaks, not only in the first wave, which occurred explosively, but also in the second, which had the highest incidence rate (864.2 and 886.8 cases per 100,000 inhabitants).
At both times, the outbreak began in one region, sprea-ding to almost all regions of the urban area, following the banks of the Paraíba do Sul river, highways and rail-ways cutting across the city and responsible for the large circulation of people, products and vehicles. This trend was also noted in a study conducted in the city of Tupã, state of São Paulo.7
In the month of April there was a sharp increase in the notiication and conirmation of cases, possibly as a consequence of the presence of breeding sites in urban areas, susceptible population, high temperatures and heavy rainfall.
The quarterly coverage of the “House to House” pro-gram in the city was reached by disease control agents in almost the entire city. Even so, there were dengue fever outbreaks in the years 2006 and 2007.12
In the Cruzeiro outbreaks, an explanation for the oc-currence of cases concentrated in different regions of the city could perhaps be due to the decrease in susceptibi-lity in the region where a larger number of cases occur-red, thereby shifting the concentration of the outbreak to another area.
In this study, fewer new cases were registered from the month of June onward, with milder temperatures and lower humidity levels recorded. This strongly suggests that the adverse climate conditions for proliferation of the vector have an important role in the transmission of the disease in the city.13
Three factors should be considered in the decrease in the number of cases in the outbreak: depletion of suscep-tible individuals; vector control interventions and unfa-vorable natural conditions, such as lower temperature and humidity, thereby reducing the vector population; and good sanitation conditions. Poorer areas that have good basic sanitation conditions may have the same le-vels of infestation as more afluent areas. On the other hand, areas with high coverage of water supply services and higher agglomeration of people in the same residen-ce present higher conresiden-centrations of the vector.14 In rela-tion to susceptible individuals, it has been suggested that in 2006 only one type of virus circulated in the region, se-rotype DEN-3, and therefore people became immune af-ter contact with the virus, a similar situation to that found in the city of Tupã.7
FIGURE 3 Comparative thematic maps with the Kernel estimator of the distribution of cases of dengue notified and confirmed in the months of March (A), April (B), May (C), and June (D) 2006, and in the months of March (A’), April (B’), May (C’) and June (D’) 2011, Cruzeiro, 2006 and 2011.
The month of March 2011 presented the highest density in the west region. In April, the hot spot was concentrated near to the Central region, facing north. In May, the highest den-sity occurred in the Central region, spreading a little to the East, North, Northeast and Nest. In the month of June, the hot spot moved to the north-south region (Figure 3).
D
ISCUSSIONIn this study, conducted at two different times using geo-processing techniques, it was possible to identify a spa-tiotemporal pattern of dengue outbreaks occurring in Cruzeiro in 2006 and 2011.
The introduction of the dengue virus in Cruzeiro pro-duced two large scale waves of outbreaks in the classic form of the disease. The risk of occurrence of these out-breaks was foreseeable owing to the intense circulation of the virus in the region, as well as the incidence of the disease in neighboring cities.
The infestation of the mosquito that transmits the dengue virus, population density and the lack of
A
A’
B
B’
C
C’
In 2011, the circulating serotype was DEN-1, which arose in the city for the irst time and was found in the entire susceptible population, including those already sensitive to DEN-3, resulting in another outbreak.
The Global Moran’sI applied to the cases ofdengue fever occurring in the months of March, April and May of 2006 and 2011 presented positive values, indicating a po-sitive spatial autocorrelation. The values tend to be simi-lar to neighboring sectors, indicating that the occurrence of cases of dengue fever in the city are connected, with a strong relationship between sectors, which is even stron-ger between nearby neighboring sectors. We must call at-tention to the fact that the Global Moran’s I presented a positive spatial correlation for the months of April and May 2006 and March and April 2011.Only the month of June 2011 presented a negative Global Moran’s I, which leads us to believe that there are sectors with high indices of dengue cases surrounded by sectors with low indices, though this did not present statistical signiicance.
Comparing the maps with the Kernel estimators for the years 2006 and 2011 (Figure 3), it can be noted that the hot spot did not behave in the same manner during the two outbreaks. In 2006, the hot spot began in the cen-tral region and moved North-south and East-west, whi-le in 2011, it began in the Center-west region and moved to the Central region and then inally the North-south and East-west regions.
In the months of April and May there was a sharp in-crease in the notiication and conirmation of cases, pos-sibly as a consequence of the presence of breeding sites in urban areas, susceptible population, high temperatu-res and heavy rainfall. The risk for dengue fever has also been identiied in areas with the highest concentration of individuals, high economic diversity, strong popula-tion density, high household density, and high density of vacant lots (wasteland) in more remote districts of the central region.15
Dengue control measures have been based exclusi-vely on chemical control of the vector to the detriment of important factors modulating the disease transmis-sion dynamics, especially those related to social determi-nants, such as spatial occupation and living conditions. Therefore, with each introduction of a new serotype the-re is a new outbthe-reak.15
The rapid growth of the urban population provides a major source of susceptible and infected individuals, concentrated in restricted areas. This fact, associated with poor sanitation, housing and cultural factors speciic to large urban centers provides the ecological conditions fa-vorable to the transmission of the dengue virus.16
Therefore, it is understandable that locations with a higher proportion of urban population may have higher incidences of dengue.17 The spatial relationship between the transmission of dengue and other variables, such as the level of immunity of the population, effectiveness of the control measures, degree of infestation by the vector, the habits and attitudes of the population, etc, must be assessed. It is important to reiterate that the studies using spatial location approaches and use of GIS, although re-cent in the scope of health sciences, have gradually beco-me indispensable for the analysis of disease determina-tion.15
Despite epidemiological surveillance guidelines for dengue fever, when investigating the probable locations of infection considering residence, workplace and travel, in the investigation form standardized by the Ministry of Health, only data referring to the residential address are structured to allow precise localization of the case. Thus, analyses considering the patient’s address as the risk fac-tor exposure site assume that individuals are immobile and ignore any possibility of exposure at other places, for example, work or leisure environments.18
With the use of information originating from public health services only, it is possible for some of the cases not to be computed, in addition to the occurrence of ca-ses whose clinical manifestation are discreet, leading to underreporting. Other sources of errors can be conside-red, such as disappearance of exam results, undetermi-ned diagnoses and failure to locate addresses.
Dificulties encountered in the georeferencing of re-ported cases of the disease, due to address problems, pre-vented the location of cases in census sectors.1, 5 We can-not say where the focus of infection is exactly, since people can either have contracted the disease in their own homes, or at work, while in transit or anywhere else in the city. Even with the dificulties described above, the prompt location of cases or the aggregation of information in small areas, such as census sectors, can be quite enligh-tening.18
The evaluation of different exposures to the factors involved in transmission allows us to identify geographic areas with a higher risk of infection, and this is funda-mental to the development of programs for the preven-tion and control of dengue fever.19
C
ONCLUSIONspread through the city on these two occasions, bearing in mind the presence of two different viral serotypes and the susceptibilities of the individuals.
R
ESUMODescrição espaço-temporal das epidemias de dengue em Cruzeiro, SP, em 2006 e 2011.
Objetivo: identiicar padrões na distribuição espaço-tem-poral dos casos de dengue ocorridos no município de Cruzeiro, SP.
Métodos: foi desenvolvido um estudo ecológico e explora-tório utilizando ferramentas de análise espacial e com da-dos de casos de dengue obtida-dos do SinanNet. Foi feita uma análise por área, tomando-se como unidade o setor censitá-rio do Instituto Brasileiro de Geograia e Estatística (IBGE). Foram analisados os meses de março a junho de 2006 e 2011, que mostraram o avanço da doença. Utilizou-se o progra-ma TerraView 3.3.1; foram calculados os índices de Moran global, mês a mês, e o estimador de Kernel.
Resultados: no ano de 2006, foram georreferenciados 691 casos de dengue (taxa de 864,2 casos/100 mil hab.); os índi-ces de Moran e p-valores foram signiicativos nos meses de abril e maio (IM = 0,28, p=0,01; IM = 0,20, p=0,01) com den-sidades maiores nas regiões central, norte, nordeste e sul. Em 2011, foram geocodiicados 654 casos (886,8 casos/100 mil hab.); os índices de Moran e p-valores foram signiicati-vos nos meses de março e abril (IM = 0,28, p=0,01; IM = 0,16, p=0,05) com densidades nas mesmas regiões de 2006. O ín-dice de Moran global (IM) é uma medida global de autocor-relação espacial, que indica o grau de associação espacial no conjunto de informações a partir do produto em relação à média. O IM varia entre -1 e +1, e a ele pode ser atribuído um nível de signiicância (p-valor). O valor positivo aponta para uma autocorrelação espacial positiva ou direta.
Conclusão: foi possível identiicar padrões na distribui-ção espaço-temporal dos casos de dengue ocorridos no município de Cruzeiro, SP, e localizar os setores censitá-rios onde a epidemia teve início e como evoluiu.
Palavras-chave: dengue; sistemas de informação geográ-ica; vigilância epidemiológgeográ-ica; estudo ecológico; distri-buição espacial da população.
R
EFERENCES1. Pontes RJS, Rufino-Netto A. Dengue em localidade urbana da região sudeste do Brasil: aspectos epidemiológicos. Rev Saúde Pública. 1994;28(3): 218-27. 2. Costa AIP. Identiicação de unidades ambientais urbanas como condicionantes
da ocorrência de Aedes aegypti (Diptera Culicidae) e de dengue na cidade de São José do Rio Preto, S.P., em 1995. [Dissertação]. São Paulo: Faculdade de Saúde Pública, Universidade de São Paulo; 1995.
3. Serpa LLN, Costa KVRM, Voltolini JC, Kakitani I. Variação sazonal de Aedes aegypti e Aedes albopictus no município de Potim, São Paulo. Rev Saúde Pública. 2006;40(6):1101-5.
4. São Paulo. (Estado). Secretaria da Saúde. Centro de Vigilância Epidemiológica. Dengue. São Paulo, 2011. [citado 1 fev 2011]. Disponível em: http://www. cve.saude.sp.gov.br/htm/zoo/if_sem_den02.htm.
5. Galli B, Chiaravalloti Neto F. Modelo de risco tempo-espacial para identiicação de áreas de risco para ocorrência de dengue. Rev Saúde Pública. 2008;42(4):656-63.
6. Souza-Santos R, Carvalho MS. Análise da distribuição espacial de larvas de Aedes aegypti na Ilha do Governador, Rio de Janeiro, Brasil. Cad Saúde Pública. 2000;16(1):31-42.
7. Barbosa GL, Lourenço RW. Análise da distribuição espaço-temporal de dengue e da infestação larvária no município de Tupã, Estado de São Paulo. Rev Soc Bras Med Trop. 2010;43(2):145-51.
8. Carvalho RM, Nascimento LFC. Spatial distribution of dengue in the city of Cruzeiro, São Paulo State, Brazil: use of geoprocessing tools. Rev Inst Med Trop São Paulo. 2012;54(5):261-6.
9. Cruzeiro. Prefeitura Municipal. Plano Municipal de Saúde 2010-1013. 49p. 10. Nascimento LFC, Batista GT, Dias NW, Catelani CS, Becker D, Rodrigues L. Análise espacial de neonatal no Vale do Paraíba, 1999 – 2001. Rev Saúde Pública. 2007;41(1):94-100.
11. Brasil. Departamento de Operações, Fundação Nacional de Saúde, Ministério da Saúde. Manual de dengue: vigilância epidemiológica e atenção ao doente. Brasília (DF): Departamento de Operações, Fundação Nacional de Saúde, Ministério da Saúde; 1995.
12. Chiaravalloti-Neto F, Costa AIP, Moura MSA, Soares MRD, Pereira FC, Battigaglia M, et al. Avaliação de ações municipais de combate a vetores da dengue na região de São José do Rio Preto, São Paulo, 1989 a 1995. Rev Soc Bras Med Trop. 1999;32(4):357-62.
13. Gubler DJ, Clark GG. Dengue/dengue hemorrhagic fever: the emergence of a global health problem. Emerg Infect Dis. 1995;2(1):55-7.
14. Mondini A, Chiaravalloti-Neto F. Variáveis socioeconômicas e a transmissão de dengue. Rev Saúde Pública. 2007;41(6): 923-30.
15. Flauzino RF, Santos RS, Oliveira RM. Dengue, geoprocessamento e indicadores socioeconômicos e ambientais: um estudo de revisão. Rev Panam Salud Publica. 2009;25(3):456-61.
16. Costa AIP, Natal D. Distribuição espacial da dengue e determinantes socioeconômicos em localidade urbana no Sudeste do Brasil. Rev Saúde Pública. 1998;32(3):232-6.
17. Teixeira MG, Costa MCN, Barreto ML, Mota E. Dengue and dengue hemorrhagic fever epidemics in Brazil: what research is needed based on trends, surveillance, and control experiences? Cad Saúde Pública. 2005;21(5):1307-15.
18. Almeida MCM, Assunção RM, Proietti FA, Caiaffa WT. Dinâmica intra-urbana das epidemias de dengue em Belo Horizonte, Minas Gerais, Brasil, 1996-2002. Cad Saúde Pública. 2008;24(10): 2385-95.