Rev. bras. oceanogr., 46(1):33-43, 1998
Brazilian
sardine
(Sardinella brasiliensis)
spawning in the southeast
Brazilian Bight over the period 1976-1993
Yasunobu Matsuura
Instituto Oceanográ fico da Universidade de São Paulo (Caixa Postal 66149, 05315-970 São Paulo, SP,Brasil)
.
Abstract: Based on sampling ()v~rthe period 1976-1993 in the southeast BrazilianBight, the distribution of spawning of the Brazilian sardine (Sardinella brasiliensis) is described in relation to environmental conditions. The area of intense spawning occurs in the southem part of the bight where coastal upwelling was less ftequent. Spawning intensity showed high interannllal variation and the egg abundance in the survey area ranged ITom 99 billion eggs in tlle January 1988 cruise to 4669 billion eggs in the January 1981 cruise. Peak spawning takes place one hour after midnight and eggs hatch out within 19 hours with a water temperature of24°e.
. Resumo: Baseado nos dados coletados durante nove cruzeiros oceanográficos
realizados na região sudeste, as Úreasde desova da sardinha-verdadeira(Sardinella
brasiliensis)foram apresentadas e discutidas em relação às condições oceanográficas.
As áreas de desova intensiva foram localizadas na parte sul da área de investigação, onde a ressurgência costeira foi nH:nosITeqüente. A intensidadede desova demonstrou uma variação anual relativamente grande. A produção total de ovos da sardinha-verdadeira variou de 99 bilhões de ovos durante o cruzeiro de janeiro de 1988 para 4669 bilhões de ovos em janeiro de 1981. O pico de desova ocorre na camada de mistura de superficie uma hora após a meia noite e os ovos ec10demem 19 horas com a temperatura de água 24°e.
.
Descriptors:Brazilian sardine, Spawning area, Southeast Brazilian Bight..
Descritores:Sardinha-verdadeira, Área de desova, Região sudeste.Introduction
The Brazilian sardine (Sardinella brasiliclIsis)
tishery was started in the late 1950s and total landings increased during the 1960s, attaining the maximum catch of 228 thousand tons in 1973. Over the ncxt 15 ycars, the total landings stayed at the levei of 90-140 thousand tons. Recently landings dec1ined to 3 I thousand tons in 1990, but 'recovered to 85 thollsand tons in 1994.
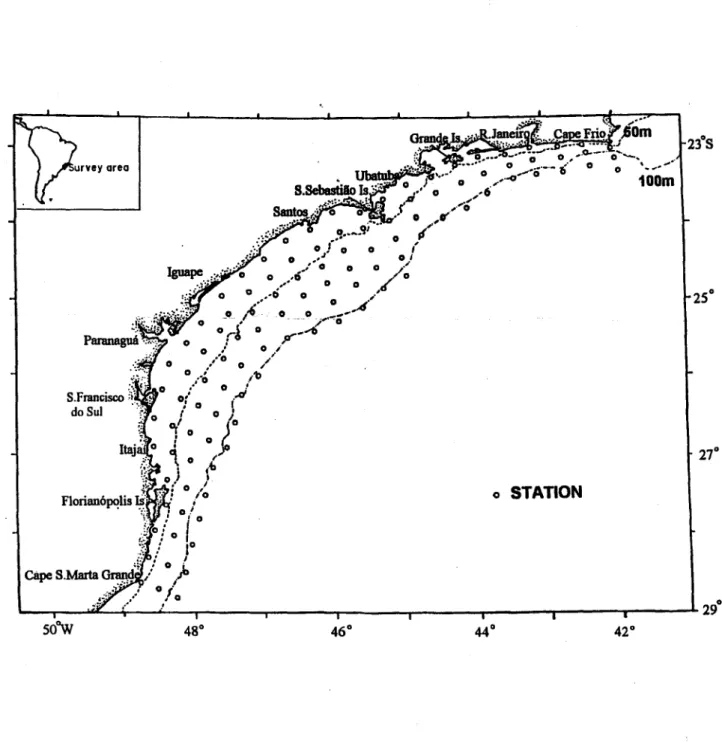
The sardine fishery takes place in the coastal region of the southeast Brazilian Bight betweennos
and 29°S, by small purse seiners. The Brazilian sardine is an isolated stock within the bight. It spawns
('011/1'. 110.8/3 do /I1S/. oceal1ogrda Usp.
in the coastal area during the late-austral spring and summer, but peak spawning occurs during December and January. First maturity is attained at 160 mm TL, at about one year old (Saccardo & Rossi-Wongtschowski,1991).
Sardine spawning investigations were started in 1969 and many survey cruises have becn undertaken since then (Matsuura, 1971; 1979). In this paper 1 describe the results of nine survey cruiscs carried out during the period 1976-1993.
Material and methods
34 Rev. bras. oceanogr., 46( 1), 1998
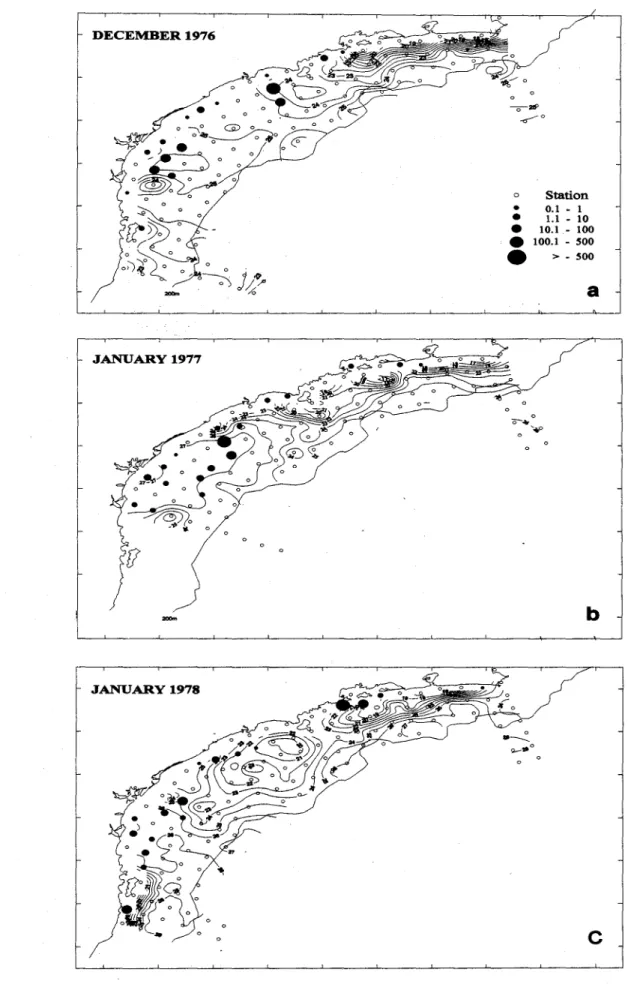
survey cruise was 20 n.m. with the exception of two cruises (Jan./1980 and Jan./1981), when a 30 n.m. intervalwas used. Numbers of sardine eggs at non-zero stations (Fig. 2) are represented by the size ofthe black dots. To estimate the spawning area the area represented by a polygon around the station (Sette & Ahlstrom, 1948) was used.
The plankton samples taken with the coarse mesh net (0.505 mm) were preserved in a 10% formalin solution. Temperature and salinity were measured using a reversing thermometer with Nansen bottle or by CTO cast.
o
100m
o STATION
o
29 so'W
MATSUURA: BraziJian sardine spawning in 1976-1993 35
Identification of the sardine eggs was based on the literature (Matsuura, 1971) and the embryonic stages of eggs were determined on the basis of Loet al's criteria (1996). Total numbers of eggs taken were transformed into number per square meter of sea surface using the following expression (Tanaka, 1973):
where: Yi= numberof standardizedeggsper I m2of
sea surface at station i; Xi= number of eggs taken at station i; Vi = volume of water filtered (m3); di = maximum depth ofhaul (m).
The sardine eggs are distributed in the upper mixed layer (Matsuuraet aI.,1992), in which the water
temperature is relatively homogeneous during the main spawning season, ranging ITom 22 to 26°C with .an average of 24.6°C. Average age of the embryonic stage ITomspawning was ca\culated using the equation givenbyLoetal. (1996):
Yi,1 = 82.832e -0.21031-0. 1139i+O.005Ii i 1,4024 (2)
Statistical estimates of standardized abundal1ceof eggs were made using the deIta-distribution (Pennington, 1983; 1996). Aitchison (1955) ~ave methods for estimating the mean and variance Qt' a random variable that has a non-zero probability of being equal to zero and whose conditional distributiol1 01'non-zero values is 10gnormalIydistributed. Thh; ís ollr case as the average percentage of zero statioo:> during nine cruises was 73.3% in the survey area and the non-zero values of positive stations were lognormally distributed.
Results
Overall distribution of Sardine eggs in different years
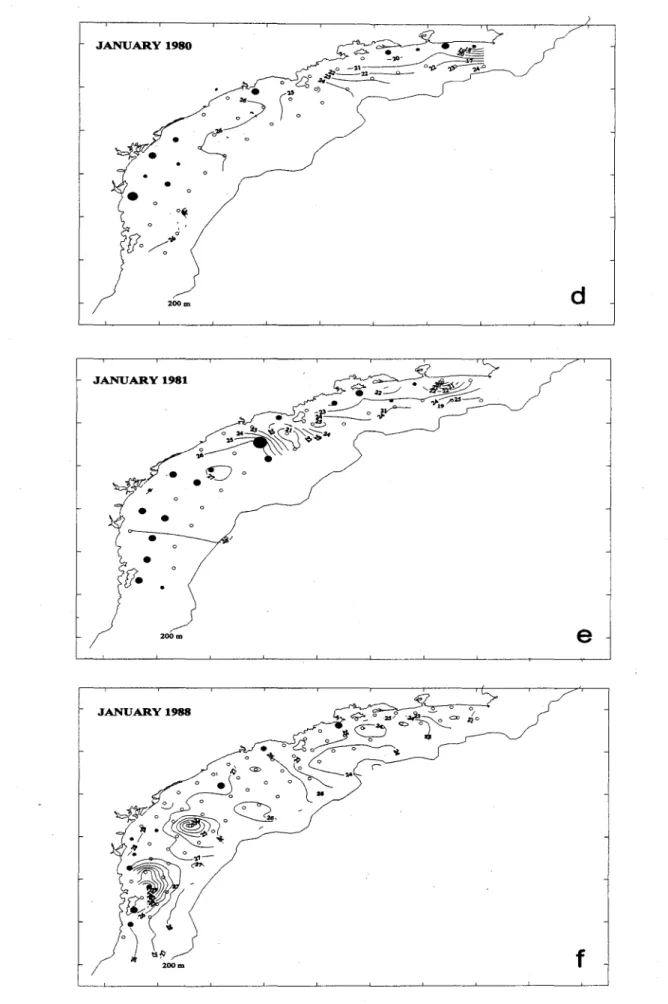
The distribution 01' sardine eggs in the pcriod 1976-1980 is shown in Figure 2 (a,b,c,d). Ingeneral, there is a similarity between the distribution patterns of the eggs and the horizontal distribution 01' water temperature in different years. We can identifYthree spawning areas: State 01' Rio de Janeiro coast, off Santos-Iguape, and between Paranaguá and Itajaí. The highest egg abundance was found in the sOllthem spawning area which extended ITomthe coast to the
(I)
100 m isobath line in most cases. Along the Rio de Janeiro coast, sardine eggs were found at coastal stations. The distribution pattem in the January 1981 cruise was similar to those of the p.revious four cruises, but the highest density of eggs (13,608 eggs m-2) was found at a station south of Santos (Fig. 2e).
The distribution pattem and egg density of the January 1988 cruise differed from those of ali other cruises. Only nine of 78 sampling stations were positive for sardine eggs and the avcrage egg densíty was the lowest (1.1 eggs m-2) (Table 1). No coastal upwelling was observed at Cape Frio region, but was found around the Florianópolis Island. The spawning area was of only 9,290 km2 and ali positive stations were dose to the coast (Fig. 2t).
The last three cruises show a similar egg distribution pattem with three spawning areas: Ubatuba~Santos, Iguape-Paranaguá, and São FrancÍ!~codo Sul-Florianópolis Island (Fig. 2 g,h,i). The January 1993 cruise showed a higher egg density than the other two cruises and also had a larger spawning area (34,430 km2). Along the Rio de Janeiro coast only minor percentages of sardine eggs were found nearshore on the three cruises.
Average temperature at 10m depth for alI positive stâtions was 24.3°C and the temperature of most of the stations fell within 21.3-27.3°C (Fig. 3). At some !ltations the thermocline was shallow, thus the tcmperature at 10m depth showed low values which are related to the presence of South Atlantic Central Water at the surface. Average salinity was 35.2 psu, ranging from 33.2 to 37.1 psu.
Peak spawning time and embryonic developmentaI stages
Time of spawning can be deduced from the pre:>enceof early stage eggs in plankton samples. A comparison between sampling'.. time and the developmental stages of eggs is shown in Figure 4. Most stage II eggs were found around 23:00-07:00 hours with an average time of 02:42. From the equation of Loet aI. (1996), the expected age of the
36 Rev. bras. oceanogr., 46(1), 1998
DECEMBER 1976
o Station
.
0.1 - 1.
1.1-10
.
10.1- 100.
100.1 - 500.
>-
500a
JANUARY 1977
...
b
MATSUURA: Brazilian sardine spawning in 1976-1993 37
JANUARY 1980
200m
JANUARY 1981
200m
JANUARY 1988
d
e
f
38
Rev. bras. oceanogr., 46( I), 1998
JANUARY 1991
DECEMBER 1991
h
i
~
Fig. 2 (cont.). Spawning areas ofthe Brazilian sardine. g) JanU!lry1991, h) Oecember 1991, i) January 1993.
MATSUURA: Brazilian sardine spawning in 1976-1993 39
Table I. Estimate of sardine egg numbers during nine survey cruises in the southeast Brazilian Bight.
38
32 12
,
14 16 18 20 22 24 26 28 30
Temperature
Fig. 3. Temperature and salinity at 10m depth of positive stations of the Brazilian sardine eggs iTom nine survey cruises.
Cruise No. Stations Number of Percentagc of Mean egg no. Variance Spawningarea Total no. SI. error of Positive Positivc (per square m) (in square km) ofegg mean no.
station stations (%) (in billion) of eggs December 1976 82 17 20.73 33.30 610.47 232\3 3039.50 24.71 January \977 69 18 26.09 7.63 \7.23 25640 696.30 4.15 January \978 82 17 20.73 27.24 27.24 20730 2486.20 5.22 January 1980 42 \1 26.19 8.67 43.08 25190 791.20 6.56 January \98\ 42 \7 40.48 51.16 \300.99 42570 4669.80 36.07
January 1988 78 9 11.54 1.09 0.45 9290 99.00 0.67
January \991 88 13 \4.77 2.99 4.11 \9730 273.10 2.03 December 199\ 110 \9 17.27 1.27 0.3\ 21250 \15.70 0.56 January 1993 110 29 26.36 15.01 85.25 34430 1369.60 9.23
.
.
. .
37
+
..
.
..
.
.
.
.
,
. .
.
..
.
36
+
.
.
.
.. ·
ft
., ..
.., .
.
.
.
... . ·
,
.. .ti
t
.
..
.
.
.
. .
."..
'I.
,
.
.-35
... ..
.
..,
:i
...
... .. .
34
+
.8. , . .
.
.
.
.
.
.
.
40 Rev. bras. oceanogr.. 46( I), 1998
Fig. 4. Embl)'onic developmental stage in relation to sampling time. The graph shows the mean sampling time, :f: standard errors and minimum/maximum values.
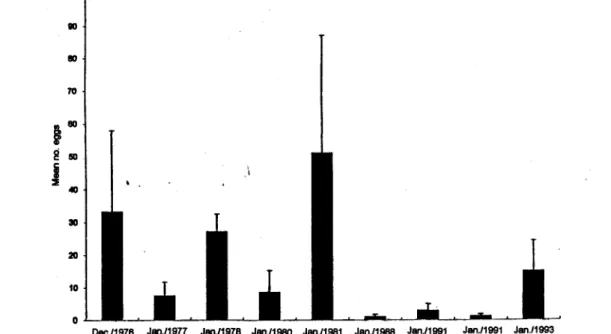
Total abundance of sardine eggs spawned in different years
Within the southeast Brazilian Bight, sardine spawning normally takes place in the area between the coast and the 100 m isobath, with the exception of the Rio de Janeiro coast where some sardine eggs were taken at stations seaward of the 100 m line. The standard survey area presented in Figure I has a total area of 91,278 km2. The total number of sampling stations in this area varied from 42 to 110 and the proportion of positive stations ranged from 11.5% to 40.4% (Table I). The average density of sardinc eggs ranged from 1.08 eggs m-2 from 9,290 kl112of spawning area in Janual)' 1988 to 51.16 eggs m-2from 42,570 km2in Janual)' 1981 (Fig. 5). Total numbers of sardine eggs in different spawning seasons ranged from 99 billion eggs in January 1988 to 4 669 billion eggs in Janual)' 1981. lt is clear that sardine spawning was low during three spawning seasons, namely Janual)' 1988, Janual)' 1991 and December 1991. The number of sardine eggs spawned and the spawning area of the last survey cruise in Janual)' 1993 showed a rccovel)' of spawning activity with a total egg abundance of 1 369 billions.
Discussion
During the first five cruises, coastal upwelling was observed along the coast of Rio de Janeiro and the cold surface layer extended from Cape Frio to Grande Island, except for the Janual)' 1981 cruise, when upwelling was limited to Cape Frio (Fig. 2e). Most spawning took place in the southem area where the coastal upwellingwas less frequent. During the last three cruises (1991-1993) the coastal upwelling was observed in two areas: off Cape Frio-Grande Island and off Florianópolis Island-Cape Santa Marta Grande. During the austral summer the South Atlantic Central Water (SACW) intrudes into the coastal region along the botlom layer over the continental shelf. The presence of the SACW in the botlom layer of the coastal region seems to be important for the creation of the sardine spawning habitat, as it implies an input of the nutrient rich water mass in the euphotic zone. An oceanic front is formed at the sea botlom between the warm Coastal Water and the cool SACW and runs from Itajaí to Ubatuba along the 50 m isobath line (Matsuura,
1996).
03 24 21 18 O 15 C;
12
-f-<
09
oJ
IÓ
03t I _ I
cp
001
I
I I111 IV V VI VII VIU IX X XI
.211
I
MATSUURA: Brazilian sardine spawning in 1976-1993 fIlO 8D 80 70 30 20 10 o 41
Dec.l1976 Jan.l1977 Jan./1976 Jan.l1960 Jan.l1961. Jan.l1966 Jan.l1991 Jan.l1991 Jan.l1993
Fig. 5. Estimates of mean density of the sardine eggs during nine survey cruises. Bar shows mean egg dcnsity at each cruise with standard errors ofmeans shown in T-line.
The spawning area showed some annual variation in its location, but the main southem spawning ground was consistently found between Paranaguá and Florianópolis Island on nine cruises. During the last two cruises (December 1991 and January 1993) a large spawning ground was formed around the São Sebastião Island, but this area was not used for spawning during the other seven cruises.
The sardine population in the bight was stable over the period 1974-1987, maintaining total annual landings of 90-140 thousand tons. Due to an oceanographic anomaly in the 1986/1987 spawning season, a recruitment failure occurred in the 1987 year cIass, resulting in.a drastic decline of the spawning stock biomass in subsequent years (Castello el ai.,
1991; Matsuura el ai., 1992; Cergole, 1995). This
population decline was confirmed in the present study by very low egg density on the January 1988 cruise and the poor spawning continued until the 1991/1992 spawmng seasons.
The time of sardine spawning has been determinedby the presence of early stage eggs taken at a certain time of day in the sea and normally occurring during the night (Ahlstrom, 1943;.~hing, 1960; Simpson & Gonzalez, 1967; Simpson, 1971; Matsuura, 1983; Alheitet ai., 1987). Noctumal spawning of the
cIupeoids is a common behavior pattem and appears to be related to a survival strategy of pelagic fishes to protect the recently-spawned eggs from carnivorous predators in the surface layer. Only the SW Atlantic anchovy(Engraulis anchoita)on the southeast coast of
Brazil spawns throughout ali the day in the less illuminated bottom layer (Asanoel ai., 1991). On the
other hand the spawning of demersal fish takes place in general at sunset (Colinet ai., 1987; Colin, 1992 for
groupers; Blaxter & Holliday, 1963 for herring; Carter
& Perrine, 1994; Cuellarel aI., 1996 I(x snappers;
Lobel, 1978 for angelfish).
The duration of each developmelltal stage at different temperatures has been measured experimentally for sardine(Sardinops spp.) eggs. At
lower temperature the development of crnbryos at stages VII, VllJ, and IX is delayed relative to other stages (Ito, 1958; Le Clus & Malan, 1995). Consequently the developmental curve between egg stage and embryonic age at lower tel11perature is sigmoidal,but at higher temperatures the rdationship is nearly linear. The embryonic developmental curve for
Sardinella brasiliensis is almost linear in these
observations, with r = 0.95. Goodness 01'tit tests for regression (temperature-corrected age 01' cach stage versus mean sampling time) showcd that the curvilinearityof regression was rejected with p = 0.05 (F = 4.196 withd.f. I and 8).
Using Loel ai.'s equation (1996), the embryonic
mortality rate was estimated based on the samples taken on four survey cruises (From Jan.88 to Jan.93).
The mortality rate obtained from this calculation was
42 Rev. bras. oceanogr., 46(1), 1998
mordax) eggs based on the CalVET samples ranged
fi'om 0.14 to 0.45 (Picquelle & Hewitt, 1983; 1984). Asano et ai. (1991) obtained the daily embryonic
mortality rate of 0.32 for Engraulis anchoita in the
same area for the Brazilian sardine and Loet ai.(1996)
obtained 0.12 for Sardinops sagax in southem
Califomia.
Total egg production estimated for nine cruises showed relatively high inter-annual variation. Comparison of the spawning stock biomass estimated by VPA (Cergole, 1995) and daily egg production tTom eight cruises shows that there is a positive correlation among them with a coefficientof correlation, r = 0.81.
Therefore, we may conclude that the spawning intensity measured by egg abundance is representative of spawning stock density, exception made of the January 1981 cruise.
Acknowledgements
The author wishes to thank Dr. Alec D. MacCalI of the Southwest Fisheries Science Center for the revision and critical reading of the manuscript. I also thank the captain W.C. Freitas and crew of the R/V "Prof. W Besnard" for their cooperation during survey cruises. The present investigation received the tinancial support of the CIRM, FAPESP and CNPq. The author received a research fellowship ofthe CNPq (process no. 301675/82) during investigation. This is a product of the SCOR Working aroup 98. Two anonymous reviewers are thanked for their useful comments and suggestions.
I~eference
Ahlstrom, E. H. 1943. Studies on the Pacific pikhard or sardine (Sardinops caerulea). 4. Influence of
temperature on the rate of development of pilchard eggs in nature. Spec. scient. Rep., U.S. Fish WildI. Serv., 23: 1-26.
Aitchison, l 1955. On the distribution of a positive random variable having a diserete probability mass at the origino l Am. statist. Ass., 50:901-908.
Alheit, J.; Wahl, E. & Cihangir, B. 1987. Distribution, abundanee, development rates, produetion and mortality ofsprat eggs. ICES. Coune. Meet. 7p. Asano, K.; Matsuura, Y. & Katsuragawa, M. 1991.
Daily egg production of the Brazilian anehovy,
Engraulis anchoita. BulI. Fae. Bioresour., Mie
Univ.,6:47-55.
Blaxter, J. H. S. & Hollyday, F. a. T. 1963. The behaviour and physiology of herring and other clupeoids. Adv. mar. BioI., 1:261-393.
Carter, l & Perrine, D. 1994. A spawning aggregation of dog snapper,Lutjanus jocu (Pisees: LUDanidae)
in Belize, Central America. BulI. mar. Sei., 55(1):228~234.
CastelIo,J. P.; Habiaga,R. P.; Amaral, l C. & Lima Jr, I. D. 1991. Prospeeção hidroaeústiea e avaliação da biomassa de sardinha e anehoita, na região sudeste do Brasil (outubro/novembro de 1988). Publção esp. Inst. oeeanogr., S Paulo, (8):15-29.
Cergole, M. C. 1995. Stoek assessment ofthe Brazilian sardine,Sardinella brasiliensis,of the southeastem
coast ofBraziI. Seientia Marina, 59(3-4):597-610. Colin, P. L.; Shapiro, D. Y. & Weiler, D. 1987. Aspeets of the reproduetion of two groupers,
Epinephelus guttatus andE. striatus in the West
Indies. BulI. mar. Sei., 40(2):220-230.
Colin, P. L. 1992. Reproduetionofthe Nassau grouper,
Epinephelus striatus, (Pisces: Serranidae) and its
rehitionship to environmental eonditions. Envir. BioI. Fish., 34(4):357-377.
Cuellar, N.; Sedberry, a. R. & Wyanski, D. M. 1996. Reproduetive seasonality, maturation, feeundity, and spawning fi'equency of the vermilion snapper,
Rhomboplites aurorubens, off the southeastem
United States. Fish. BulI., 94(4):635-653.
Cushing, D. H. 1960. Fishing gear and fish behaviour. In: Rosa Jr., H. & Murphy, a. eds Proeeedings of the world seientific meeting on the Biology of sardines and related speeies. Roma, FAO. 3:1307-1326.
Ito, S. 1958. On the relation between water temperature and incubation time of sardine (Sardinops melanosticta). Ann. Rep. Japan Sea reg. Fish. Lab., 4:25-31.
Le Clus, F. & Malan, P. E. 1995. Models of temperature-dependent rate of development of pilchard Sardinops sagax eggs, to be used in
routine proeedures for estimating daily egg production. S. Afi'. l mar. Sei., 16:1-8.
Lo, N. C. H.; Ruiz, Y. A. a.; Cervantes, M. l; Moser, H. a. & Lynn, R. J. 1996. Egg production and spawning biomass of Paeifie sardine (Sardinops
sagax) in 1994, determined by the daily egg
MATSUURA: Brazilian sardine spawning in 1976-1993 43
Lobel, P. S. 1978. Diel, lunar, and seasonal periodicity in the reproductive behavior of the Pomacanthid fish,Centropygepotteri,and some other reef fishes
in Hawaii. Pacif. Sei., 32(2):193-207.
Matsuura, Y. 1971. A study of the life history af
Brazilian sardine,Sardinella aurita. I. Distribution
and abundance of sardine eggs in the region of Ilha Grande, Rio de Janeiro. Bolm Inst. oceanogr., S Paulo, 20( I):33-60.
Matsuura,Y. 1979. Distributionand abundance of eggs and larvae of the Brazilian sardine, Sardinella
brasi/iensis,during 1974-75 and 1975-76 seasons.
Bull.japan. Soe. Fish. Oceanogr., 34:1-12. Matsuura, Y. 1983. Estudo comparativo das fases
iniciais do ciclo de vida da sardinha-verdadeira,
Sardinella brasi/iensis e da sardinha-cascuda,
Harengula jaguana, (Pisces: Clupeidae) e nota
sobre a dinâmica da população da sardinha-verdadeira na região sudeste do BrasiL Tese de livre-docência.Universidade de São Paulo. Instituto Oceanográfico. 150p.
Matsuura, Y. 1996. A probable cause of recruitment failure of the Brazilian sardine Sardinella allrita
population during the 1974/1975 spawning season. S. Afi'. J. mar. Sei., 17:29-35.
Matsuura, Y.; Spach, H. L. & Katsuragawa, M. 1992. Comparison of spawning pattems of the Brazilian sardine (Sardinella brasiliensis) and anchoita
(Engralllis anchoita) in Ubatuba region, southem
Brazil during 1985 through 1988. Bolm Inst. oceanogr., S Paulo, 40(1/2):101-115.
Nakai, Z. 1962. Studies of intluences of environmental factors upon fertilization and development of the Japanese sardine eggs with some reference to the number of their ova. BulI. Tokai reg. Fish. Res. Lab.,9:109-150.
Pcnnington, M. 1983. Efficient estimators of abundance, for fish and p1ankton survcys. Biometrics, 39:281-286.
Pennington, M. 1996. Estimating the mean and variance fi'om high1yskewed marine data. Fish. BulI., 94(3):498-505.
Picquelle, S. J. & Hewitt, R. 1983. The northem anchovy spawning biomass for the 1982-1983 Califomia fishing season. Ca1COFI Rept., 24:16-28.
Picquelle, S. J. & Hewitt, R. 1984. Estimates of the spawning biomass of the northem anchovy for the 1983-1984 Califomia fishing season. CalCOFI Rept.,25:16-27.
Saccardo, S. A. & .Rossi-Wongtschowski,C. L. D. B.
1991. Biologia e avaliação do estoque da sardinha
Sardtnella .brasiliensis:uma compilação. Atlântica,
Rio Grande, 13(1):29-43.
Sette, O. E. & Ahlstrom, E. H. 1948. Estimations of abundance af the eggs of the Pacific pilchard
(Sardtnops caerulea)offsouthernCalifomia during
1940 and 1941. J. mar. Res., 7(3):511-542. Simpson, A. C. 1971. Diel spawning behaviour in
populations of plaice, dab, sprat and pilchard. J. du Cons., 34;58-65.
Simpson, J. G. & Gonzalez, G. 1967. Some aspects of the earlylife history and environmentofthe sardine,
Sardinella anchovia, in eastem Venezuela. Ser.
Recur. Explot. Pesq., 1(2):38-83.
Tanaka, S. 1973. Stock assessment by means of ichthyoplankton surveys. FAO Fish. tech. Pap., 122:33-51.
(Manuscript received27October1997;revised