ORIGINAL ARTICLE
Concordance between tracheal aspirate culture and
bronchoalveolar lavage analysis in the diagnosis of
ventilator-associated pneumonia*
MARIA VERÔNICA COSTA FREIRE DE CARVALHO1
, GEÓRGIA FREIRE PAIVA WINKELER2
,
FABRÍCIO ANDRÉ MARTINS COSTA2
, TEREZA DE JESUS GOMES BANDEIRA3
, EANES
DELGADO BARROS PEREIRA4
, MARCELO ALCANTARA HOLANDA
Background: The value of tracheal aspirate culture and Gram stain testing in the etiologic diagnosis of ventilator-associated pneumonia (VAP) remains controversial.
Objective: To assess consistency between the results of quantitative cultures and Gram stain testing (of endotracheal aspirates and bronchoalveolar lavage) in VAP patients.
Methods: Between October 2001 and August 2002, we prospectively studied all patients had been under mechanical ventilation for more than 48 hours and were suspected of having VAP. At the time of clinical suspicion, tracheal aspiration followed by a bronchoalveolar lavage was performed. Diagnosis of VAP was based upon a positive quantitative culture (≥ 104
cfu/ml) in the bronchoalveolar lavage fluid.
Results: Among 119 patients, 32 (26.8%) were suspected of having VAP, which was confirmed in 25 (78%). Comparison between Gram testing of endotracheal aspirates and culture results of the bronchoalveolar lavage showed moderate consistency (Kappa coefficient = 0.56). There was consistency between quantitative cultures of endotracheal aspirate and bronchoalveolar lavage in 22 (88%) of the 25 patients and no consistency in 3 (12%). (Kappa coefficient = 0.71). The sensitivity and specificity of the endotracheal aspirate culture with a cutoff of 106
cfu/ml were 72% and 71%, respectively.
Conclusions: The combination of Gram stain testing and quantitative culture of endotracheal aspirate may contribute to the diagnostic evaluationof VAP.
Key words: Bronchoalveolar lavage/methods. Pneumonia/diagnosis. Respiration, artificial. Prospective studies.
* Study carried out in the Respiratory Intensive Care Unit of the Pulmonology Department of the Messejana Hospital, Fortaleza, Ceará
Correspondence to: Maria Verônica Costa Freire de Carvalho. Rua Monsenhor Bruno, 780, Apto 401. Meireles. Fortaleza, Ceará. CEP: 60115-190. Tel (85) 461-1180. e-mail: [email protected]
Submitted: 19/05/2003. Accepted, after revision: 16/10/2003
Abbreviations used in this paper
TA – Tracheal aspirate
ATS – American Thoracic Society PSB – Protected specimen brush BAL – Bronchoalveolar lavage FiO2 – Fraction of inspired oxygen
MSSA – Methicillin-sensitive Staphylococcus aureus MRSA – Methicillin-resistant Staphylococcus aureus
NCCLS – National Committee for Clinical Laboratory Standards VAP – Ventilator-associated pneumonia
PMNL – Polymorphonuclear leukocyte RR – Relative risk
ARDS – Acute respiratory distress syndrome cfu – colony forming unit
NPV – Negative predictive value PPV – Positive predictive value
I
NTRODUCTIONVentilator-associated pneumonia (VAP) is a frequent and severe complication in patients in the intensive care unit (ICU). It is a prevalent infection, and the risk of acquiring the infection is 3 to 10 times greater in patients on invasive mechanical ventilation.(1)
Mortality among victims of VAP ranges from 24% to 50%, reaching as high as 76% in some locales or when the infection is caused by highly infectious microorganisms.(2)
Potentially multidrug-resistant microbes are primarily responsible for the high mortality rates seen in VAP patients. Studies have shown that inappropriate antibiotic therapy is an independent factor for increased mortality,(3)
since it implies treatment failure and the potential emergence of multidrug-resistant microbes. Therefore, rapid and precise identification of the etiologic agent, avoiding the need for empirical use of antibiotics, may directly affect prognosis.(4)
In the literature, the real impact that the identification of the etiologic agent would have on some patient subgroups is controversial.(3,5-7)
When endogenous microbial agents such as Methicillin-sensitive Staphylococcus aureus (MSSA), Streptococcus pneumoniae or Haemophilus influenzae (which are all considered primary pathogens) are involved, it is debatable whether VAP has an influence on mortality rates.(3)
On the other hand, when the etiologic agents involved are highly infectious ones such as Pseudomonas aeruginosa, Acinetobacter baumannii or Methicillin-resistant Staphylococcus aureus (MRSA), mortality rates are considerably higher, with a relative risk (RR) of 20.2. In these cases, microbiology testing might improve the prognosis.(5,6,7)
It is also debatable whether invasive techniques used in order to identify the etiologic agent have any real impact on the condition of the patient. Recent studies have shown that such invasive techniques have no effect on morbidity and mortality rates.(8-10)
However, a multicenter study showed that invasive procedures, including bronchoalveolar lavage (BAL) and protected specimen brush (PSB), result in lower morbidity and mortality rates, as well as fewer days on antibiotic therapy, when compared to noninvasive procedures such as tracheal aspirate (TA) culture.(11)
Recent evidence suggests that the impact of etiologic investigation on the evolution of VAP should be related to the proper timing in the identification of the microorganism. Patients with inadequate antibiotic therapy would have worse prognoses if a change in regimen was delayed while waiting for the microbiological results.(12)
However, if the change was based on early identification of the pathogen (within 12 hours of clinical suspicion), it would probably have a positive impact on patient prognosis.(13)
Despite great advances and the various studies that have attempted to define the best diagnostic method for VAP, we still have no gold standard.
Some authors have suggested that quantitative TA culture might have a diagnostic value equal to that of invasive techniques such as BAL and PSB.(14-20)
The objective of this study is to evaluate the similarities between TA and BAL culture results in the diagnosis of VAP. In addition, we assess the diagnostic value of the Gram stain method of direct sample analysis examination.
M
ETHODSIn a prospective, open, uncontrolled study, patients admitted to the respiratory intensive care unit (RICU) between October 2001 and August 2002 were studied. All had been under mechanical ventilation for more than 48 hours and were suspected of having contracted VAP. To be considered with clinical suspicion of VAP was defined as new pulmonary infiltrate (or radiologically confirmed worsening of pre-existing infiltrate), together with at least 2 of the following criteria: leukocytosis (>12.000/mm3
), leukopenia (< 4000/mm3
), fever (380
C), hypothermia (350
blood samples were collected for culture. The following patients were excluded from the study: AIDS patients, transplanted patients and those for whom bronchoscopy was not recommended (acute myocardial infarction within the last 24 hours, unstable arrhythmia, mean blood pressure <65 mmHg, platelets < 60.000/mm3
, episodes of bradycardia within the last 24 hours).(21)
The study design was evaluated and approved by the Committee on Ethics and Research from the Messejana Hospital and adhered to the National Health Council Resolution 196/96.
The RICU is in a tertiary care academic hospital and has 6 beds. It is designed for patients who present with acute or chronic respiratory insufficiency or pulmonary heart disease, most of whom require mechanical ventilation. In general, most patients are critical and have been transferred from other ICUs.
All patients suspected of having VAP were observed daily and data were compiled on a protocol form that included: age, gender, date of and reason for RICU admission, date of inclusion in the study, date of intubation, underlying disease, comorbidities and APACHE II score. On the same form, daily leukocyte and platelet counts, temperature, appearance of tracheal secretion and days on antibiotic therapy were recorded, along with antibiotic intake before and after sample collection and a short description of radiological findings and macroscopic aspects of bronchoscopic findings. Patients were monitored from inclusion in the study until the end of the natural course of the disease (either improvement in clinical, radiological, and laboratory test results or death). We defined resolution of the disease as clinical improvement accompanied by normal temperature, decreased volume and increased transparency of tracheobronchial secretion, radiologically confirmed elimination of infiltrate and normal leukocyte count. A patient who, after resolution of the pneumonia, showed new clinical evidence of VAP could be included in the study again.
At the time of clinical suspicion, the antibiotic regimen was prescribed by the attending physician according to RICU protocol, which follows the guidelines established by the American Thoracic Society(22)
and by the Sociedade Brasileira de Pneumologia e Tisiologia (Brazilian Society of Pulmonology and Phthisiology).(23)
The attending physician was responsible for making changes in the antibiotic regimen based on clinical criteria and BAL culture results.
Prior to TA and BAL procedures, patients were sedated with midazolam or fentanyl. No topical anesthetics were used. The fraction of inspired oxygen (FiO2) was increased to 100% and blood pressure, heart rate, and oxygen saturation (as measured by pulse oximetry) were monitored during the procedure. A tracheal aspiration tube (#12, silicon/PVC, Embramed, São Paulo) was used to obtain the TA culture sample. The tube was inserted approximately 24 cm into the trachea and the sample fluid was aspirated into a polypropylene tube (sample tube, Intermedical-Setmed Tecnologia Hospitalar, São Paulo). If there was no fluid production during the procedure, 5 mL of saline solution was injected and rapidly aspirated. A special adapter designed to accept an endotracheal tube or a tracheostomy tube was used in order to avoid interrupting the mechanical ventilation.
After the TA procedure, the bronchoscope was introduced (BF30; Olympus®
) for the BAL procedure. The device was introduced without aspiration through the trachea up to the site suggested by the alterations seen in the chest radiograph. The affected segment was selected and the bronchoscope was placed in front of it. After that, 5 units of 0.9% saline solution were instilled and aspirated. The first one was discarded. The average volume of the aspirated fluid to be analyzed was 45 ± 10 ml. The samples were immediately taken to the laboratory, with a maximum interval of 20 minutes between collection of samples and delivery to the laboratory. Results of the cytological evaluation and Gram analysis were obtained within the first 24 hours, and quantitative culture results were obtained within the following 48 to 72 hours.
Diagnosis of VAP was confirmed through clinical signs, accompanied by the quantitative analysis of the BAL culture (with a cutoff of 104
cfu/mL), and through the evolution of the radiological findings. The cytological and bacteriological analyses of TA and BAL fluid were performed according to the recommendations proposed by Baselski.(24)
the following scales: a) PMNL count: > 25/field; 10-25/field; 1-10/field; < 1/field; b) bacterial count (oil-immersion lens): > 10/field; 1-10/ field; < 1/ field; c) infected cells: > 2% or < 2% of PMNL count.
Samples were centrifuged at 3000 rpm for 15 minutes, and the supernatant was discarded. The precipitate was resuspended and diluted to a final concentration of 1:10 in sterile saline solution, after being liquefied and manually stirred. A sample was taken with the help of a 0.01-mL calibrated loop and spread over 3 plates pre-coated with chocolate agar, blood agar, and MacConkey agar, respectively. Plates were incubated at 37°C for 24 hours. In order to achieve a cutoff point of 104 cfu/mL, it was necessary that the number of colonies per plate be equal to or greater than 10. Results are expressed as cfu/mL. The cutoff point for the TA was 105
cfu/mL, and 104
cfu/mL for the BAL samples. All isolated microorganisms were identified and submitted to sensitivity tests according to methods approved by the NCCLS (National Committee for Clinical Laboratory Standards).(25)
Chest radiographs taken at admission, at inclusion in the study and after resolution of VAP were filed and later evaluated by 2 pulmonologists who had no previous knowledge of the clinical data, but not in an independent way. Radiological evaluation was only performed in patients with clinical suspicion of VAP. The sole objective of this evaluation was to confirm the diagnosis of VAP, taking into consideration the radiographs taken at admission to the ICU, at the time of clinical suspicion and over the following days in order to verify whether or not the infiltrate remained. From these evaluations, we designated infiltrate that disappeared within 24 to 48 hours as inconsistent with a diagnosis of VAP.
We used Cohen’s kappa coefficient to measure agreement between Gram results and quantitative cultures from TA and BAL. The following scale was applied: very good agreement: > 0.81; good agreement: 0.61 to 0.80; moderate agreement: 0.41 to 0.60; poor agreement: < 0.20.
We used standard formulas to calculate sensitivity, specificity, positive predictive value (PPV) and negative predictive value (NPV). We tried to identify differences between patients with confirmed VAP and patients with unconfirmed VAP. To do so, we used the chi-square test or Fisher’s exact test for categorical variables, and the Student’s t-test, or, when appropriate, the Mann-Whitney test for continuous variables. Values of p < 0.05 were considered statistically significant for rejection of the null hypothesis.
R
ESULTSOf 119 patients on mechanical ventilation during the period between October 2001 and August 2002, 32 (26.8%) were suspected of having VAP, a suspicion that was diagnostically confirmed in 25 (78%). Of the 7 unconfirmed cases, 3 presented with radiologically confirmed infiltrate incompatible with a diagnosis of VAP, and 4 presented negative BAL cultures. General characteristics of the patients in the VAP-positive (VAP-P) and VAP-negative (VAP-N) groups are shown in Table 1.
There were no statistically significant differences between the 2 groups regarding gender, age, leukocytes or comorbidities. All in the VAP-N group were taking antibiotics before being included in the study. Only 1 patient in the VAP-P group had not taken any antibiotics within the preceding 24 hours. Antibiotic therapy regimens were altered in 72% of patients in the VAP-P group after initial clinical evaluation and culture results. The mortality rate in the VAP-P group was 48% (12/25), and, of the 13 survivors, 10 (78%) patients presented with microbes sensitive to the antibiotics chosen. Of the 12 patients who died, 6 (50%) had presented with microbes which were totally or partially resistant to the initial regimen (p = 0.21). In the VAP-P group, 20 (80%) of the 25 patients had been taking antibiotics for at least 1 week and had been submitted to mechanical ventilation for longer periods (15 days) prior to the study than had those in VAP-N group (7 days) (p = 0.005).
We classified the cases of pneumonia as either early-onset (if they developed within less than 5 days on mechanical ventilation) or late-onset (after more than 5 days),(26)
Results of Gram stain analysis of TA and BAL fluid
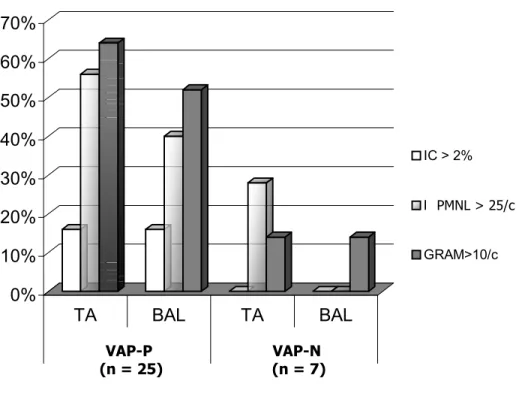
In the qualitative analysis of the samples, none presented epithelial cell numbers higher than 10/field and 1/field (TA and BAL samples, respectively). Cytological analysis of samples showed that VAP-P patients presented higher values in those Gram stain parameters that are suggestive of infection. In addition, of the 25 VAP-P patients, 16% presented with infected cell percentages • 2% in TA and • 12% in BAL, whereas no infected cells were identified in the VAP-N group. Furthermore, among the VAP-P patients, leukocyte counts were higher than 25/field in 56% of the TA samples and 40% of the BAL samples, in contrast to 28% and 0%, respectively; among patients in the VAP-N group. Moreover, 64% presented with bacterial counts were •10/field in 64% of the TA samples and in 52% of the BAL samples from patients in the VAP-P group, in comparison with 14% and 14%, respectively, in VAP-N patients (Figure 1). When we used at least 2 of the positive parameters for infection established by Salata et al.,(27)
the sensitivity and specificity of TA culture in the diagnosis of VAP-P were 48% and 85%, respectively, with a PPV of 92% and an NPV of 31%. Considering the 3 positive parameters, sensitivity was 48%, and specificity was 100%, The PPV was 100%, and the NPV was 35% (Table 2).
Bacteriology
We established a qualitative agreement scale between the bacillus detected by Gram stain and the results of the quantitative culture of TA and BAL samples. We defined it as total agreement, partial agreement or no agreement between the two methods. Total agreement was defined as: a) positive and negative strains identified in the Gram testing and culturing also producing Gram-positive and Gram-negative strains; or b) no strains identified in Gram stain or produced in cultures. Partial agreement was defined as when Gram stain showed Gram-positive and Gram-negative strains and the culture produced only one or the other or neither. No agreement was when the Gram stain showed a Gram-positive strain and the culture produced only a Gram-negative strain, or vice versa. Between Gram stain and TA culturing, there was total agreement in 72% of cases, partial agreement in 8% and no agreement in 20%. Therefore, there was moderate agreement between Gram stain results and the quantitative culture results for TA (kappa coefficient = 0.49). Agreement between Gram stain and BAL culturing was also considered moderate, with total agreement in 76%, partial agreement in 4%, and no agreement in 20% (kappa coefficient = 0.45) (Figure 2).
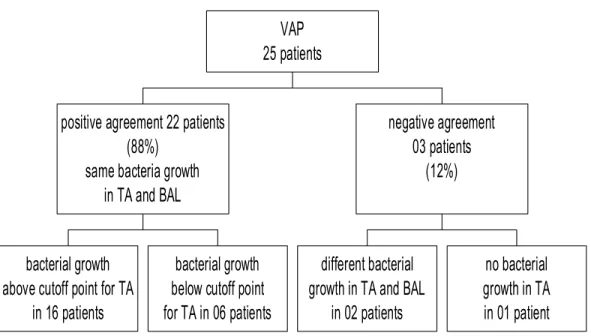
We found sensitivity and specificity of TA Gram stain (for presence of bacteria in TA) in the diagnosis of VAP to be 71% and 28%, respectively, and 80% and 28% for BAL Gram stain. When we made a definitive comparison between TA Gram stain results and quantitative results of BAL cultures, there was total agreement in 72%, partial agreement in 4%, and no agreement in 24% – a moderate agreement (kappa coefficient = 0.56) (Figure 3). When we evaluated the agreement between TA and BAL culture results in the identification of etiologic agents, we found agreement in 22/25 (88%) of cases and disagreement in 3/25 (12%). Agreement was considered satisfactory (78%), with a kappa coefficient of 0.71 (good correlation) (Figure 4). The sensitivity for qualitative TA culture results (presence of bacteria) was 83%, with a specificity of 41%, a PPV of 84% and an NPV of 50%.
The sensitivity and the specificity of quantitative culture results for TA in the diagnosis of VAP were determined through analysis of the cutoff points: 105
cfu/mL and 104
cfu/mL. Using a cutoff point of 105 cfu/mL, sensitivity was 72% and specificity was 71%, and accuracy was considered satisfactory (71%). We observed that, as the cutoff point increased, sensitivity decreased and specificity improved. However, when the cutoff point was raised from 105
cfu/mL to 106
cfu/mL, no differences were found.
Blood culture
Among the blood cultures tested, only one patient tested positive for MRSA, confirming it to be the etiologic agent responsible for the VAP.
D
ISCUSSIONThe grand challenge of dealing with patients with VAP is to establish an early and precise etiological diagnosis. As has been demonstrated, clinical diagnosis has significant limitations.(28)
A study of 147 patients on mechanical ventilation, in which culture samples were obtained from fluid in the lower airways, showed that clinical criteria should not be used to diagnose VAP.(29)
universally accepted. Another study compared clinical diagnoses to results from cultures of lung parenchyma and postmortem histopathological examination and found that sensitivity was 69% and specificity was 75%.(30)
A recent meta-analysis asserts that careful selection of patients, based on a consensus of clinical criteria, is of great value for the performance of diagnostic tests.(31)
New infiltrate in chest radiographs or changes in pre-existing infiltrate have been proposed as obligatory criteria for a diagnosis of VAP. However, other diseases and conditions, such as atelectasis, edema, hemorrhage, adverse drug reaction, and acute respiratory distress syndrome, can mimic pneumonia.(28)
Associating the infiltrate and changes in the appearance of the tracheal fluid in the cytological examination with differential counts cells that are markers for infection may lead to misdiagnosis of diseases such as chronic obstructive pulmonary disease, in which patients present with tracheobronchitis and high levels of polymorphonuclear leukocytes in the tracheal fluid, as VAP.(32)
In the present study, there were 3 suspected VAP patients who presented cultures at the cutoff point for VAP, but whose radiologically confirmed infiltrate disappeared in 24 hours – without any changes in the established procedures. The diagnosis was not confirmed in these patients, showing that it is important to include microbiological criteria with radiographic evolution in order to confirm VAP. Therefore, in our study, chest radiographs were taken and analyzed over the course of the study – at admission to the RICU, when clinical suspicion of VAP arose, and periodically until resolution of the pneumonia (confirmed through clinical, radiographic and laboratory testing) or death.
In the present study, our cohort consisted of patients, transferred from other ICUs, with high APACHE II scores (27.7 ± 7.9), on mechanical ventilation for about 15 days prior to their inclusion in the protocol and on antibiotic therapy for at least 1 week. In patients suspected of having VAP, the use of antibiotics prior to the identification of the etiologic agent is frequently said to be one of the most important factors limiting the accuracy of diagnostic methods, since the number of false-negative results may increase. On the other hand, for patients who are on antibiotic therapy for several days, the accuracy of the culture in the identification of the etiologic agent does not normally decrease, since other microbes may be responsible for the appearance of new infiltrate.(33,34,35,36)
As previously mentioned, the patients in the present study were on antibiotic therapy in the RICU for at least 1 week. A recent meta-analysis showed that the recent administration of antibiotics interferes with the accuracy of diagnostic methods, although not in patients on antibiotic therapy due to other causes at the moment of clinical suspicion(31)
. Another study was performed at the Faculdade de Medicina da Universidade de São Paulo Hospital das Clínicas.(37).
The authors suggested that prior use of antibiotics in patients with clinical suspicion of pneumonia does not interfere with the sensitivity of BAL findings, the analysis of which can be used for changing the antibiotic therapy. Another meta-analysis, comparing the diagnostic value of PSB, BAL, and infected cell counts in patients with clinical suspicion of VAP and previously on antibiotic therapy, revealed a definite decrease in the accuracy of PSB, but no change in the accuracy of BAL.(38)
The authors recommended BAL cultures for patients on prior antibiotic therapy. In the interpretation of these findings, great difficulty is created by the fact that no pattern has been identified and by the lack of a clear definition of what recent or prolonged antibiotic therapy is.(31)
Therefore, these considerations are debatable. We cannot determine with certainty how prior or prolonged use of antibiotics interfered with the analysis of our results. Although PSB is indeed a more reliable method and has higher specificity than BAL, its operational costs are beyond our capabilities. Many researchers prefer BAL to PSB because of certain factors such as its higher sensitivity, the fact that it allows for better selection of the empirical treatment prior to obtaining the culture results; the lower risk for severe patients, its affordability and the fact that it facilitates the diagnosis of other types of infection.(39)
In performing the BAL procedure, we used 100 mL of 0.9% saline solution, although it is frequently recommended that 120 mL or 140 mL be used. Until recently, there was some controversy over whether amounts lower than 140 mL would influence culture results.(40).
data in the literature that would corroborate this finding, which, we believe, is still debatable and merits further investigation.
The characteristics of the patients in our study probably justify the incidence of VAP caused by resistant and highly infective microbes such as Pseudomonas aeruginosa and Acinetobacter baumannii and the consequent high mortality rate. When we compared VAP-P and VAP-N patients, we observed that the former were on mechanical ventilation for a longer time (p = 0.005), which is in agreement with the literature, showing a cumulative risk for developing pneumonia (1% a day) in patients on mechanical ventilation.(39)
It is notable that patients with late-onset VAP presented with highly infectious microbes such as Pseudomonas aeruginosa, Acinetobacter baumannii, Klebsiella pneumoniae and MRSA, also in agreement with the literature.(8)
It is possible that our inability to , identify statistically significant differences in correlations between VAP and certain underlying diseases such as COPD or cardiopathy.
Blood culture and pleural fluid culture may confirm the diagnosis of VAP, determining etiology when they are positive. However, negative culture results do not rule out a diagnosis of VAP.(41) Positive results are obtained in approximately 20% of cases. In the present study, a positive blood culture result was found in only one patient. This was probably due to the fact that more than 64% of the VAP patients had been on a course of antibiotics for at least one week prior to testing.
In severe cases, patients on mechanical ventilation present high percentages of colonizing microbes in the tracheobronchial tree a few hours after intubation.(42)
Therefore, the greatest challenge in the etiologic diagnosis is to differentiate colonization from infection. Techniques for the sample collection should guarantee that the sample passes through the upper airways without being contaminated. To delay empirical antibiotic therapy prior to the collection of pulmonary fluid by BAL may result in worse prognoses for these patients(12)
. However, the empirical, inadequate use of antibiotics increases morbidity and mortality rates.(15)
We need to establish a diagnostic strategy that is feasible, with reasonable costs and fast results. Despite its diagnostic limitations, TA culture meets these criteria and is the method of choice in most of the ICUs throughout our state.
Recent studies have demonstrated that noninvasive methods such as TA and its quantitative culture have shown reasonable results with good diagnostic accuracy.(14,15,16,17,18,19,20)
Cytological evaluation with differential cell counts and quantitative culture of TA are considered flawed due to the contamination caused by the upper airways, which makes it difficult to differentiate between colonization and infection.(27)
Microscopic examination of TA using Gram or Giemsa stain, when properly performed, aids in the evaluation of 3 pre-established parameters that characterize infection: PMNL counts, infected cell percentage determination and bacterial counts by field.(27)
Gram stain is obviously the most common procedure used to identify the morphology of the bacteria and can be used as an indication for the initial empirical treatment. Giemsa stain is also recommended since it presents some advantages in relation to Gram stain, such as better visual identification of the bacterial morphology, specifically in the identification of intracellular bacteria, and also may reveal the presence of some protozoa and fungi.(24)
Neutrophil counts and percentages of infected cells (intracellular bacteria) are higher in patients with pneumonia than in patients without.(24)
Various studies have evaluated the use of Gram stain in BAL fluid. Solé-Violan et al.(43)
found that Gram stain correlated well with BAL and PSB and with their respective cultures. Aubas et al.,(44)
while studying the presence of infected cells in PMNL for the diagnosis of VAP, showed that their presence in BAL was significantly higher in patients with VAP, with 67% sensitivity and 82.7% specificity. In accordance with the literature, our study showed that the VAP-P patients presented higher numbers of PMNLs, infected cells, and bacteria per field in TA and BAL cultures than those in the VAP-N group. When we analyzed at least 2 of these predetermined parameters for infection in TA cultures, we found a low (48%) sensitivity and a high (85%) specificity, with an NPV of 31% and a PPV of 92%. When we analyzed 3 of these parameters, sensitivity decreased, and specificity increased to 100%. Recommended cutoff points for the percentage of infected cells range from 2 to 7%. Chastre et al.(45)
demonstrated that the study of intracellular microorganisms with a cutoff point of 7% is a good indication of infection (sensitivity = 86%, specificity = 96%). Solé-Violan et al.,(43)
using a cutoff point of 4%, found 62.5% sensitivity and 100% specificity. Allaouchiche et al.,(46)
showed sensitivity of 86.3% and specificity of 78.9% with a cutoff point of 2%. Pugin et al.(47)
with pneumonia, but not in any of the 25 patients without pneumonia. In our study, using a cutoff point of 2%, intracellular microorganisms were detected in PMNL in 5 of the 25 patients from the VAP-P group, and in none from the VAP-N group, indicating low sensitivity (20%), probably because of the antibiotic therapy prior to the inclusion in the study.(48).
Nevertheless, this test showed excellent (100%) specificity for the diagnosis of VAP.
In accordance with the study presented by Solé-Violan et al., we observed a moderate correlation between the agent detected by Gram stain and the culture strain, both in TA and BAL cultures (kappa coefficient = 0.49 and 045, respectively). When we compared the Gram stain of the TA culture to the final result of the BAL culture, we observed a moderate correlation (kappa coefficient = 0.56). The sensitivity of the Gram stain in TA and BAL cultures for the definite diagnosis of VAP was 72% and 80%, respectively, with a specificity of 28% for both. There is a moderate correlation between the TA and BAL culture Gram stain results. Therefore, we conclude that, if the Gram stain procedure is carefully performed and the quality of the sample is guaranteed, it may help define the initial empirical antibiotic therapy until the results of the quantitative cultures are available.(39)
The qualitative culture of TA is a procedure with a high percentage of false-positive results due to airway colonization. In contrast, the quantitative culture, using a cutoff point of 105
cfu/mL, increases the diagnostic accuracy considerably. Jourdain et al.(19)
studied 57 episodes in which 39 patients on mechanical ventilation were suspected of having pulmonary infection. They used PSB and BAL and compared their results to the quantitative TA culture at different cutoff points, from 103
to 107
cfu/mL. The 106
-cfu/mL cutoff point seemed to have the best accuracy, with 68% sensitivity and 84% specificity. However, when this cutoff point was applied to the patients under study, approximately one-third of the pneumonia patients went undiagnosed. Cutoff points of 105
cfu/mL for TA cultures and 104
cfu/mL for BAL cultures have good specificity without affecting the sensitivity.(49,50)
Cook et al.,(20) after reviewing the most important studies on the use of TA culture for the diagnosis of VAP, concluded that differences among the cohorts under study and the methodology employed, even if all technical procedures are carefully followed, account for the wide discrepancies in the TA culture results. For example, in 4 of the studies reviewed, sensitivity of TA cultures ranged from 38% to 100%, and the specificity ranged from 14% to 100%.(12,16,18,19)
El-Ebiary et al.(15)
, in a prospective study using a cutoff point of 105
cfu/mL, found a sensitivity of 70% and a specificity of 72%. Sauaia et al.(17)
showed a sensitivity of 38% and a specificity of 100% using a cutoff point of 105
cfu/mL. Marquette et al.(16) , using the same cutoff point, showed a sensitivity of 55% and a specificity of 85%.
In our study, we used, a priori, cutoff points of 105
cfu/mL for TA cultures and 104
cfu/mL for BAL cultures. With the TA cutoff point of 105
cfu/mL, the sensitivity was 72% and the specificity was 71%. Accuracy was a satisfactory 72%. We observed that the cutoff point of 106
cfu/mL did not alter the accuracy of the quantitative TA culture. When we used the cutoff point of 104
cfu/mL, sensitivity improved, but there was a decrease in specificity. When we evaluated the agreement between the TA culture and the BAL culture in etiologic agent detected, we found good agreement (kappa coefficient = 0.71).
It is important to consider some important aspects in the investigation of the etiologic agent in VAP. Results must be interpreted together with clinical and radiological data. In addition, only high quality samples of respiratory fluid should be evaluated. Furthermore, extreme quality control should be exercised during all phases of culture processing and investigation. Technical excellence during all stages of material processing is fundamental for reliable final results that will be useful in determining the course of patient treatment.
The culturing of TA can aid in the choice of the empirical antibiotic therapy. First, through direct examination of the sample at the time of clinical suspicion of VAP. Later, when the antibiotic therapy may need to be altered, TA culture results can be considered together with the quantitative culture results with a cutoff point of at least 105
cfu/mL.
R
EFERENCES1. Chastre J, Fagon JY. Ventilator-associated pneumonia. Am J Respir Crit Care Med 2002;165:867-903.
2. Fagon JY, Chastre J, Domart Y, Trouillet JL, Pierre J, Darne C, et al. Nosocomial pneumonia in patients receiving continuous mechanical ventilation. Prospective analysis of 52 episodes with use of a protected specimen brush and quantitative culture techniques. Am Rev Respir Dis 1989;139:877-84.
3. Rello J , Ausina V, Ricart M, Castella J, Prats G. Impact of previous antimicrobial therapy on the etiology and outcome of ventilator-associated pneumonia. Chest 1993;104:1230-5.
4. Torres A, Aznar R, Gatell JM, Jimenez P, Gonzalez J, Ferrer A, et al. Incidence, risk and prognosis factors of nosocomial pneumonia in mechanically ventilated patients. Am Rev Respir Dis 1990;142:523-8.
5. Rello J, Jubert P, Vallés J. Evaluation of outcome for intubated patients with pneumonia due to Pseudomonas aeruginosa. Clin Infect Dis 1996;23:973-8.
6. Rello J, Rué M, Jubert P. Survival in patients with nosocomial pneumonia: Impact of the severity of illness and the etiologic agent. Crit Care Med 1997;25:1862-7.
7. Rello J, Torres A, Ricart M, Valles J, Gonzalez J, Artigas A, et al. Ventilador-associated pneumonia by Staphylococcus aureus: Comparison of methicilin-resistant and methicilin-sensitive episodes. Am J Respir Crit Care Med 1994;150:1545-9.
8. Sanchez-Nieto JM, Torres A, Garcia-Cordoba F, El- Ebiary M, Carrillo A, Ruiz J, et al. Impact of invasive and noninvasive quantitative culture sampling on outcome of ventilator-associated pneumonia: a pilot study. Am J Respir Crit Care Med 1998;157:371-6.
9. Ruiz M, Torres A, Ewig S, Marcos MA, Alcon A, Lledo R, et al. Noninvasive versus invasive microbial investigation in ventilator-associated pneumonia: evaluation of outcome. Am J Respir Crit Care Med 2000;162:119-25. 10. Solé-Violan J, Fernandez JA, Benitez AB, Cardenosa Cendrero JA, Rodriguez de Castro F. Impact of quantitative
invasive diagnostic techniques in the management and outcome of mechanically ventilated patients with suspected pneumonia. Crit Care Med 2000;28:2737-41.
11. Fagon JY, Chastre J, Woff M, Gervais C, Parer-Aubas S, Stephan F, et al. Invasive and noninvasive strategies for management of suspected ventilator –associated pneumonia: a randomized trial. Ann Intern Med 2000;132:621-30.
12. Luna CM, Vujacich P, Niederman M. Impact of BAL data on the therapy and outcome of ventilator-associated pneumonia. Chest 1997;111:676-85.
13. Rello J, Gallego M, Mariscal D, Sonora R, Valles J. The value of routine microbial investigation in ventilator-associated pneumonia. Am J Respir Crit Med 1997;156;196-200.
14. Marquette CH, Copin MC, Wallet F, Neviere R, Saulnier F, Mathieu D, et al. Diagnostic tests for pneumonia in ventilated patients: prospective evaluation of diagnostic accuracy using histology as a diagnostic gold standard. Am J Respir Crit Care Med 1995;151:1878-88.
15. El-Ebiary M, Torres A, Gonzalez J, de la Bellacasa JP, Garcia C, Jimenez de Anta MT et al. Quantitative cultures of endotracheal aspirates for the diagnosis of ventilador-associated pneumonia. Am Rev Respir Dis 1993; 148: 1552-7.
16. Marquette CH, Georges H, Wallet F, Ramon P, Saulnier F, Neviere R, et al. Diagnostic efficiency of endotraqueal aspirates with quantitative bacterial cultures in intubated patients with suspected pneumonia. Comparison with the protected specimen brush. Am Rev Respir Dis 1993;148:138-44.
17. Sauaia A, Moore FA, Moore EE, Haenel JB, Kaneer L, Read RA. Diagnosing pneumonia in mechanically ventilated trauma patients: endotraqueal aspirate versus bronchoalveolar lavage. J Trauma 1993;35:512-7.
18. Torres A, Martos A, Puig de la Bellacasa J, Ferrer M, el-Ebiary M, Gonzalez J, et al. Specificity of endotracheal aspiration, protected specimen brush and brochoalveolar lavage in mechanically ventilated patients. Am Rev Respir Dis 1993;147:952-7.
19. Jourdain B, Novara A, Joly-Guilon ML, Dombret MC, Calvat S, Trouillet JL, et al. Role of quantitative cultures of endotracheal aspirates in the diagnosis of nosocomial pneumonia. Am J Respir Crit Care Med 1995;152:241-6. 20. Cook D, Mandell L. Endotracheal aspiration in the diagnosis of ventilator-associated pneumonia. Chest
2000;117:1958-78.
21. Cid M, Maristela M, Arthur V, Jamocyr M. Complicações da ventilação mecânica. J Pneumol 2000;26;45-54. 22. American Thoracic Society. Hospital-acquired pneumonia in adults: diagnosis, assessment of severity, initial
antimicrobial therapy, and preventive strategies. Am J Respir Crit Care Med 1995;157:1711-25.
23. Sociedade Brasileira de Pneumologia e Tisiologia. Consenso Brasileiro de Pneumonias em Indivíduos Adultos Imunocompetentes. J Pneumol 2001;27:22-38.
24. Baselski V. Microbiologic diagnosis of ventilator-associated pneumonia. Infect Dis Clin North Am 1993;7:331-57. 25. National Committee for Clinical Laboratory Standardization-NCCLS. MIC testing supplemental tables M100-S10
(M7) 2002. Weyne, PA; 2002.
27. Salata AR, Lederman MN, Shlaes MD, Jacobs MR, Eckstein E, Tweardy D, et al. Diagnosis of nosocomial pneumonia in intubated, intensive care unit patients. Am Rev Respir Dis 1987;135:426-32.
28. Meduri GU, Mauldin GL, Wunderink RG, Leeper KV Jr, Jones CB, Tolley E, et al. Causes of fever and pulmonary densities in patients with clinical manifestations of ventilator-associated pneumonia.Chest 1994;106:221-35. 29. Fagon JY, Chastre J, Hance AJ, Guiguet M, Trouillet JL, Domart Y, et al. Detection of nosocomial lung infection
in ventilated patients: Use of a protected specimen brush and quantitative culture techiniques in 147 patients. Am Rev Respir Dis 1988;138:110-6.
30. Fabregas N, Ewing S, Torres A, et al. Clinical diagnosis of ventilator associated pneumonia revisited: Comparative validation using immediate post-mortem lung biopsies. Thorax 1999;54:867-73.
31. Michaud S, Suzuki S, Herbarth S. Effect of design-related bias in studies of diagnostic tests for ventilator-associated pneumonia. Am J Resp Crit Care Med 2002;166:1320-5.
32. Monso E, Ruiz A, Rosell J, Manterola J, Fiz J, Morera J, et al. Bacterial infection in chronic obstructive pulmonary disease: a study of stable and exacerbated outpatients using the protected specimen brush. Am J Respir Crit Care Med 1995;152:1316-20.
33. Montravers P, Fagon JY, Chastre J, Lecso M, Dombret MC, et al. Follow-up protected specimen brushes to assess treatment in nosocomial pneumonia. Am Rev Respir Dis 1993;147:38-44.
34. Johanson WG Jr, Seidenfeld JJ, Gomez P, de los Santos R, Coalson JJ. Bacteriologic diagnosis of nosocomial pneumonia following prolong mechanical ventilation. Am Rev Respir Dis 1988;264:137-259.
35. Chastre J, Fagon JY, Bornet-Lecso M, Calvat S, Dombret MC, al Khani R, et al. Evaluation of bronchoscopic techniques for the diagnosis of nosoconial pneumonia. Am J Respir Crit Care Med 1995;152:231-40.
36. Corley DE, Kirtland SH, Winterbauer RH, et al. Reproducibility of the histologic diagnosis of pneumonia among a panel of four pathologists. Chest 1997;112:458-70.
37. Gomes JCP, Pedreira WL, Araújo EAMP, Soriano FG, Negri EM, Antonângelo L, et al. Impact of BAL in the management of pneumonia with treatment failure. Chest 2000;118:1739-46.
38. de Jaeger A, Litalien C, Lacroix J, Guertin MC, Infante-Rivard C. Protected specimen brush or bronchoalveolar lavage to diagnose bacterial nosocomial pneumonia in ventilated adults: a meta-analysis. Crit Care Med 1999;27:2548-60.
39. Chastre J and Fagon JY. Ventilator-associated pneumonia. Am J Respir Crit Care Med 2002;165:867-903. 40. Gallego M, Rello J. Diagnostic testing for ventilator-associated pneumoniae. Clin Chest Med 1999;20:671-9. 41. Rello J, Mirelis B, Alonso C, Prats G. Lack of usefulness of blood cultures to diagnose ventilator-associated
pneumonia. Eur Respir J 1991;4:1020.
42. Correa H, Marini F, Franca G. Infección pulmonar em el paciente com asistencia respiratória. Arch Med Int 1982;4:191-205.
43. Solé-Violán J, Decastro FR, Rey A, Martingonzalez JC, Cabreranavarro P. Usefulness of examination of intracellular organisms in lavage fluid in ventilator-associated pneumonia. Chest 1994;106:889-94.
44. Aubas S, Capdevila X, Darbas H, Roustan JP, Du Cailar J. Bronchoalveolar lavage for diagnosis bacterial pneumonia in mechanically ventilated patients. Am J Respir Crit Care Med 1994;149:860-6.
45. Chastre J, Fagon JY, Soler P, et al. Quantification of BAL cells containing intracellular bacteria rapidly identifies ventilated patients with nosocomial pneumonia. Chest 1989;95:190-2.
46. Allaouchiche B, Jaumain H, Chassard D, Boulétreau P. Gram stain of bronchoalveolar fluid in the early diagnosis of ventilator-associated pneumonia. Br J Anaesth 1999;83:845-9.
47. Pugin J, Auckenthaler R, Mili N, Janssens JP, Lew PD, Suter PM. Diagnosis of ventilator-associated pneumonia by bacteriologic analysis of bronchoalveolar lavage fluid. Am Rev Respir Dis 1991;143:1121-9.
48. Vallés J, Rello J, Fernández R, et al: Role of bronchoalveolar lavage in mechanically ventilated patients with suspected pneumonia. Eur J Clin Microbiol Infect Dis 1994;13:549-58.
49. Guerra LF, Baughman RP. Use of bronchoalveolar lavage to diagnose bacterial pneumonia in mechanically ventilated patients. Crit Care Med 1990;18:169-73.
TABLE 1
General characteristics of patients admitted to the RICU of the Hospital de Messejana between October 2001 and August 2002 and under clinical suspicion of having VAP
Results expressed as mean ± SD
VAP-P: ventilator associated pneumonia positive; RICU: respiratory intensive care unit; VAP-N: ventilator associated pneumonia negative; MV: mechanical ventilation
VAP-P VAP-N p
Number of patients 25 07
Age 61 ± 14 59 ± 15 0.74
Gender: Male (Female) 16 (9) 4 (3) 0.73
Leukocytes/mm3
at admission
19.664 ± 7.675 15.479 ± 5.274 0.11
Platelets/mm3
at admission 237.872 ± 176.716 214.386 ± 147.824 0.72
Previous antibiotic therapy 24/25 7/7 1.00
COPD 10/25 2/7 0.68
Asthma 4/25 3/7 0.15
Cardiopathy 5/25 0/7 0.56
Diabetes mellitus 3/25 2/7 0.28
Neurologic 2/25 1/7 0.53
Days on MV before inclusion
17 ± 13.82 7 ± 5.14 0.005
Total number of days on MV
28 ± 17.39 19 ± 14.22 0.20
RICU deaths 12/25 4/7 1.00
Figure 1 – Distribution of patients with and without VAP according to the quantification of IC, PMN e number of bacteria in GRAM of TA and BAL. P: ventilator associated pneumonia positive; VAP-N: ventilator associated pneumonia negative; GRAM: bacteriological examination using Gram stain method; TA: tracheal aspirate; BAL: bronchoalveolar lavage; IC: infected cells; PMNL:
polymorphonuclear leukocytes; number of bacteria in GRAM
0%
10%
20%
30%
40%
50%
60%
70%
TA
BAL
TA
BAL
VAP
NVAP
IC > 2%
PMN>25/c
GRAM>10/c
VAP-P (n = 25)
VAP-N (n = 7)
TABLE 2
Sensitivity, specificity, and positive and negative predictive values for Gram stain in tracheal aspirate samples, as pertaining to numbers of infected cells, polymorphonuclear cells and bacteria/field
GRAM: bacteriological examination using Gram stain method; PPV: positive predictive value; NPV: negative predictive value; TA: tracheal aspirate.
Number of positive parameters in GRAM for TA
Sensitivity Specificity PPV NPV
2 48% 85% 92% 31%
G- growth in Gram and
culture in 17 patients
No bacteria growth in 01 patient Total agreement btw Gram and culture
in 18 patients (72%)
Gram + and in Gram Gram - in culture
or vice-versa Parcial agreement btw Gram and culture
in 02 patients (8%)
Gram + or - in Gram Gram -or + in culture
respectively 02 patients
No bacteria in Gram Gram - in culture
in 03 patients No agreement
in 05 patients (20%) TA
Gram - in Gram and culture 19 patients Total agreement between Gram and culture
in 19 patients (76%)
Gram - in Gram and Gram + and
-in culture Partial agreement
in 01 patient
Gram + in Gram Gram - in culture
01 patient
No bacteria in Gram Gram + in culture
04 patients No agreement
in 05 patients (20%) BAL
25 patients
Kappa – 0.49 –moderate correlation Kappa – 0.45 –moderate correlation
Figure 2 – Agreement of GRAM with TA and BAL cultures in VAP patients
G- in GRAM of TA and culture of BAL Total agreement
18 patients (72%)
G- in GRAM of TA G+ and G- in culture of BAL
Partial agreement 1 patient
(4%)
G+ in GRAM of TA G- in culture of BAL
in 1 patient
No bacterial gr in GRAM of bacterial growth in cu in 4 patient No agreement
6 patients (24%) 25 VAPpatients
Agreement between GRAM of TA and culture of BAL
Kappa = 0.56 – moderate correlation
bacterial growth
above cutoff point for TA
in 16 patients
bacterial growth
below cutoff point
for TA in 06 patients
positive agreement 22 patients
(88%)
same bacteria growth
in TA and BAL
different bacterial
growth in TA and BAL
in 02 patients
no bacterial
growth in TA
in 01 patient
negative agreement
03 patients
(12%)
VAP
25 patients
Kappa = 0.71 – good correlation