INTRODUCTION
The sintering (iring) temperature is one of the most
important processing variables in the manufacture of ceramic pieces. In fact, it deines the properties and in some cases, the inal product costs. Accurate measurement, prediction and
Quantitative iring transformations of a triaxial
ceramic by X-ray diffraction methods
(Transformações quantitativas de queima de uma cer
âmica
triaxial por métodos de difração de raios X)
M. S. Conconi1, M. R. Gauna1, M. F. Serra1, G. Suarez1,2, E. F. Aglietti1,2, N. M. Rendtorff1,2,*
1CETMIC, Centro de Tecnología de Recursos Minerales y Cerámica, Camino Centenario y 506, M. B. Gonnet,
Buenos Aires, Argentina
2Departamento de Química, Facultad de Ciencias Exactas, Universidad Nacional de La Plata, 1 y 115 La Plata, CP 1900, Buenos Aires, Argentina
Abstract
The iring transformations of traditional (clay based) ceramics are of technological and archeological interest, and are usually reported qualitatively or semiquantitatively. These kinds of systems present an important complexity, especially for X-ray diffraction techniques, due to the presence of fully crystalline, low crystalline and amorphous phases. In this article we present the results of a qualitative and quantitative X-ray diffraction Rietveld analysis of the fully crystalline (kaolinite, quartz, cristobalite, feldspars and/or mullite), the low crystalline (metakaolinite and/or spinel type pre-mullite) and glassy phases evolution of a triaxial (clay-quartz-feldspar) ceramic ired in a wide temperature range between 900 and 1300 ºC. The employed methodology to determine low crystalline and glassy phase abundances is based in a combination of the internal standard method and the use of a nanocrystalline model where the long-range order is lost, respectively. A preliminary sintering characterization was carried out by contraction, density and porosity evolution with the iring temperature. Simultaneous thermo-gravimetric and differential thermal analysis was carried out to elucidate the actual temperature at which the chemical changes occur. Finally, the quantitative analysis based on the Rietveld reinement of the X-ray diffraction patterns was performed. The kaolinite decomposition into metakaolinite was determined quantitatively; the intermediate (980 ºC) spinel type alumino-silicate formation was also quantiied; the incongruent fusion of the potash feldspar was observed and quantiied together with the inal mullitization and the amorphous (glassy) phase formation.The methodology used to analyze the X-ray diffraction patterns proved to be suitable to evaluate quantitatively the thermal transformations that occur in a complex system like the triaxial ceramics. The evaluated phases can be easily correlated with the processing variables and materials properties. These correlations can be employed for materials characterization, design and processing control.
Keywords: triaxial ceramics, XRD-Rietveld, processing, characterization.
Resumo
As transformações de queima de cerâmicas tradicionais (à base de argila) são de interesse tecnológico e arqueológico, e são geralmente
reportadas qualitativa ou semi-qualitativamente. Estes tipos de sistemas apresentam uma importante complexidade, especialmente
para técnicas de difração de raios X, devido à presença de fases totalmente cristalinas, de baixa cristalinidade e amorfas. Neste artigo apresentamos os resultados de análise de Rietveld qualitativa e quantitativa de difração de raios X de amostras totalmente cristalinas (caulinita, quartzo, cristobalita, feldspato e/ou mulita), de baixa cristalinidade (metacaulinita e/ou pré-mulita tipo espinélio) e evolução de fases vítreas de cerâmica triaxial (argila-quartzo-feldspato) após queima em ampla faixa de temperaturas entre 900 e 1300 ºC. A
metodologia empregada para determinar as abundâncias de fases de baixa cristalinidade e amorfas é baseada em uma combinação de método de padrões interno se o uso de modelo nanocristalino no qual a ordem de longo alcance é perdida, respectivamente. Uma caracterização preliminar de sinterização foi feita por evolução de retração, densidade e porosidade em função da temperatura de queima. Análise simultânea termogravimétrica e térmica diferencial (TG-ATD) foi feita para avaliar as temperaturas reais em que ocorrem as transformações químicas. Finalmente, foi feita uma análise quantitativa baseada no método de reinamento de Rietveld dos difratogramas de raios X. A decomposição de caulinita em metacaulinita foi determinada quantitativamente; a formação intermediária (980 ºC) de
alumino-silicato tipo espinélio foi também quantiicada; a fusão incongruente de feldspato potássico foi observada e quantiicada juntamente com a mulitização inal e formação de fase amorfa (vítrea). A metodologia usada para analisar os difratogramas de raios X provaram ser adequadas para avaliar quantitativamente as transformações térmicas que ocorrem em um sistema complexo como as cerâmicas triaxiais. As fases determinadas podem ser facilmente correlacionadas com as variáveis de processo e as propriedades dos materiais. Essas correlações podem ser empregadas para caracterização, projeto e controle de processamento de materiais.
predetermination of material properties are important for its posterior use, and undoubtedly the properties depend on both the phase (of different crystalline grade) composition, and microstructure of the inal ceramic material.
Clay based ceramics are one of the most complex ceramic systems because of the non-simple relationship between the behavior of minerals during the ceramic processing and the transformations during heating. A major challenge is to predict the phase transformations in silicate ceramics and to establish the correlations between the structural characteristics of the ired products and the physical properties [1-7]. During ceramic process, once the crystalline structures of minerals exceed their stability limits, they are partially decomposed while simultaneously others are being formed. The destruction of the pre-existing structure does not occur instantly. Moreover, these transformations determine the inal properties of the ceramic products [1-7]. These processes include decomposition, with gas emission, crystalline transformations, fusion and recrystallizations. Some of the products of these process are amorphous and some other present different grade of crystallinity (order). The actual temperature and conversion ratio of these reactions and processes depend on the clay type and luxing components, together with the heating rate and atmosphere [8-17].
The raw material composition and the mineralogical transformations caused by iring are usually studied by XRD methods. Traditionally, conventional X-ray quantitative analysis methods, based on the calculation of the relative intensity of a selected diffraction line of a crystalline phase, have been used for phase quantiication in raw materials and ceramic products, but these studies are generallyperformed only in a semi-quantitative way.On the other hand, the Rietveld method [18, 19] has proved to be an effective tool for quantitative phase analysis (QPA) in diverse materials [20, 21] from XRD analysis.
In this work a quantitative analysis of the thermal evolution of crystalline and none (low) crystalline phases is carried out by means of the Rietveld method. The method developed by H. Rietveld (1969) to reine crystalline structures using neutron diffraction data, extended its use to structural analysis, cell parameters measurement, phase transformations, quantitative analysis of mineral mixtures; and to determination of amorphous content by X-ray diffraction, among other uses [18-21]. Overcoming the complexity of these natural samples, this kind of analysis can also be applied to clay based materials with promising results. This method its point-to-point the difference between experimental intensities of the whole X-ray pattern and the calculated intensities, based on a certain model of crystalline structure, optic effects of diffraction, instrumental factors and other characteristics of the sample. The parameters included in the model are reined until the best least square it of the thousands proile points is obtained. In QPA using the Rietveld method, phase fractions are normalized to 100% of crystalline phases and the amorphous/non-diffracting/low-crystalline content is usually not accounted
for. However, as this kind of phases present in ceramic materials affects its inal performance, its quantiication is quite necessary. Particularly, the quantitative analysis of the amorphous/crystalline ratio is one of the most investigated and frustrating challenge in the diffraction research.
It is important to point out that, the metakaolin (MK) resulting from the thermal dehydroxylation of the kaolinite is not amorphous, but presents a very low crystalline grade as proven by many techniques where the tetrahedral and octahedral coordination are still observed for silicon and aluminum atoms [22-25]. And this, transforms (at ~ 980 ºC) into a spinel type alumino-silicate (SAS) that also presents low crystallinity [26-29]. Mullite, the end of the thermal sequence, is easy to detect by XRD, even at low concentrations [30].
In the Rietveld analysis, the crystalline structure of each phase in the sample should be known. Hence this method does not allow including the amorphous or non-crystalline phases. However, several authors had put into practice the quantiication of these phases using the Rietveld reinement in an eficient way [31-38]. In this paper we combine different pattern treatments in order to correctly quantifythe different phases with different crystalline grades.
Quantiication methods
Internal standard method (IS)
This methodology is the most common approach to the QPA of amorphous phase by XRD and is included in many Rietveld analysis packages [38]. De la Torre applied the method for samples with the aggregate of a fully crystalline internal standard in a known proportion, and determined the experimental conditions which affect the uncertainty of the amorphous phase determination using different internal standards.
When adding an internal standard to a sample, if any non-crystalline phase is present, the internal standard content would be overestimated by the Rietveld analysis. The percentage of amorphous/non diffracting/glassy phase in the sample can be estimated using the following equation [36]
NC% = [(1-WS/RS ) / (100-WS ) ]x104% (A)
where NC% is the non-crystalline content, WS is the internal standard (quartz) wt.%, and RS is the internal standard content evaluated by the Rietveld method. For this reason, to obtain the actual phase content of each present phase, their overestimation should be corrected by the amorphous phase abundance. If a phase present in the un-spiked sample can be correctly quantiied and used as internal standard, the actual phase content of each phase can be calculated applying de factor WS/RS to correct the values obtained by de Rietveld analysis for the presence of an amorphous phase.
higher temperatures, it can be partially dissolved by the glassy phase formed from the fusion of the luxing agents present [1] and transform into cristobalite and/or tridimite [1]. In the typical triaxial mixtures this luxing agent consists in a mixture of different feldspars and other secondary luxes that introduce alkali (K, Na and/or Ca and Mg); generally (K > Na >> Ca and Mg). For this reason, in this study quartz was assumed and employed as invariant internal standardfor materials ired below 1100 ºC.
The metakaolin (MK) formed from the thermal decomposition of the kaolinite (K), at 600-700 ºC, transforms into a spinel type alumino-silicate known as pre-mullite (SAS) at 980 ºC [1]. The transformation can be easily observed by DTA. This SAS presents also a low crystalline structure like MK and transforms mullite at around 1200 ºC. SAS structure was described by neutron diffraction [25]. The mullitization is more dificult to observe by DTA analysis; it is well known that it occurs around this temperature, this mullite is known as primary mullite (MI). The crystallized mullite from an aluminum oversaturated glassy phase is known as secondary mullite (MII). The differences between these two mullite phases can be detected by the analysis of the crystalline cell size [26-30], but is out of the objective of this article.
XRD provides information for long-range order; trying to get out any piece of information about short-range order may lead to a mistake, in this case MK an SAS consist in two different low crystalline cases: metakaolinite presents an important short-range ordering accompanied by long range disorder and the spinel presents a long-range order, but small crystallite size. But in this work we propose to indirectly quantify them from an XRD patterns treatment. Both MK and SAS are low crystalline phases that do not present important XRD manifestations and that do not present the typical silica glass band in the diffraction patterns [26-29]. Hence, it can be pondered with a well crystalline internal standard like quartz.
Le Bail treatment (Full structure method: LB)
Le Bail used the Rietveld method to reine the silica glass structure adopting a faulted structural model due to very small crystallite size (Carnegieite with orthorhombic space group P212121), treating all the phases as crystalline and called the approximation: Rietveld for disordered material (RDM) method. From his work, it can be concluded that, given an amorphous phase, its structure can be modeled starting from one of its crystalline polymorphs, if known. This means that the calculated diffraction pattern obtained from the nanocrystalline structure, where the long-range order is absent, reproduces the experimental one with good approximation [30]. Lutterotti applied the Le Bail approach for the silica glass to determine the amorphous fraction in ceramic materials containing a glassy phase [31]. He used the cubic model with space group P213, obtaining the same itting results as Le Bail with the orthorhombic one. Other authors applied the same methodology, but using different
crystalline polymorphs of silica. In this work, the cubic model used by Lutterotti was selected to describe the silica glass. While the IS is an indirect quantiication method, this method is direct; strictly, it is supposed that one accepts the idea that a selected crystal structure may represent a mean model for a glass, or a nanocrystalline material. In other words, the XRD intensity (band area) is proportional to the amount of glass. The cell parameters and peak width are reined using a data set collected from pure amorphous silica and these values are then ixed when reining studied samples.
Proposed strategy for quantitative phase evaluation on triaxial ceramics
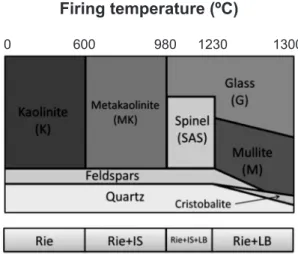
The Rietveld (Rie) method quantiies the crystalline phases; the Le Bail treatment for silica glass can be employed to evaluate correctly the non-crystallinesilica phases and the internal standard method (IS) can be applied, in these systems, in the intermediate iring temperature range where an important fraction consist in low crystalline phases like metakaolinite and the spinel type alumino-silicate, sometimes known as premullite (MK and SAS). The expected phases and proposed quantiication methods are shown in Fig. 1.
In this article we present the results a qualitative and quantitative analysis of the fully crystalline (kaolinite, quartz, cristobalite, feldspars and mullite), the low crystalline (metakaoline and spinel) and glassy phases evolution of a model triaxial (clay-quartz-feldspar) ceramic ired in a wide temperature range between 900 and 1300 ºC, only based in XRD. The quantiication is basedon the Rietveld method, in combination with the internal standard algorithm and the Le Bail approximation.The sinterability, the thermal behaviors (TG-DTA) of a set of triaxial ceramic materials ired at
Figure 1: Schematic iring phase evolution of a triaxial (clay-feldspar-quartz) mixture and the proposed quantiication method. (Rie - Rietveld; IS - Internal Standard; LB - Le Bail approximation). [Figura 1: Esquema da evolução da fase de queima de uma
mistura triaxial (argila-feldspato-quartzo) e o método proposto
de quantiicação. (Rie - Rietveld, IS - padrão interno, LB - aproximação de Le Bail.]
Firing temperature (ºC)
600
different temperatures were evaluated and correlated with the quantiied phases in order to demonstrate its potentials.
EXPERIMENTAL PROCEDURE
A local kaolinitic clay, together with quartz and potash feldspar with industrial grain size powders (mesh 200) were employed for the model triaxial formulation. (PG-La Toma SA, Argentina). The employed clay presents SiO2: 61.8%, Al2O3: 27.9%, Fe2O3: 0.78%, MgO: 0.66%, K2O: % 0.76, and LOI 7.7%. With 60 wt.% of kaolinite and 40 wt.% of quartz.The employed quartz presents 99.9 wt.% purity. The feldspar crystalline composition is 50.0 wt.% of microcline, 34.7 wt.% oligloclase and 15.3 wt.% of quartz with small (≤ 0.5 wt.%) mica content.
Original crystalline phases and formed crystalline phases were analyzed by XRD (Philips 3020 with Cu-kα radiation in Ni ilter at 40 kV-30 mA, 0.04 steps of 2 s were employed in a 2θ range 3-70º). The XRD patterns were analyzed with the program FullProf (Version 5.20 - Jul2011-ILL JRC) which is a multipurpose proile-itting program, including Rietveld reinement to perform phase quantiication [39].
Particle size distribution analysis was performed by laser scattering (Malver-Mastersiezer 2000 with a dispersion unit (Hydro 2000G) with 8000 rpm stirring and ultrasound.
A model triaxial formula was carried out (clay, quartz and feldspar mixture with 60-15-25 wt.% as respective proportions). The starting powders were mixed with excessive water and dried over plaster mold up to optimum plastic condition (approximately 20% water content). Prismatic (8.0 x 8.0 x 50.0 mm3) samples were conformed by plastic deformation and naturally dried for 7 days.
The effect of heat treatment was evaluated by thermogravimetric and differential thermal analysis (DTA-TG) simultaneously carried out on a Netzsch 409C equipment up to 1100 ºC with a heating rate of 10 ºC/min. The sample size employed was 200 mg and alumina was used as reference material.
Samples were ired at different temperatures within the technological range (900, 1000, 1100, 1150, 1200, 1300 ºC), with a heating rate of 10 ºC/min and a 30 min soaking, in electric kiln.
Density and open porosity of sintered samples were determined by the water absorption method. Permanent linear contraction (shrinkage) was also evaluated in the prismatic bars.
RESULTS AND DISCUSSION
Preliminar characterizations
Sintering of the triaxial ceramics
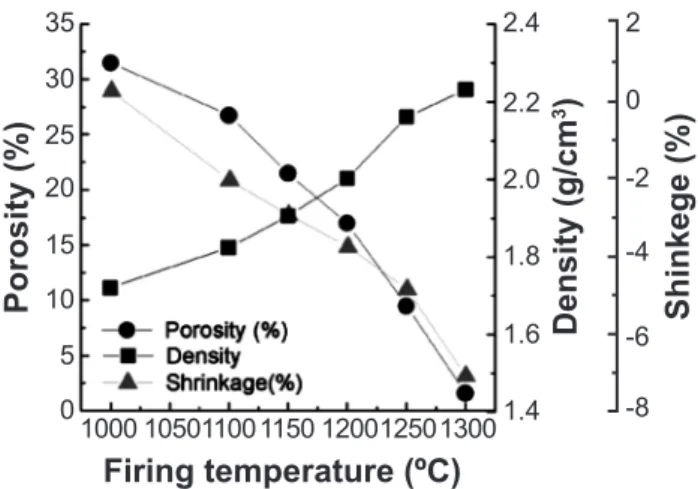
Fig. 2 shows the effect of the iring temperatures on the porosity, density and linear shrinkage.The expected behavior
can be easily observed, a gradual decrease on the porosity takes place from 1000 ºC to 1300ºC. The materials ired at the highest temperature showed nearly null porosity evidencing an almost complete sintering. The linear shrinkage was almost parallel to the porosity evolution. The Archimedes density presented the indirect behavior, increasing gradually up to 2.2 g/cm3 from 1.7 g/cm3. This behavior is consistent to the literature igures for similar materials [1-7].
Thermal behavior of the triaxial ceramic
This analysis permits to identify the transformation temperatures. Also in this case, the thermal behavior is consistent with the literature. Fig. 3 shows the TG and DTA analysis. The typical two mass losses can be observed in the 0-1100 ºC range, the first one (~ 1%), observed below 150 ºC, corresponds to the surface water loss; the second (~ 3%) corresponds to the kaolinite decomposition into metakaolinite (also a water loss). The total mass loss (3.9%) was employed to correct the quartz content to be used for the internal standard method in samples fired between 700 and 1100 ºC. No other mass loss (or gain) process occurs in this temperature range.
Both endothermic and exothermic processes can be detected in the DTA curve.The surface water loss presents is endothermic and is centered at 103 ºC; a broad endothermic band centered at 538 ºC, due to clay dehydroxylation reaction that is overlapped with α-β quartz transformation of less energy involved, is the most important peak of the DTA analysis. The observed temperatures correspond to the TG ones and the temperatures reported in the literature [1-7]. An exothermic peak can be observed centered at 995 ºC; this corresponds to the metakaolinite (MK) transformation into a spinel type alumino-silicate (SAS). At higher temperatures the mullitization will occur. Again, the detected temperatures correspond to the ones observed for similar materials [1-17].
Figure 2: Firing temperature effect on the sintering parameters -porosity, density and linear shrinkage.
[Figura 2: Efeito da temperatura de queima nos parâmetros de
sinterização - porosidade, densidade e retração linear.]
35 2.4 2
0
-2
-6 -4
-8 2.2
2.0
1.6 1.8
1.4 25
15
5 30
20
10
0
1000 105011001150120012501300
Po
ro
si
ty
(%
)
Sh
in
ke
ge
(%
)
Firing temperature (ºC)
D
en
si
ty
(g
/c
m
XRD identiication and reinement
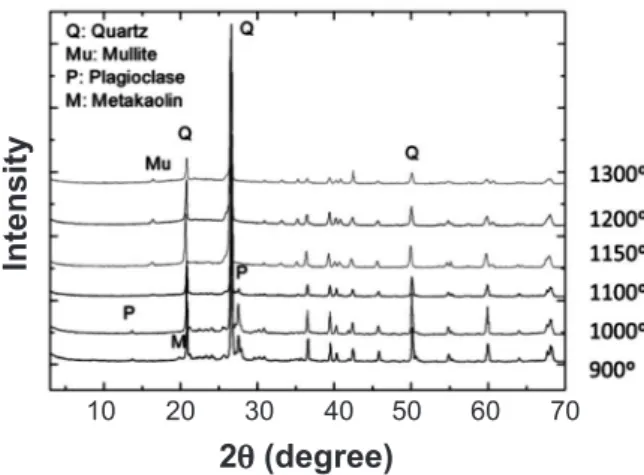
Fig. 4 shows the XRD patterns of the materials obtained after different iring cycles. The principal crystalline phase is the quartz, which is invariant in for the irst samples (below 1200 ºC). The other phase evolution is evident; mullite peaks and the glass band appear after higher temperature treatments. Kaolinite is not present verifying the decomposition. Feldspars (e.g. plagioclase) can be detected in the irst samples.
The Rietveld reinement was carried out on all the samples. Fig. 5 shows the Rietveld reinement plot of the triaxial ceramic ired at 1000 ºC. The Rwp parameter contemplates the reinement goodness. Typical values of Rwp range from a few percent for very accurate reinements to 20-30% for X-ray reinements, depending in part on the counting times used, the degree of preferred orientation, and the number of variable parameters [20]. The reinements were adequate; the Rwp values were, in all cases, between 10 and 30%. Furthermore, in all samples the estimated standard deviation of weight percent derived from the
estimated standards deviations on individual scale factors, for the respective phases were below 1.5%.
Phase quantiication and iring evolution
The mentioned XRD quantiication was carried out for the different iring temperatures. Triaxial based materials present high complexity, featuring crystalline, low crystalline and amorphous phases. While the Rietveld (Rie) method is suitable for quantifying crystalline phases, the Internal Standard method (IS), employing quartz as standard, is proposed for low crystalline phase, and inally the LeBail (LB) treatment is suitable for correctly quantifying the silica based amorphous glass phase. DTA permits to identify the transformation temperatures. For these diffraction patterns, different treatments can be chosen (Rie, Rie+IS, Rie+IS+LB or Rie+LB), as shown in Fig. 1. Fig. 6 shows the experimental results of the quantiications. As a irst glance, both igures are equivalent showing the potential of the proposed analysis. The whole group of chemical processes are illustrated in this graphic, both qualitative and quantitatively. At the beginning, the only clay mineral is kaolinite. Two feldspars were detected (microcline and oligoclase) and the mixture contained almost 50% of quartz. In Fig. 6, feldspars were grouped. An abrupt small step can be observed at the dehydroxylation temperature (~ 580 ºC); this corresponds to the water lost as a consequence of the
Figure 3: ATD-TG curves of the studied triaxial formula.
[Figura 3: Curvas de análise termogravimétrica e térmica
diferencial da fórmula triaxial estudada.]
100
99
97 98
96
95
0 200 400 600 800 1000
Temperature (ºC)
D
TA
(a
a.
uu
.)
TG
(Ma
ss
%
)
Figure 4: XRD patterns of the studied materials ired at different temperatures.
[Figura 4: Difratogramas de raios X dos materiais estudados, tratados termicamente a diferentes temperaturas.]
10
2q (degree)
In
te
ns
ity
30 60
20 40 50 70
Figure 5: Rietveld reinement plot with the observed and calculated diffraction patterns of sample ired at 1000 ºC.
[Figura 5: Gráico do reinamento de Rietveld com os difratogramas
medidos e calculados da amostra tratada termicamente a 1000 °C.]
27000
15000 23000
11000 19000
3000 7000
10
2q (degree)
30 50
20 40 60
15 25 35 45 55 65 70
In
te
ns
ity
(a
.u
.)
Firing temperature (ºC) WS/RS
900 0.695
1000 0.846
1100 0.874
1150 0.886
Table I - Internal standard correction factors.
kaolinite transformation into metakaolinite which presents low crystallinity. MK transforms into spinel alumino-silicate SAS at 980 ºC. It presents low crystallinity as well. The IS treatment was employed for quantifying this phases. Table I shows the correction factor resulting from the internal standard method for the different iring temperatures. The obtained values (between 70 and 90%) show the importance of the crystalline phase content overestimation usually obtained if this correction is not performed.
In clay bodies a lux creates a limited and controlled amount of glass, which works to cement crystalline components together. Fluxes play a key role in the vitriication of clay bodies by reducing the overall melting point, which allows for a more eficient kiln iring. The most common luxes used in clay bodies are feldspars. A complete review on these reactions can be found elsewhere [1].
Microcline (KAlSi3O8) is potassium-rich alkali feldspar.
Microcline typically contains minor amounts of sodium. Sanidine K(Si,Al)4O8 is a polymorph of alkali feldspar stable at higher temperature. Oligoclase belongs to the plagioclase feldspars. In chemical composition and in its crystallographic and physical characters it is intermediate between albite (NaAlSi3O8) and anorthite (CaAl2Si2O8). The albite:anorthite molar ratio ranges from 90:10 to 70:30. Oligoclase is high sodium feldspar crystallizing in the triclinic system [1]. The feldspar transformations were also evaluated. Fig. 7 shows the content evolution of these phases. Below 1000 ºC microcline and oligoclase were detected (together ~ 18 wt.%) after 1100 ºC cycles both feldspars decompose partially and sanidine is detected [1, 3]. Sanidine is stable at higher temperatures and is a product of the microcline thermal decomposition. As expected, no sodium feldspar was detected after 1150 ºC cycles and the only potash feldspar was sanidine. At higher iring cycles the amount of sanidine decreases gradually. After the 1300 ºC cycle no feldspar was detected.
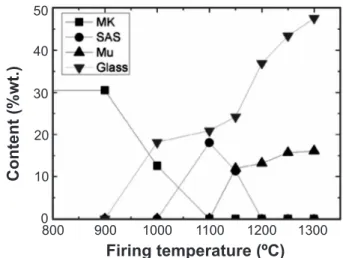
Metakaolinite (MK) and spinel aluminum-silicate (SAS) are the intermediates transition phases in the kaolinite-mullite formation. MK and SAS present low crystallinity but with IS they can be pondered. Fig. 8 shows the proportion evolution of these two intermediates with the iring temperature evaluated by the XRD based method; the amount of glassy phaseis plotted as well. The formation and posterior decomposition of the SAS can be correctly evaluated by this method, showing the potential of the proposed analysis.
MK abundance at 800 ºC is equivalent to initial kaolinite content (~ 31%). This allows to conclude that the IS method is appropriate to quantify this phase at the early stages of iring process, and between 980 and 1230 ºC permits to separate it from the developed glassy phase that is determined by the Le Bail approach.The sintering of these kinds of materials
Figure 6: Firing transformations in the triaxial material as a function of the iring temperature.
[Figura 6: Transformações sob queima no material triaxial em função das temperaturas de queima.]
100
90
50 70
30
10 80
40 60
20
0 0
Firing temperature (ºC)
C
on
te
nt
(%
w
t.)
400 800
200 600 1000 1200
Figure 7: Evolution of the feldspar content evaluated by the proposed methods as function of the iring temperature.
[Figura 7: Evolução do teor de feldspato avaliado pelos métodos
propostos, em função da temperatura de queima.]
20
10 15
5
0
800 900 1000 1100 1200 1300
Firing temperature (ºC)
Fe
ld
sp
ar
c
on
te
nt
(%
w
t.)
Figure 8: Low crystalline (MK and SAS), non-crystalline (G) and mullite evolution content evaluated by the proposed methods as function of the iring temperature.
[Figura 8: Evolução do teor de baixa cristalinidade (MK e SAS),
não cristalinidade (G) e mulita avaliada pelos métodos propostos,
em função da temperatura de queima.]
50
30 40
20
10
0
800 900 1000 1100 1200 1300
Firing temperature (ºC)
C
on
te
nt
(%
w
is viscous low sintering [1, 12], hence it is strongly related to the actual amount of glass phase, and these is usually calculated indirectly or measured after a complex chemical dilution. As an example, for showing the potential of the employed analysis, the results of the glass phase evaluation are correlated with sintering parameter in Fig. 9.
CONCLUSIONS
An XRD pattern treatment for qualitative and quantitative analysis of triaxial materials (clay-quartz-feldspar) and its iring temperature evolution is proposed. This is based in the Rietveld analysis applying an internal standard method and the approximation irst employed by Le Bail (A full structure method) to quantify amorphous/non-diffracting/ low-crystalline phases. This methodology permitted to quantify the fully crystalline (kaolinite, quartz, cristobalite, feldspars and mullite), the low crystalline (metakaoline and spinel type pre-mullite) and glassy phases evolution of a model triaxial ceramic ired in a wide temperature range between 900 and 1300 ºC. A preliminary sintering characterization was carried out by contraction, density and porosity evolution with the iring temperature. Simultaneous thermogravimetric and differential thermal analysis was carried out to elucidate the actual temperature at which the chemical changes occur. The obtained behaviors and properties values correspond to typical triaxial ceramics, demonstrating that the results may be extended to similar materials. Finally, the quantitative analysis based on the Rietveld reinement of the X-ray diffraction patterns was performed. The kaolinite decomposition was determined (~ 600 ºC), the intermediate (980ºC) spinel type alumino-silicate formation was also quantiied, the incongruent fusion of the potash feldspar was observed and quantiied together with the inal mullitization and the amorphous (glassy) phase formation.The ability of the proposed methodology to quantify separately low crystallinity phases (MK y SAS) and glassy phase, allows correlating mechanical properties
speciically with the content of this last phase. The pattern treatment demonstrated to be suitable for quantitatively evaluate the thermal transformations that occur in a complex system like the triaxial ceramics. The evaluated phases were easily correlated with the processing variables and materials properties. These correlations can be employed for materials characterization, design and processing control.
REFERENCES
[1] W. M. Carty, U. Senapati, “Porcelain-Raw Materials, Processing, Phase Evolution and Mechanical Behaviour”, J. Am. Ceram. Soc. 81, 1 (1998) 3-20.
[2] N. L. S. Lisiane, J. S. Bartolomeu, P. G. Wherllyson, M. C. Juliana, S. L. Bruna, C. S. Renato, R. M. Romualdo, “Inluence of iring conditions on properties of red ceramic”, Mater. Sci. Forum 727-728 (2012) 721-726.
[3] Y. Iqbal, W. E. Lee, “Microstructural evolution in triaxial porcelain”, J. Am. Ceram. Soc. 83, 12 (2000) 3121-3127. [4] A. De Noni, D. Hotza, V. CantavellaSoler, E. Sánchez Vilches, “Inluence of composition on mechanical behaviour of porcelain tile. Part III: Effect of the cooling rate of the iring cycle”, Mater. Sci. Eng. A 528,9 (2011) 3330-3336. [5] O. Castelein, B. Soulestin, J. P. Bonnet, P. Blanchart, “The inluence of heating rate on the thermal behaviour and mullite formation from a kaolin raw material”, Ceram. Int. 27, 5 (2001) 517-522.
[6] M. M. Jordán, J. D. Martín-Martín, T. Sanfeliu, D. Gómez-Gras, C. de la Fuente, “Mineralogy and iring transformations of Permo-Triassic clays used in the manufacturing of ceramic tile bodies”, Appl. Clay Sci. 44, 1-2 (2009) 173-177.
[7] S. J. G. Sousa, J. N. F. Holanda, “Characterization of non-calcareous “thin” red clay from south-eastern Brazil: Applicability in wall tile manufacture”, Ceramica 58, 345 (2012) 29-35.
[8] M. M. Jordán, A. Boix, T. Sanfeliu, C. De La Fuente, “Firing transformations of cretaceous clays used in the manufacturing of ceramic tiles”, Appl. Clay Sci. 14, 4 (1999) 225-234.
[9] M. Dondi, M. Raimondo, C. Zanelli, “Clays and bodies for ceramic tiles: Reappraisal and technological classiication”, Appl. Clay Sci. 96 (2014) 91-109.
[10] M. F. Serra, M. S. Conconi, G. Suarez, E. F. Agietti, N. M. Rendtorff, “Firing transformations of an argentinean calcareous commercial clay”, Ceramica 59, 350 (2013) 254-261.
[11] M. F. Serra, M. F. Acebedo, M. S. Conconi, G. Suarez, E. F. Aglietti, N. M. Rendtorff, “Thermal evolution of the mechanical properties of calcareous earthenware”, Ceram. Int. 40, 1, part B (2014) 1709-1716.
[12] C. Zanelli, M. Raimondo, G. Guarini, M. Dondi, “The vitreous phase of porcelain stoneware: Composition, evolution during sintering and physical properties”, J. Non-Crystalline Solids 357, 16-17 (2011) 3251-3260.
[13] C. Zanelli, M. Raimondo, G. Cuarlni, M. Dondi, C. Iglesias, E. Domínguez, R. Ullmann, “Improving
Figure 9: Textural properties of the triaxial ceramic as a function of the glass content.
[Figura 9: Propriedades de textura da cerâmica triaxial em função
do teor de vidro.]
30 40
20
10
0
0 10 30 40 50
2.4
2.0 2.2
1.8
1.6 20
Firing temperature (ºC)
D
en
si
ty
(g
/c
m
3 )
Po
ro
si
ty
(%
technological performances of ball clays: A case-study from patagonia (Argentina)”, CFI Ceram. Forum Int. 88, 8-9 (2011) E42-E48.
[14] E. Gasparini, S. C. Tarantino, P. Ghigna, M. P. Riccardi, E. I. Cedillo-González, C. Siligardi, M. Zema, “Thermaldehydroxylation of kaolinite under isothermal conditions”, Appl. Clay Sci. 80-81 (2013) 417-425. [15] P. Ptáček, F. Šoukal, T. Opravil, J. Havlica, J. Brandštetr, “The kinetic analysis of the thermal decomposition of kaolinite by DTG technique”, Powder Technol. 208, 1 (2011) 20-25.
[16] P. Ptáček, D. Kubátová, J. Havlica, J. Brandštetr, F. Šoukal, T. Opravil, “The non-isothermal kinetic analysis of the thermal decomposition of kaolinite by thermogravimetric analysis”, Powder Technol. 204, 2-3 (2010) 222-227. [17] A. H. De Aza, X. Turrillas, M. A. Rodriguez, T. Duran, P. Pena, “Time-resolved powder neutron diffraction study of the phase transformation sequence of kaolinite to mullite”, J. Eur. Ceram. Soc. 34, 5 (2014) 1409-1421.
[18] H. M. Rietveld, “A proile reinement method for nuclear and magnetic structures”, J. Appl. Cryst. 2 (1969) 65-71.
[19] R. A. Young, “The Rietveld Method,” International Union Crystallography, Oxford Univ. Press, Oxford, UK (1993).
[20] D. L. Bish, J. E. Post, “Quantitative mineralogical analysis using the Rietveld full-pattern itting method”, Am. Mineralogist 78 (1993) 932-940.
[21] I. C. Madsen, N. V. Y. Scarlett, L. M. D. Cranswick, T. Lwin, “Outcomes of the Int. Union of Crystallography Commission on Powder Diffraction Round Robin on Quantitative Phase Analysis: samples 1a to 1h”, J. Appl. Cryst. 34, (2001) 409-426.
[22] K. J. D. MacKenzie, I. W. M. Brown, R. H. Meinhold, M. E. Bowden, “Outstanding problems in the kaolinite-mullite reaction sequence investigated by 29Si and 27Al solid-state nuclear magnetic resonance: I, metakaolinite”, J. Am. Ceram. Soc. 68,6 (1985) 293-297.
[23] S. Lee, Y. J. Kim, H.-S. Moon, “Energy-Filtering Transmission Electron Microscopy (EF-TEM) Study of a Modulated Structure in Metakaolinite, Represented by a 14 Å Modulation”, J. Am. Ceram. Soc. 86, 1 (2003) 174-76. [24] A. Tironi, M. A. Trezza, A. N. Scian, E. F. Irassar, “Assessment of pozzolanic activity of different calcined clays”, Cem. Concr. Composites 37, 1 (2013) 319-327. [25] F. Cassagnabère, M. Mouret, G. Escadeillas, P. Broilliard, A. Bertrand, “Metakaolin, a solution for the precast industry to limit the clinker content in concrete: Mechanical aspects”, Constr. Build. Mater. 24, 7 ( 2010) 1109-1118.
[26] K. Okada, N. Otsuka, J. Ossaka, “Characterization of spinel phase formed in the kaolin-mullite thermal sequence”, J. Am. Ceram. Soc. 69, 10 (1986) C251-C253.
[27] J. Sanz, A. Madani, J. M. Serratosa, J. S. Moya, S.
Aza, “Aluminum-27 and Silicon-29 magic-angle spinning nuclear magnetic resonance study of the kaolinite-mullite transformation”, J. Am. Ceram. Soc. 71, 10 (1988) C418-C421.
[28] I. W. M. Brown, K. J. D. MacKenzie, M. E. Bowden, R. H. Meinhold, “Outstanding problems in the kaolinite-mullite reaction sequence investigated by 29Si and 27Al solid-state nuclear magnetic resonance: II, high-temperature transformations of metakaolinite”, J. Am. Ceram. Soc. 68, 6 (1985) 298-301.
[29] H. Schneider, J. Schreuer, B. Hildmann, “Structure and properties of mullite-A review”, J. Eur. Ceram. Soc. 28, 2 (2008) 329-344.
[30] A. Le Bail, “Modeling the Silica Glass Structure by the Rietveld Method”, J. Non-Crystalline Solids 183, 1-2 (1995) 39-42.
[31] L. Lutterotti, R. Ceccato, R. Dal Maschio, E. Pagani, “Quantitative Analysis of Silicate glass in Ceramic Materials by the Rietveld Method”, Mater. Sci. Forum 278-281 (1998) 87-92.
[32] A. F. Gualtieri, M. Zanni, “Quantitative determination of crystalline and amorphous phase in traditional ceramics by combined Rietveld-RIR method”, Mater. Sci. Forum 278-281, 2 (1998) 834-839.
[33] A. F. Gualtieri, “Accuracy of XRPD QPA using the combined Rietveld-RIR, method”, J. Appl. Cryst. 33 (2000) 267-78.
[34] J. M.-Marquez, A. G. De la Torre, M. A. G. Aranda, J. Ma Rincón, M. Romero, “Evolution with Temperature of Crystalline and Amorphous Phases in Porcelain Stoneware”, J. Am. Ceram. Soc. 92, 1 (2009) 229-234.
[35] M. Baricco, S. Enzo, T. A. Baser, M. Satta, G. Vaughan, A. R. Yavari, “Amorphous/nanocrystalline composites analyzed by the Rietveld method”, J. Alloys Compnd. 495 (2010) 377-381.
[36] M. S. Conconi, N. M. Rendtorff, E. F. Aglietti, “Evaluation of Non Crystalline Phase in AZS Refractories by XRD Methods”, New J. Glass Ceramics 1, 2 (2011) 21-25.
[37] C. Madsen, N. V. Y. Scarlett, A. Kern, “Description and survey of methodologies for the determination of amorphous content via X-ray powder diffraction”, Zeitschrift Kristallographie 226 (2011) 944-955.
[38] N. V. Y. Scarlett, I. C. Madsen, L. M. D. Cranswick, T. L. Edward Groleau, G. Stephenson, M. Aylmore, N. Agron-Olshina, Outcomes Int. Union Crystallography Comm. Powder Diffraction Round Robin on “Quantitative Phase Analysis: Samples 2, 3, 4, Synthetic Bauxite, Natural Granodiorite and Pharmaceuticals,” J. Appl. Crystallography 35, 4 (2002) 383-400.
[39] J. Rodríguez-Carvajal, “Recent Developments of the Program FULLPROF”, in Commission on Powder Diffraction (IUCr) Newsletter 26 (2001) 12-19.