Short Report
S
J. Braz. Chem. Soc., Vol. 26, No. 8, 1730-1736, 2015. Printed in Brazil - ©2015 Sociedade Brasileira de Química 0103 - 5053 $6.00+0.00*e-mail: [email protected]
Multivariate Analysis of Perfumes by Ultraviolet Spectrophotometry
Clêrton L. Gomes,a,d Ari Clecius A. Lima,c Manuela C. L. Cândido,e Abel. B. R. Silva,f Adonay R. Loiolab and Ronaldo F. Nascimento*,a
aDepartamento de Química Analítica e Físico-Química,
bDepartamento de Química Orgânica e Inorgânica, Centro de Ciências and
cDepartamento de Engenharia Hidráulica e Ambiental, Centro de Tecnologia,
Universidade Federal do Ceará, Campus do Pici, 60440-900 Fortaleza-CE, Brazil
dInstituto Federal de Educação Ciência e Tecnologia do Ceára,
Campus Acaraú, 62580-000 Acaraú-CE, Brazil
ePerícia Forense do Estado do Ceará, 60010-000 Fortaleza-CE, Brazil
fLaboratório de Econometria e Otimização, CAEN, Centro de Humanidades 2,
Universidade Federal do Ceará, 60020-181 Fortaleza-CE, Brazil
An efficient, fast and cost-effective method for detecting adulteration in perfumes by UV spectroscopy and multivariate analysis is proposed. Classification of perfumes, either as original or fake, was accomplished with the spectroscopic data using chemometric techniques such as principal component analysis (PCA), soft independent modeling of class analogy (SIMCA) and linear discriminant analysis (LDA).
Keywords: perfume, falsification, UV spectrophotometry, chemometrics
Introduction
Perfume, a product which is of great economic importance in the cosmetics industry, consists mainly of natural and/or synthetic fragrances.1 The manufacture of
this product involves combining the various ingredients with each product having its own particular formula.
Because the profitability of this sector, a parallel trade in counterfeit products has emerged in many countries. This trade is damaging to the economy, because it reduces tax revenues and can also negatively influence the sales of products within the cosmetics industry.2
In addition to undermining the economy, such products represent a risk to public health, once in their manufacture processes low-quality raw materials as well as inappropriate concentrations are used, which can lead to numerous health problems.3,4 Clinical studies have shown that counterfeit
products can cause contact allergic reactions, especially on the skin, thus causing dermatitis.4
Perfume is essentially composed of ethanol, water and fragrances. If the quality of the final product is not strictly
controlled, it may exhibit a short half-life and the pleasant smell will be equally short lived.5
In this context, recent studies have investigated counterfeit perfumes using various analytical techniques. Poprawski et al.6 and Cano et al.3 used an ‘electronic
nose’ to differentiate between true and false samples. Haddad et al.,7 Chingin et al.8 and Marques et al.2 used mass
spectrometry with electrospray ionization to distinguish between original and fake products. Although efficient, these techniques are quite complex and costly.
For this reason, UV spectrophotometry is a promising analytical tool to be used as alternative to other instrumental methods already available in research laboratories, since this technique has been used with efficiency to classify, identify and distinguish original products from fake copies.9,10 The traditional treatment of data did not lead to a
conclusive evaluation, due to the complexity of qualitative interpretation of UV spectra, but when processed by statistical chemometric techniques it was possible to draw some interesting conclusions.9-11
produced by different raw materials,9 adulteration of
biodiesel,10 adulteration and counterfeiting of tequila,11
rating different types of wines,12,13 adulteration of juices,14
rating different types of tequila,15 classification of blends
of coffee,16 types of tobacco to determine their ethanol
extracts,17 and classification of types of spirits.18
Analysis by principal component analysis (PCA) are among the main chemometric methods for pattern recognition. This technique is based on the assumption that the more the characteristics the samples share, the more they are closely grouped in a multidimensional space.9 It is a statistical procedure in which orthogonal
transformations are used to convert a set of observations of possibly correlated variables into an uncorrelated linear combination called principal components.19
The SIMCA method (soft independent modeling of class analogy) is a supervised statistical method using information obtained from a set of samples, based on the PCA analysis, in order to obtain the characteristics of each category, and thus determine the distances between samples.9
Linear discriminant analysis (LDA) is a technique for recognizing supervised patterns. Its approach to classification is based on maximizing the variance between categories and on minimizing the variance within categories, generating a series of orthogonal linear discriminants in functions equal to the number of categories minus one.20
This study focuses on perfumes classification, by highlighting the use of UV spectrophotometry as a rapid and low cost technique, using the applicability of statistical chemometric techniques such as PCA, SIMCA and LDA.
Experimental
Reagents and samples
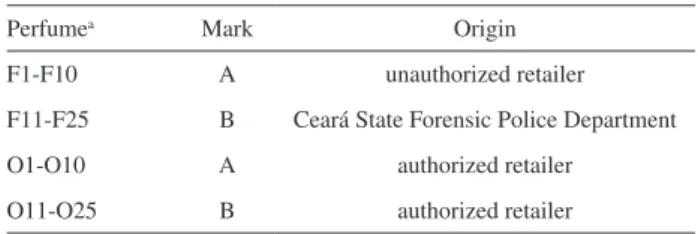
A total of 50 samples of perfumes were used in this work, being 25 originals (genuine) and 25 fakes (counterfeit), as shown in Table 1. The original products were purchased from two authorized Brazilian perfume manufacturers: 10 from manufacturer A (O1-O10) and 15 from manufacturer B (O11-O25). The fake perfumes were obtained from either unauthorized perfume retailers in the Fortaleza city, Ceará (Brazil) (F1-F10), or from the Ceará State Forensic Police Department (Brazil) (F11-F25). Analytical grade ethanol from Merck (Brazil) was used and the standards of fragrances (1000 mg L-1), certified by Acunstandart (USA), limonene,
linalool, citral, coumarin, eugenol, isoeugenol, cinnamyl alcohol, amyl cinnamyl alcohol, cinnamal, amyl cinnamal, benzyl cinnamate and hexyl cinnamal.
Instrumentation and software
Spectrophotometric analyses were performed on a UV-Vis 1800 Spectrophotometer (Shimadzu). The data were processed by Origin 8.0 (OriginLab Corporation, USA) and the free statistical software R Project (Austria).21
Methodology
The perfume samples were diluted at a ratio of 5 µL to 10 mL in ethanol (1:2000, v/v). Solution of 10 mg L-1
was prepared (in ethanol) from the standards solutions of fragrances (1000 mg L-1). Analytical grade ethanol has
been used as blank.
Spectrophotometric analysis were performed using a quartz optical cell (1 cm) for a scan range of 190-800 nm. Three reading for the same sample were performed and the average spectrum was calculated. After this, the range of 200-380 nm, related to the ultraviolet absorption region, was chosen in order to be processed by statistic software. The data generated a 50 × 181 matrix which was processed by multivariate analysis.
Multivariate analysis
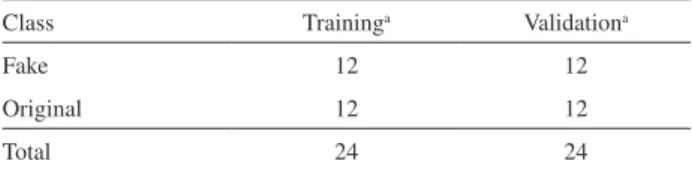
The spectra were processed using a Savitzky-Golay filter and treated by the first order derivative, using R Project software. The data generated were analyzed by an unsupervised technique (PCA), and by two other supervised techniques, (LDA and SIMCA), both carried out by using R Project software. PCA data were autoscaled and the algorithm used was singular value decomposition (SVD). In SIMCA samples of both original and counterfeit perfumes were used for the training and validation steps and classification, as shown in Table 2.
The discriminant analysis is desirable to identify and classify an element in a given group by original and fake perfumes. Itis particular desirable to identify and classify an element in a given group by using a set of variables, or even part of this set, by means of their linear combinations (which possess some similarity with the multiple fit), i.e., it
Table 1. Type of perfume, mark and origin
Perfumea Mark Origin
F1-F10 A unauthorized retailer
F11-F25 B Ceará State Forensic Police Department
O1-O10 A authorized retailer
O11-O25 B authorized retailer
is a statistical technique that tries to select the best variable capable of differentiating the groups, so that a better classification of the elements of a given population can be done. In the discriminating analysis there is a possibility of finding more than a single function that represents statistical model; such functions are necessary either for the classification of each element or for a new one. In contrast to logistic fit, in which the interest relies on determining a function whose exit in a close interval in 0 and 1, the discriminating analysis allows a direct classification of one element in a given category.
As in a fit, the weight of the variables in the discriminating function maximizes the distance between the categories. The greatest interest is to maximize the distances between the categories, i.e., to find an equation that possesses strength enough to discriminate among groups. Beta coefficients of the patterned equation contribute to the strength of the variable in the score; good predictors tend to be stronger in this function.
Discriminating analysis allows the calculation of a new axis, which is the linear contribution of the variables, and that better separates the data set within the categories. This function is the discriminating function. This new axis passes through the centroids in such a way that there is no superposition of the groups.
The centroid represents the average value of the discriminating function in each group of the dependent variable. When the dependent variable possesses two categories, the cut point is the weighted average of the group centroids. If the discriminating function calculated value foreach element (or a new element) is lower than the cut point, the element will be classified as 1 (first category), otherwise as 2 (second category).
Results and Discussion
UV spectra of perfume samples
Figure 1 shows the UV spectra of original perfumes in the region of 200-380 nm. It can be seen that the original perfume exhibits a significant band at 205 nm and several other minor bands ranging from 210 to 380 nm; especially
the bands at approximately 220, 230, 250, 280, 310 and 360 nm.
These absorptions in the UV spectra may be due to the diversity of chemical compounds present in the perfume fragrances. The compounds can be classified into terpenoids, musks, aliphatic derivatives and aromatic derivatives, which are characterized by the presence of unsaturated conjugated or unconjugated carbon-carbon and/or the presence of carbonyl.6 The bands observed (in
samples) at range of 200-380 nm are in accordance to those found in the UV spectra of individual solutions (10 mg L-1
in ethanol) such as limonene, linalool, citral, eugenol, coumarin, eugenol, isoeugenol and cinnamic derivatives (see Supplementary Information (SI) section).
Figure 2 shows the spectra of fake perfumes which present a smaller number of bands, with lower intensity. The main bands were found in 205 and 220 nm, but with less intensity than the original product. The other bands tend not to appear due to effect of dilution (1:2000). When the original perfumes (Figure 1) are compared to the fake ones, it can be observed that the original products feature a spectral profile in the UV region distinct from the counterfeit products. The original products feature more bands with greater intensity and the fake ones showless bands with less intensity. This may be an indirect way of measuring the content of fragrances, suggesting thereby that fake perfume fragrances have a lower amount.
By the analysis of the spectra of the original (O4) and fake (F4) samples at the same dilution factor (1: 2000) (Figure 3), it can be noted that the original sample displays three bands (203, 222 and 278 nm), while the fake samples presented a very low band in 203 nm. Changing the dilution factor (1: 100) of the fake sample (F4), a band in 222 nm was observed with less intensity when compared to the original sample.The spectrum of the ethanol absorbs a minimum amount, indicating that sample absorption is referred to the fragrances present in perfumes.
Chemometrics analysis
The UV spectrophotometric data of the 50 samples (25 original and 25 fake) were treated by R Project software, giving rise PCA, SIMCA and LDA. The chemometric techniques allowed us to efficiently differentiate and classify the analyzed samples.
When the PCA was applied to the UV data for the 50 studied samples, three principal components preserved 96.97% of spectral variation for PC1(88.53%), PC2 (7.01%) and PC3 (1.38%). The PCA results are shown in Figure 4. According to these results, some degree of separation between fake and original samples was reached.
Table 2. Division of the samples into training and validation for SIMCA model
Class Traininga Validationa
Fake 12 12
Original 12 12
Total 24 24
200 250 300 350 0.0 0.5 1.0 1.5 2.0 2.5
200 250 300 350
0.0 0.5 1.0 1.5 2.0 2.5
200 250 300 350
0.0 0.5 1.0 1.5 2.0 2.5
200 250 300 350
0.0 0.5 1.0 1.5 2.0 2.5 A b s o rb a n c e
Wavelength / nm O1 O2 O3 O4 O5 O6 A b s o rb a n c e
Wavelength / nm O7 O8 O9 O10 O11 O12 A b s o rb a n c e
Wavelength / nm O13 O14 O15 O16 O17 O18 A b s o rb a n c e
Wavelength / nm
O19 O20 O21 O22 O23 O24 O25
Figure 1. UV spectra of original perfumes.
Figure 2. UVspectra of fake perfumes.
200 200 250 250 300 300 350 350 0.0 0.2 0.4 0.6 2.0 2.5
200 250 300 350
0.0 0.2 0.4 0.6 2.0 2.5 0.0 0.2 0.4 0.6 2.0 2.5
200 250 300 350
0.0 0.2 0.4 0.6 2.0 2.5 A b s o rb a n c e
Wavelength / nm
F1 F2 F3 F4 F5 F6 A b s o rb a n c e
Wavelength / nm
F6 F7 F8 F9 F10 F11 F12 A b s o rb a n c e
Wavelength / nm
F13 F14 F15 F16 F17 F18 A b s o rb a n c e
Wavelength / nm
F19 F20 F21 F22 F23 F24 F25
200 250 300 350
0.0 0.5 1.0 1.5 2.0 2.5
200 250 300 350
0.0 0.5 1.0 1.5 2.0 2.5
200 250 300 350
0.0 0.5 1.0 1.5 2.0 2.5
200 250 300 350
0.0 0.5 1.0 1.5 2.0 2.5 A b s o rb a n c e
Wavelength / nm O1 O2 O3 O4 O5 O6 A b s o rb a n c e
Wavelength / nm O7 O8 O9 O10 O11 O12 A b s o rb a n c e
Wavelength / nm O13 O14 O15 O16 O17 O18 A b s o rb a n c e
Wavelength / nm
O19 O20 O21 O22 O23 O24 O25 200 200 250 250 300 300 350 350 0.0 0.2 0.4 0.6 2.0 2.5
200 250 300 350
0.0 0.2 0.4 0.6 2.0 2.5 0.0 0.2 0.4 0.6 2.0 2.5
200 250 300 350
0.0 0.2 0.4 0.6 2.0 2.5 A b s o rb a n c e
Wavelength / nm F1 F2 F3 F4 F5 F6 A b s o rb a n c e
Wavelength / nm F6 F7 F8 F9 F10 F11 F12 A b s o rb a n c e
Wavelength / nm F13 F14 F15 F16 F17 F18 A b s o rb a n c e
The fake products were closely grouped because of the fewer and less intense absorptions of their fragrances, since the original perfumes are in a spaced apart presenting a greater quantity and more intense absorptions in their spectra, suggesting that they have more fragrances, each having a unique set of fragrances with a unique characteristics for each product.
The supervised SIMCA analysis was constructed for each category of both original and fake perfumes. The construction of this model used the first principal component of the PCA. In Figure 5 it is possible to observe the variables that contributed most to the construction of the model, especially the wavelength 203 nm. In the Figure 6a the Cooman’s plot represents the distance between original and counterfeit classes at 95% of statistical confidence. The original samples are exactly classified. In the case of fake samples, although almost all appear to be classified in both classes, there is a significant distance from the original class model.
Figures 6b and 6c show the residual graphs for each model. A plot of Q2 (distances to model center) versus T2 values (residuals to model)22 reveals the differences
between the authentic perfumes reference samples and the fake perfumes. This result for the class of fake
200 250 300 350
0.0 0.2 0.4 0.6
0.8
1.0 1.2 1.4
A
b
s
o
rb
a
n
c
e
Wavelength / nm
F4 1:2000 O4 1:2000 F4 1:100 Ethanol
Figure 3. UV spectra of the diluted samples: original (O4), fake (F4) and ethanol.
Figure 4. PCA of UV data for original and fake perfumes.
Figure 5. Power discrimination SIMCA.
Figure 6. Distance to class in (a); original residuals in (b) and fake residuals in (c).
200 250 300 350
0.0 0.2 0.4 0.6 0.8 1.0 1.2 1.4
A
b
s
o
rb
a
n
c
e
Wavelength / nm
perfume demonstrated sensitivity to the technique used to distinguish false from original samples.
Table 3 shows that in the summary of the results of the supervised analysis, where we have two classes (original and fake perfumes) of the 24 original samples, only one was not classified, and that all fake samples were classified correctly.
In this LDA study we are interested in finding a statistical model that best represents the classification of perfumes. The sample consisted of 50 observations, where 25 are from fake perfumes and the other 25 are from original perfumes. The object of this study was to find a way to show the origin of certain perfumes using statistical techniques. The variables were obtained through UV spectroscopy. Within this set of variables, it was possible to select the ones that best represent the discriminatory power of fake and original perfumes.
As there was a set of variables that could discriminate between the groups, it is estimated that a function that has all these indicators or only has some of these variables, i.e., those which have greater discriminatory power. Through the stepwise method used, it was possible to select the variables that had a greater explanatory or discriminatory power.
In order to verify the reliability of the model, a computer generated randomization process was chosen to separate the sample into two sub-samples: size 28 for the first and size 22 for to the second. The first sub-sample was used to generate the discriminant function, while the second was a model for testing and evaluation, as no new elements were used in the first sub-sample.
Before a discriminant analysis structure, we must check for the mean difference between groups, in order to continue the analysis, and identify which variables have a better discriminating power amongst the variables being studied.
Through the data was calculated for all 181 variables, the Wilk’s lambda statistics (the closer to zero, the better the discrimination) and the F-ANOVA test, using a significance level of 5%. The variables V200 to V337 were significant and could therefore be considered as candidates to enter the model. The rest of the variables V338 to V380 did not have discriminatory power, so they were excluded.
The next step was to verify the multicollinearity of the variables still under review. It was found that the variables
had significant positive correlations when compared in pairs. In this sense, it could be expected that either a few variables or just one explain the relationship, because of the strong positive correlation between the spectra.
With the assumptions regarding equality between the model covariance matrices it was found that the Box M test the calculated p-value was 0.026. Even if the significance is less than 0.05 continue with the study, perhaps with a larger sample size the results could be better.
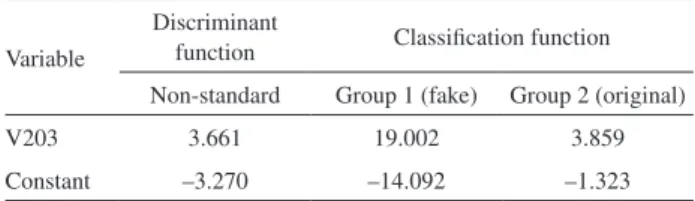
Through stepwise identified that attached, the V203 variable has the best discriminatory power. Thus, it becomes the model:
Z = –3.270 + 3.661 × V203 (1)
where Z is the Fisher’s linear discriminant function. In addition to these functions, the functions of a classification that can be seen in Table 4 were also calculated. The interpretation of these coefficients suggests that when analyzing an unknown perfume and calculating the value of specific absorption in the UV region, there is an evidence that if the wavelength was higher than 203 nm then it was an original perfume. By the discriminatory function (equation 1) it is possible to calculate that an index value greater than 1.105 is obtained when the classification of the perfume is original, but if less than this value it is fake.
Finally, the evaluation of the model proved quite satisfactory, since the cases analyzed the first sub-sample and sub-sample test were 96.4% correctly classified. With respect to the explanatory power of the model, the value found was approximately 82%, showing that there is a good explanation of the variability of the dependent variable, which can be explained by the model, and includes only the variable V203. One can then consider that this model is able to perform, to a high level, the classification of perfumes of unknown provenance.
By analyzing the results of the SIMCA and supervised chemometric LDA models, it is clear that absorption at of 203 nm plays an important role to distinguish between original and fake perfumes. Absorptions in this wavelength suggest the presence of compounds that have unsaturation
Table 3. Results of the SIMCA model
Class Sample Variance / %
Correctly
classified Misclassified Not classified
Origin 24 80.81 23 0 1
Fake 24 86.71 24 0 0
Table 4. Values of discriminant function and classification function coefficients
Variable
Discriminant
function Classification function
Non-standard Group 1 (fake) Group 2 (original)
V203 3.661 19.002 3.859
between carbons unconjugated as can be observed in the spectra of limonene and linalool fragrances (see Supplementary Information (SI) section).
The study of Haddad et al.,7 successfully distinguished
the original perfumes from the fake products. In the study by Marques et al.,2 fake, original and inspiring perfumes
could be differentiated. Both studies used the electrospray mass spectrometry type and achieved the separation by PCA.
Poprawski et al.,6 worked to distinguish original from
fake perfumes using an ‘electronic nose’. Cano et al.,3
worked with the same technique to analyze unique, inspiring and fake perfumes. These two studies were able to separate the sample by PCA.
The study presented here is able to carry out a rapid and low cost analysis, when compared to electrospray mass spectrometry and the ‘electronic nose’ type. The work allows the separation of the products by chemometric tools: PCA, SIMCA and LDA; and to our knowledge, this is the first study reporting the use of UV spectrophotometry for this type of sample.
Conclusion
UV spectrophotometry has proved to be an efficient, rapid, easy to use and inexpensive technique which can be used to differentiate original perfumes from counterfeit ones. By analyzing the UV spectra of both original and counterfeit perfumes, we suggest that the original perfumes have a higher amount of fragrances than their counterfeit equivalents; due to the spectral profile of the original products have higher quantity and intensity bands than false products. The UV spectroscopy combined with chemometrics showed excellent results using PCA, SIMCA and LDA, and were effective for distinguishing the original perfumes from false.
Supplementary Information
Supplementary information (Figures S1 to S3) is available free of charge at http://jbcs.sbq.org.br as PDF file.
Acknowledgement
The authors thank to the Ceará State Forensic Police Department, Brazil by the donation of the samples for this study. This work was supported by FUNCAP (Proc. No. 059.01.00/10) for the financial this research.
References
1. Mata, V. G.; Gomes, P. B.; Rodrigues, A. E.; AIChE J. 2005,
51, 2834.
2. Marques, L. A.; Catharino, R. R.; Bruns, R. E. ; Eberlin, M. N.;
Rapid Commun. Mass Spectrom.2006, 20, 3654.
3. Cano, M.; Borrego, V.; Roales, J.; Idígoras, J.; Lopez-Costa, T.; Mendoza, P.; Pedrosa, J. M.; Sens. Actuators, B 2011, 156, 319. 4. Davies, R. F.; Johnston, G. A.; Clin. Dermatol.2011, 29, 311. 5. Pybus, D. H.; Sell, C. S.; The Chemistry of Fragrances, 2nd ed.;
Royal Society of Chemistry: Cambridge, 2006.
6. Poprawski, J.; Boilot, P.; Tetelin, F.; Sens. Actuators, B 2006,
116, 156.
7. Haddad, R.; Catharino, R. R.; Marques, L. A.; Eberlin, M. N.;
Rapid Commun. Mass Spectrom.2008, 22, 3362.
8. Chingin, K.; Gamez, G.; Chen, H.; Zhu, L.; Zenobi, R.; Rapid Commun. Mass Spectrom.2008, 22, 2009.
9. Véras, G.; Brito, A. L. B.; Silva, A. C.; Silva, P.; Costa, G. B.; Félix, L. C. N.; Fernandes, D. D. S.; Fontes, M. M.; Quim. Nova 2012, 35, 315.
10. Fernandes, D. D. S.; Gomes, A. A.; Fontes, M. M.; Costa, G. B.; Almeida, V. E.; Araújo, M. C. U.; Galvão, R. K. H.; Véras, G.;
J. Braz. Chem. Soc. 2014, 25, 169.
11. Contreras, U.; Barbosa-García, O.; Pichardo, J. L. M.; Ramos-Ortíz, G.; Maldonado, J. L.; Meneses-Nava, M. A.; Ornelas-Soto, N. E.; Lopes-Alba, P. L.; Food Res. Int.2012, 43, 2356. 12. Nascimento, J. A.; Dionísio, A. G. G.; Nascimento, E. C. L.;
Freitas, S. K. B.; Araújo, M. C. U.; Quim. Nova2010, 33, 351. 13. Urbano, M.; Castro, M. D. L.; Pérez, P. M.; Olmo, J. G.;
Gómez-Nieto, M. A.; Food Chem. 2006, 97, 166.
14. Boggia, R.; Casolino, M. C.; Hysenaj, V.; Oliveri, P.; Zunin, P.;
Food Chem.2013, 140, 735.
15. Barbosa-García, O.; Ramos-Ortíz, G.; Maldonado, J. L.; Pichardo-Molina, J. L.; Meneses-Nava, M. A; Landgrave, J. E. A.; Cervantes-Martínez, J.; Spectrochim. Acta, Part A 2007, 66, 129.
16. Souto, U. T. C. P.; Pontes; M. J. C.; Silva, E. C.; Galvão, R. K. H.; Araújo, M. C. U.; Sanches, F. A. C.; Cunha, F. A. S.; Oliveira, M. S. R.; Food Chem. 2010, 119, 368.
17. Giokas, D. L.; Thanasoulias, N. C.; Vlessidis, A. G.; J. Hazard. Mater.2011, 185, 86.
18. Silva, A. A.; Keukeleire, D.; Cardoso, D. R.; Franco, D. W.;
Anal. Methods 2012, 4, 642.
19. Brereton, R. G.; Chemometrics for Pattern Recognition, Wiley: Chichester, 2009.
20. Moreda-Piñeiro, A.; Fisher, A.; Hill, S. J.; J. Food Compos. Anal.2003, 16, 195.
21. The R Core Team; A Language and Environment for Statistical Computing, R Foundation for Statistical Computing, Vienna,
2013.
22. Yilma, A.; Nyberg, N. T.; Molgaard, P.; Asili, J.; Jaroszewski, J. W.; Metabolomics 2010, 4, 511.
Submitted: December 22, 2014