1
A Work Project, presented as part of the requirements for the Award of a Master Degree in Management from the NOVA – School of Business and Economics.
THE RELATIONSHIP BETWEEN LIQUIDITY AND
PROFITABILITY IN THE RETAIL INDUSTRY:
EVIDENCE FROM CHINESE LISTED FIRMS
FRANCISCO FERNANDES MOTA MORAIS
STUDENT ID: 24236
A Project carried out on the Master in Management Program, under the supervision of: Professor Leonor Ferreira
2
Abstract
This paper clarifies the relationship between liquidity and profitability, in the retail industry, resorting to evidence from Chinese listed firms. The study extends the literature by providing a new perspective that relates cash flows with firms’ returns. Similarities and differences between
store-based retailers and internet pure players are also addressed. According to the results, a
positive relationship between liquidity and profitability exists in the Chinese retail industry. Moreover, internet pure players present lower returns when compared to store-based retailers. Managers can, therefore, improve retail firms’ profitability through effective liquidity management, mainly acting via suppliers’ payment period and operating cash flows.
Keywords: Liquidity, Profitability, China, Retail.
1. Introduction
Liquidity has been widely discussed as a critical factor for firms to thrive. Nonetheless, by taking decisions on this matter, managers may be affecting the return firms can deliver, that is profitability. Eljelly (2004) studied the possible trade-off firms incur when choosing to hold a secure position in terms of liquid assets, rather than maximizing profitability. Since then, many authors have contributed to the existing literature on this subject. However, divergent results have been reached, as the authors evaluated the behavior of different industries, geographies, and proxies for the analysis. Literature about liquidity and profitability in the United States (US) and European retail industry is numerous. Notwithstanding, regarding emerging markets, and despite the increase in consumption in those geographies, information concerning this topic in the retail industry is not abundant. In the case of China, which is one of the most relevant markets in the world, ranking 1st until 2017 as the most urgent retail market to invest
3
worldwide1, few studies have been conducted about this relationship. Nonetheless, to the best
of our knowledge, they are limited to the banking industry, which has different characteristics from non-financial firms.
Thus, this Work Project aims at analyzing the liquidity-profitability relationship within Chinese firms operating in the retail industry. It adds to the current literature new insights on how managers may take decisions that can, ultimately, improve a firm’s economic condition.
The paper proceeds as follows. Section 2 presents the fundamental theoretical framework for both liquidity and profitability, while Section 3 overviews the retail industry, identifying its core characteristics, as well as the country profile for China. Section 4 reviews existing literature, both generic and specifically oriented to the retail industry, succeeded by Section 5 that presents the overall methodology for this study. Finally, Section 6 and Section 7 present the data analysis and findings. Section 8 provides the conclusions of this Work Project.
2. Theoretical Framework
Firms hold liquid assets, i.e., assets that easily convert into cash, in order to run its operations smoothly and meet current obligations. This provides a sense of security for the firm’s managers, shareholders, and creditors against future uncertainty. However, liquid components of the balance sheet normally offer a lower return to shareholders when compared to illiquid assets. This raises the question of whether companies are affecting their profitability by preserving liquidity. Therefore, two key concepts in this research are profitability and liquidity.
Profitability can be defined as the firm’s capability to yield a positive gain from its operations, by generating revenues that exceed the expenses. Various indicators can be considered as proxies when measuring profitability such as Net Operating Income (NOI) and
1 Source: The Global Retail Development Index, disclosed by AT Kearney every year. Accessible at
4
the ratios Earnings per share (EPS), Return on Equity (ROE), or Return on Assets (ROA), the last two being the most common for studies in this field. These variables evaluate how well management is administrating the capital provided by shareholders, although they provide different information. While EPS and ROE incorporate the financial leverage component and assess the firm’s capability to generate profits from shareholder’s investment, ROA focusses on the management’s efficiency to generate profits from existing assets.
Liquidity is commonly referred to as the firm’s capability to meet its current obligations timely. Liquidity management is crucial for managers that, ultimately, must hold the vital amount of cash to pay creditors, while avoiding retaining an unnecessary position in liquid assets that are captive to be allocated to operations or investments yielding a higher return (Eljelly, 2004). The question commonly posed is whether a firm’s cash holdings are enough, suboptimal, or excessive. On the one hand, liquidity can offer firms with financial flexibility and mitigate possible financial distress costs. When liquidity cushions do not exist, a firm may be unable to fund new opportunities or incur in considerable costs to raise external capital (Jensen, 1986). Beside this, in cyclical and seasonal industries, liquidity may provide firms with a better position in negotiations with suppliers or creditors when they face periods of economic downturn. Overall, firms can increase their profitability by enjoying superior liquidity. On the other hand, when firms are ‘swimming in cash’, agency costs may arise leading to inefficient use of funds. This normally translates into opportunistic managers (i.e. empire building) or the waste of resources by investing in projects with a negative value, which may result in a decline of firms’ profitability. Jensen (1986) argues that agency costs are more serious when firms achieve generous free cash flows. Monitor how managers succeed in balancing is a salient issue for stakeholders. They have at their disposal three perspectives. The first one assesses liquidity from a pure financial perspective, using information disclosed only in the balance sheet. The so-called static liquidity indicators, such as current ratio, quick ratio, and cash ratio have been
5
applied across several studies in this field (Eljelly, 2004; Sur & Chakraborty, 2011; Niresh, 2012; Demirgunes, 2016). Though they all provide insights into firms’ liquidity, their levels of conservatism differ. Current ratio considers all current assets to cover current liabilities, while quick ratio disregards the possibility of selling inventory, and cash ratio relies only on cash and cash equivalents to meet current obligations. Existing literature gives a substantial emphasis to the current ratio for liquidity analysis, nonetheless, traditional ratios have been criticized by offering a limited view of the firm’s liquidity. These indicators analyze liquidity from a liquidation perspective, as they assume that assets are tied to the day of the operation (Richard & Laughlin, 1980). Tibor and Veronika (2011) assert that static ratios overlook the ability to generate cash flows. To overcome these limitations, a second approach analyzes the firm’s Cash Conversion Cycle (CCC).
The CCC concept, introduced by Hager (1976), surmounts those limitations by considering both the time dimension and the flow of capital within the firm. Therefore, it provides an operating view rather than a purely financial one, resorting to information from the income statement. According to Schilling (1996), firms can achieve the optimal liquidity position by shortening the CCC to a level which will not affect the day-to-day operations, while retaining enough flexibility to support the firm’s future goals. By doing this, firms are reducing the investment in current assets and converting them into cash at an accelerated rhythm, which
ultimately will imply a higher liquidity. The CCC is the result of the equation CCC = DSO +
DIO – DPO, whose three main components are: (i) days sales outstanding (DSO), that account
for the number of days firms take to collect payments from their sales; (ii) days inventory outstanding (DIO), that considers the average period firms hold inventories in their warehouses/shelves; (iii) days payables outstanding (DPO), which showcases how much time firms take to pay to suppliers.
6
The third perspective, adopted in more recent studies, examines liquidity of firms by exploring data from the cash flow statements. This approach grants better insights into the real amount of cash generated by the firm over a given period. Atieh (2014) studied the differences of examining liquidity through the analysis of cash flow ratios rather than traditional ratios in the Pharmaceutical Sector in Jordan. Significant differences between them were actually found, as it was the case of information provided by the cash flow ratio when compared to current ratio. This is a relevant aspect since firms may be profitable but fall short on the adequacy of cash flows. One way of measuring this facet is through the quality of income that compares cash flows from operating activities to net income. Another one is to calculate the operating cash flow ratio in order to grasp whether or not cash flows from operations can cover current liabilities.
All the perspectives provide useful insights into a firm’s liquidity and profitability position. Nonetheless, uncovering the optimal stage of cash has a complex solution as firms hold different necessities regarding the industry where they operate, the size, the nature of its operations, among other factors. Hence, managers’ decisions on a firm’s liquidity may endanger or affect profitability.
3. Contextual Background
Retailing can be described as the sale of goods, new or used, to the final consumer excluding certain sales stemming from specialist retailers, as it is the case of motor vehicles, fuel, foodservice, rental and hire, or wholesale3. Retail is a broad concept that incorporates
several sub-categories, the most relevant ones being grocery retailers (focus on food, beverages, and tobacco as well as other everyday groceries) and non-grocery specialists (non-focused on groceries, but in apparel, consumer electronics, among others). Moreover, it is possible to
3Definitions for retailing, and the main groups within, according to Euromonitor International (2018). The concepts are
7
address retailing from two perspectives, organized/modern and unorganized/informal retailing. The former comprises retailers that are licensed and therefore pay taxes on sales and income, usually large companies, while the latter refers to traditional small stores, normally operated by locals and present in rural areas that do not hold a license to operate. Though unorganized retail can be observed in almost all countries, organized retailing dominates in terms of value. This is not the case of emerging economies like China where the contrary may be witnessed.
Although retail has been associated to physical presence through stores, recent shifts in consumer behavior, due to the tremendous possibilities brought by online commerce, triggered the need of conventional retailers to incorporate new channels in their business models. The fact that internet retailing is booming across the world, led also to the appearance of exclusively online-based companies, with different financial and operating characteristics. These businesses present a different stage of maturity and stability that cannot be disregarded. Thus two separate groups can be identified: store-based retailers (physical stores) and internet pure players (operations fully online).
Notwithstanding, all retail firms showcase specific financial characteristics and asset structure due to the role they play in a supply chain. To meet customer demands, retailers normally hold a big portion of inventory, which translates into a large proportion of current assets in the balance sheet when compared to fixed ones. Also, retail firms typically have a shorter CCC when compared to other industries (Uyar, 2009), and higher turnover ratios and
lower profitability when compared to manufacturing firms (Gombola & Ketz, 1983).
China’s retail market is the 2nd largest in the world, only surpassed by US’s, amounting to
$ 2,161,709 million in 20175. Since 2010, the market has been growing at a Compound Annual
Growth Rate (CAGR) of 10.10%, with all categories experiencing high levels of growth. However, the spotlight goes to non-store retailing. This category in China experienced a boom
5
Source: Euromonitor International, 2018. Market size, initially expressed in CYN, was converted to USD using the applicable exchange rate on 23rd November 2018 [CYN/USD = 0.1441].
8
in 2010, with annual sales value growing almost 300 per cent. Ever since, the market has been growing at a more modest pace, but still holds the position of being the largest internet retail market. Sales through this channel accounted, in 2017, for $ 440,995.5 million, reflecting 14% of total retail sales and 32% of worldwide internet sales, mirroring its relevance for the overall market. Notorious examples of two global giants and market leaders nowadays are Amazon (US) and Alibaba (China). Though they seem alike, they follow different business models (Biggs et al., 2017). Amazon operates as an online retailer, meaning it holds inventory and its focus is the consumer. On the other hand, Alibaba provides other retailers with virtual shopping malls (i.e. Tmall or Taobao) where they can connect directly with consumers without the need of owning its own platform. That being, JD.com (China), another prominent player, would be more comparable to Amazon in terms of business model, reflecting how diversified this category is in terms of firms’ business models.
Furthermore, albeit the development of the retail market in China has been forcing unorganized retail to drop, the market
remains dominated by this type of
retailing, with organized retailing
accounting for roughly 20% in 2015 (Flamind, 2015). Regarding organized retail, a high fragmentation, especially for store-based retailers, can be witnessed, as evidenced by the reduced market shares of top players in the market (table 1).
An imperative factor is that retailers’ performance depends on a country’s private consumption. People purchase more goods when economies are experiencing positive periods, represented by the growth of Gross Domestic Product (GDP). Also, increases in disposable income will lead people to consume more and that will, ultimately, generate more sales. Hence, macroeconomic variables cannot be neglected when analyzing the existence of a possible relationship between 2010 and 2017.
GBO Company Shares (FY 2017) TOP 20 firms
- Store-based Retailing 7.70%
- Internet Pure Players 78.10%
*Source:Euromonitor International 2018
9
China’s staggering economic performance is indubitable, with GDP rising 6.9% in 2017, well above the 4.8% average achieved by emerging markets and developing economies in the world7. Even though the country witnessed a slowdown from previous years, it is still considered to outpace other major economies in the world. According to Janet Henry, Global Chief Economist at HSBC Bank (2018), China will surpass the US becoming the largest economy in the world. Following this positive economic outlook, the retail industry in the country is also booming following the transitory state of the economy. For the past few years, China is slowly abandoning the idea of becoming the “world factory” to focus on consumption-driven growth (Matsangou, 2018). This shift is easily noticed with the reducing weight of the secondary sector contribution to GDP increase in the period 2010-2016 (57.4% to 37.4%) and the increasing worth of tertiary sector (39% to 58.2%)9. Implications can be seen in better wages and consumption.
That being, retail firms show unique characteristics, such as shorter CCC, that may influence the relationship between liquidity and profitability. Also, China is a relevant emerging market that seems to be witnessing new disruptive trends for retailers that should be further analyzed.
4. Literature Review
Prevailing literature regarding the relationship between liquidity and profitability is extensive, with authors studying different industries, geographies, and variables. However, findings are not consensual. The relevant literature can be analyzed from three major angles: (i) proxies chosen to represent both liquidity and profitability; (ii) geographies studied; and (iii) sectors or industries analyzed. This section emphasizes empirical studies made in Asia, targeting insights about retail, when available.
7 Source: World Bank Group. Retrieved from www.worldbank.org/
10
Whereas early studies in the field reinforce the primacy of traditional liquidity ratios, more recent research offers a view with a focus in CCC, and its components, as indicators for the analysis. Although liquidity ratios (the current ratio being the most extensively studied one) have been proved by previous researchers as being linked to profitability, contradictory results have been achieved. As expected according to the theory efficient liquidity management implies higher profitability, Eljelly (2004) found a negative relationship between current ratio and profitability in a sample of joint stock companies in Saudi Arabia. The study also concluded that the impact in profitability varies according to the level of liquidity. The same relation was revealed for the short-run, by Pimentel, Braga, and Nova (2005) for Brazilian retail firms, but no relation was found when studying the medium/long-run. Still, a significant positive relation between the firm's profitability and its liquidity level is present in some cases such as the Turkish retail industry (Demirgünes, 2016). Despite this results, the existence of a significant relationship between the current ratio and profitability was not confirmed in the Indian
pharmaceutical industry (Sur & Chakraborty, 2011) norin manufacturing firms from Sir Lanka
(Niresh, 2012).
Under the dynamic perspective, the CCC approach, non-consensual results were also achieved. Deloof (2003) found a significant and negative relationship between CCC, and each of its components, with firms’ profitability. Similar results were achieved by Sharma and Kumar (2011) for Indian non-financial firms, except for DSO and CCC where a positive linkage with profitability was witnessed. Sola (2014), who studied the Spanish SMEs, also found a positive linear relationship between the investment in account receivables and profitability. The explanation was that the positive aspects of conceding credit to customers surpass the associated costs to vendor financing. Nonetheless, other cases of industries and countries analyzed present different perspectives of this relationship, such as Padachi (2006) that only found a negative significant correlation between ROA and DSO, or Muralidhara and Shollapur (2016) that failed
11
to find any significant relation between liquidity measures and profitability in Indian retail firms.
Thus, according to existing literature, despite the liquidity-profitability relationship has been proven to exist in some cases, however divergent and contradictory results were found regarding the direction of this relationship across different geographies and industries. Moreover, to the best of our knowledge, no profound studies were made in China regarding retail firms, thus motivating the study of the relationship between liquidity and profitability in this country, and specific industry, given its relevance in size and specificities, as overviewed in section 3.
5. Methodology and Sample
This Work Project investigates the existence of a relationship between liquidity and profitability of retail firms in China. Bearing previous studies to analyze the relationship between liquidity and profitability, this section introduces the variables, hypothesis, and the model outlined for this research.
Variables
As aforementioned, in section 4, existing literature provides a myriad of proxies to measure both liquidity and profitability. For this study, profitability, more specifically ROA, is set as the dependent variable.
ROA is preferred over variables selected by others such as NOI (Eljelly, 2004; Ray, 2012) or ROE (Niresh, 2012) since it is less susceptible to financial tampering that may twist the essence of the analyzed relationship and acknowledges the necessary asset base to run operations. Other authors also elected ROA in their studies (Sharma & Kumar, 2011; Sola,
2014; Demirgünes, 2016; Muralidhara & Shollapur, 2016).The use of ratios allows to compare
12
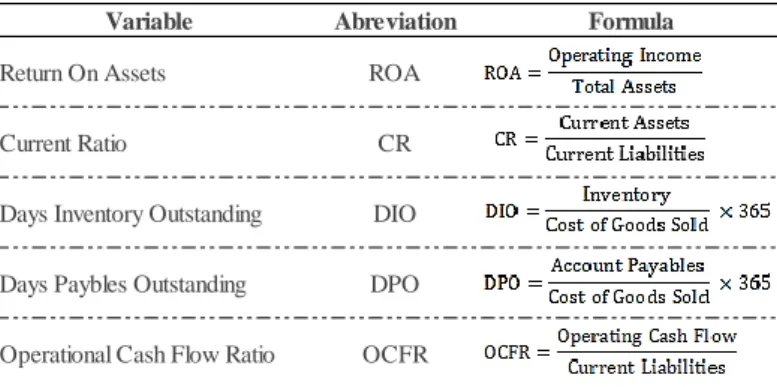
Regarding independent variables in this study, measures of liquidity, four proxies are employed in order to assess the different views on liquidity measurement: Current ratio (CR), a static liquidity ratio, considering its status as the most widely selected liquidity ratio for this type of studies; Days inventory outstanding (DIO); Days payable outstanding (DPO), that follow a dynamic view of liquidity, since they normally represent a higher weight for the CCC in this specific industry10; and Operating cash flow ratio (OCFR), incorporating a more modern view of liquidity measure, since, to our knowledge, no study has directly linked this variable to firms’ profitability. Table 2 presents the framework with the different variables, how they are calculated in this Work Project.
Table 2 – Variables Framework
Considering the exposure the retail sector has to the macroeconomic environment, and the existence of other important factors that can explain profitability besides liquidity, the models of research incorporate control variables. Taking in consideration the literature reviewed in section 4, the following three control variables were chosen: Firm size (SIZE), represented by the natural logarithm of total assets, Leverage (LEV), calculated by the ratio of total liabilities over total assets, and Economic growth (E.GR), measured by Chinese GDP growth rates. These variables were chosen based on their prevalence and significance in previous studies (Sharma & Kumar, 2011; Sola, 2014; Muralidhara & Shollapur, 2016).
10This study focus on the components of CCC rather than the CCC itself. DSO is not analyzed due to its reduced weight in
CCC. Since retail customers tend to pay immediately, the value of DSO is close to zero.
Variable Abreviation Formula
Return On Assets ROA
Current Ratio CR
Days Inventory Outstanding DIO
Days Paybles Outstanding DPO
13
Additionally, two dummy variables were added to the analysis in order to capture part of the variability of the dependent variable that may be justified by the different business models of retail firms: Business models (BM) and Higher liquidity (HL). The former variable, being a qualitative fact, it will assume the value of 1 for internet pure players, and 0 for store-based retailers. Regarding the latter, for firms that present a higher liquidity, the variable will assume the value of 1 for firms that hold liquidity above the median for each proxy, and 0 for the remaining.
Although this study focuses on clarifying the relationship between liquidity and profitability, it also tests how this relation may differ when using alternative liquidity measures. With this in mind, the following hypotheses can be drawn:
Hypotheses
HYPOTHESIS 1
H0: No relationship between current ratio and profitability can be established in Chinese
retail firms.
H1: A relationship between current ratio and profitability can be established in Chinese
retail firms. HYPOTHESIS 2
H0: No relationship between days inventory outstanding and profitability can be established
in Chinese retail firms.
H1: A relationship between days inventory outstanding and profitability can be established
in Chinese retail firms. HYPOTHESIS 3
H0: No relationship between days payables outstanding and profitability can be established
in Chinese retail firms.
H1: A relationship between days payables outstanding and profitability can be established
in Chinese retail firms. HYPOTHESIS 4
H0: No relationship between operating cash flow ratio and profitability can be established
in Chinese retail firms.
H1: A relationship between operating cash flow ratio and profitability can be established in
14
The Model
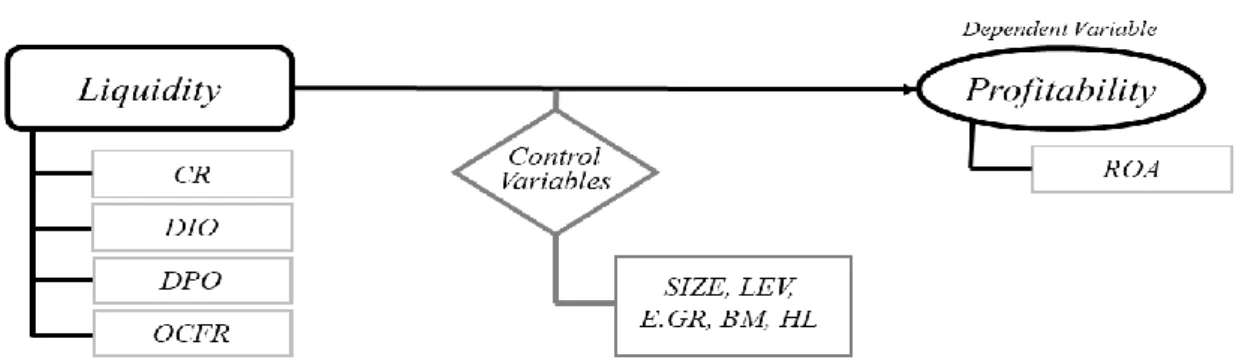
To analyze the relationship between liquidity and profitability, the ordinary least square (OLS) method was elected, in line with other studies (Deloof, 2003; Sharma & Kumar, 2011; Sola, 2014; Muralidhara & Shollapur, 2016). The regression equations used to derive the coefficients’ estimates for the impact of each proxy of liquidity in profitability for the overall sample are based on the research model presented in figure 1.
Figure 1 – Research Model
Four distinct regressions will be made for the retail market, and simultaneously for the store-based retailers, to ascertain that they hold, considering the relevance for the market.
ROAit = b0 + (b1 + b2 HL) × CRit + b3 SIZEit + b4 LEVit + b5 E.GRt + b6 BM + eit (MODEL 1)
ROAit = b0 + (b1 + b2 HL) × DIOit + b3 SIZEit + b4 LEVit + b5 E.GRt + b6 BM + eit (MODEL 2)
ROAit = b0 + (b1 + b2 HL) × DPOit + b3 SIZEit + b4 LEVit + b5 E.GRt + b6 BM + eit (MODEL 3)
ROAit = b0 + (b1 + b2 HL) × OCFRit + b3 SIZEit + b4 LEVit + b5 E.GRt + b6 BM + eit (MODEL 4)
where, b0 representsthe intercept value, which incorporates the effect of other variables that
account for the variability of ROA but are not explicit in the model, it refers to the pair firm-year observations, and eit to the errors.
Sample
The period of analysis was chosen with the pretension to consider, since the beginning (2010), the rise in worth of internet pure players for retail sales until the most recent year with
15
available data (2017). Also, these firms only represent part of organized retail, the unique with available data.
Data were retrieved from firms’ consolidated financial statements that were previously collected from the Bloomberg platform. Qualified firms had to meet the following criteria: (i) be listed in one of the three Chinese Indexes: Shanghai Stock Exchange Composite Index,
Shenzhen Stock Exchange Composite Index, Hong Kong Hang Seng Index. In light of the recent escape of Chinese firms to US-based indexes in search for more liquid markets and visibility, especially firms where online represents a vital part of the business, retailers that operate in China, but are listed in NASDAQ Composite Index or NYSE Composite Index, were considered11;
(ii) be initially established in China and the majority of sales stream are from China12;
(iii) be a retail company, according to according to Bloomberg definitions (Food & Drug Stores, Electronic & Appliances Stores, Department Stores, E-commerce Discretionary)13.
This sampling design is named convenience sampling, since data is collected from elements of the population based on specific criteria defined before. It facilitates the collection of data due to availability (Sekaran & Bourgie, 2013).
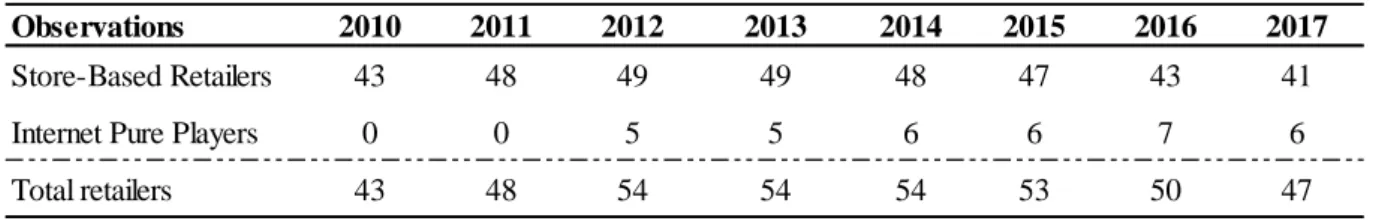
The firms gathered to compose the initial sample amount to 63, accounting for 476 observations in the analyzed time frame (2010-2017). The initial sample was filtered by eliminating extreme outliers (66 obs.) and anomalies in the data (i.e. missing full data – 7 obs.) in order to provide more accurate results. This resulted in a sample comprising 403 firm-year observations representing 58 firms, of which seven are internet pure players. Firms’ names are provided in appendix 1. The distribution of observations in the sample per year and by type of retailing is presented in table 3.
11This criterion derives from the fact that, in most cases, only listed companies disclose financial information. 12 The restriction aims to isolate Chinese firms from multinationals that can distort the analysis.
13 The objective is to isolate the retail industry that has unique characteristics from others. Apparel specialists were excluded
in order to minimize the possible bias since the majority of these firms are also responsible for the design, manufacturing, and distribution stages.
16
Table 3 – Observations per year by type of retailing
6. Data Analysis
Descriptive statistics for all variables selected for this study are presented in table 4. The mean, median, standard deviation, maximum and minimum, and variation coefficient were computed for the overall sample.
Table 4 – Chinese Retail Firms Descriptive Statistics
From table 4, it is possible to see that firms in the sample accomplished to have an average ROA of five per cent. The coefficient of variation of ROA is relatively high, considering that firms returns range from a minimum of -29.4% to 22.7%. The average CR is slightly above one (1.069), which is considered to be a good liquidity position for firms. Firms hold, on average, inventory for almost 40 days and pay to suppliers within 56 days, which together with the shortage of account receivables for the majority of firms (average DSO is three days), places them in a privileged position in terms of liquidity (average CCC is negative, minus 13.5 days). OCFR presents the highest variation coefficient (111%) and has an average of 0.150. Regarding size and leverage, the sample holds a low dispersion, with each unit of investment being financed, on average, around 2/3 by creditors.
Observations 2010 2011 2012 2013 2014 2015 2016 2017
Store-Based Retailers 43 48 49 49 48 47 43 41
Internet Pure Players 0 0 5 5 6 6 7 6
Total retailers 43 48 54 54 54 53 50 47
Variable Obs. Median Mean St. Dev Variation Coef. Max Min
ROA 403 0.055 0.048 0.051 106% 0.227 -0.294 CR 403 0.999 1.069 0.571 53% 4.546 0.109 DIO 403 39.769 46.629 36.670 79% 193.887 0.000 DPO 403 55.869 63.062 29.307 46% 171.011 0.000 OCFR 403 0.139 0.150 0.166 111% 1.109 -0.415 SIZE 403 2.892 2.937 0.533 18% 4.867 1.600 LEV 403 0.592 0.592 0.173 29% 1.495 0.181 E.GR 403 0.073 0.079 0.013 16% 0.106 0.067
17
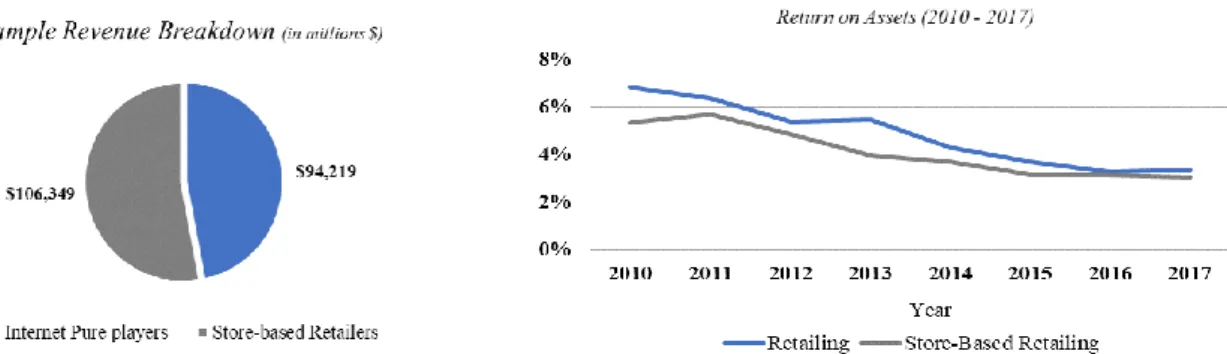
Chart 1, introduced below, displays the revenue breakdown for the analyzed sample, highlighting the similar proportions of store-based and internet pure-players in the sample. Chart 2 shows the evolution of the dependent variable (ROA) over the years of analysis. The returns on assets for the retail industry have been steadily decreasing over the years, until 2017 when firms witnessed a small recovery. Industry returns and store-based retailer’s ROA have reduced the gap between the two, showcasing the convergence of both sub-groups of retailing. Chart 1 – Sample Revenue Breakdown (2017) Chart 2 – Return on Assets (2010 - 2017)
In order to assess if and how the variables selected for this Work Project are related, and the strength of the relation, the Pearson's correlation coefficients were estimated for both retail in general, but also separately for store-based retailers. The two values are presented to see the impact, if any, of internet pure players in the overall industry. These coefficients are presented in table 5 which contains the computed correlation matrix.
Table 5 – Correlation Matrix
When analyzing the coefficients, ROA is positively correlated with CR and OCFR, the latter presenting the highest coefficient, while DIO and DPO present negative correlations. This
ROA CR DIO DPO OCFR SIZE LEV E.GR
ROA 1 -0.197** -0.019** -0.180** -0.522** -0.128** -0.267** -0.254** CR -0.035** 1 -0.070** -0.182** -0.237** -0.031** -0.610** -0.033** DIO -0.057** -0.010** 1 -0.079** -0.252** -0.059** -0.126** -0.017** DPO -0.173** -0.183** -0.013** 1 -0.096** -0.135** -0.122** -0.006** OCFR -0.521** -0.220** -0.232** -0.023** 1 -0.147** -0.292** -0.312** SIZE -0.014** -0.092** -0.027** -0.169** -0.078** 1 -0.160** -0.196** LEV -0.357** -0.450** -0.105** -0.168** -0.282** -0.112** 1 -0.059** E.GR -0.139** -0.066** -0.053** -0.017** -0.201** -0.230** -0.058** 1 Source: SPSS Output [* Significant at p-value=0.01; ** Significant at p-value=0.05] Correlation matrix comprises the correlation coefficients for both retailing (below main diagonal) and store-based retailing (above main diagonal).
18
means that higher current and operating cash flow ratios, paying quicker to suppliers, and holding inventory for shorter time will implicate higher profitability for firms. Nonetheless, regarding liquidity measures, only DPO, and OCFR are significantly correlated with ROA.
Control variables such as the firm’s size and economic growth are positively correlated with ROA, for retailing, while leverage showcases a negative relation, the last two at a significant level. Correlations amid independent variables can be seen, with some cases presenting doubts concerning existence of multicollinearity. To address this issue, a test of multicollinearity, the variance inflation factor (VIF) (Gujarati & Sangeetha, 2008, apud Sreejesh, Mohapatra, & Anusree, 2014), is applied to all models when running the regressions.
For this analysis, the highest value achieved was 3.479, which manifests no concerns16. With
respect to differences between correlations, for liquidity measures among retail and store-based retail, only CR poses changes in terms of significance.
7. Findings
Relationship between current ratio and profitability (MODEL 1)
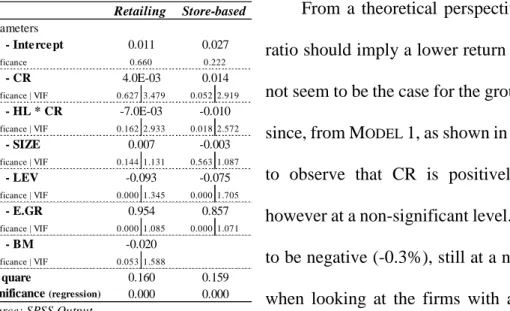
Table 6 - MODEL 1
From a theoretical perspective, a higher current ratio should imply a lower return for firms. This does not seem to be the case for the group of firms analyzed since, from MODEL 1, as shown in table 6, it is possible
to observe that CR is positively related to ROA, however at a non-significant level. The effect turns out to be negative (-0.3%), still at a non-significant level, when looking at the firms with a higher CR. Albeit
16 Based on a rule of thumb, a value superior to 10 expresses the presence of multicollinearity leading to the
exclusion of that(those) variable(s) from the model. Parameters - Intercept significance - CR significance | VIF 0.627 3.479 0.052 2.919 - HL * CR significance | VIF 0.162 2.933 0.018 2.572 - SIZE significance | VIF 0.144 1.131 0.563 1.087 - LEV significance | VIF 0.000 1.345 0.000 1.705 - E.GR significance | VIF 0.000 1.085 0.000 1.071 - BM significance | VIF 0.053 1.588 R-square Significance (regression) Source: SPSS Output 0.160 0.159 0.000 0.000 -0.093 -0.075 0.954 0.857 -0.020 4.0E-03 0.014 -7.0E-03 -0.010 0.007 -0.003 Retailing Store-based 0.011 0.027 0.660 0.222
19
non-significant, these results are in concordance with those of other studies that also failed to find a relation between liquidity and profitability (Sur & Chakraborty, 2011; Niresh, 2012) and in some way with Demirgünes (2016) who found a significant and positive relation between the two variables for the Turkish retail industry. By contrast, they oppose to basic corporate finance theory and findings of Eljelly (2004) and Pimentel, Braga and Nova (2005) that found a significant negative relationship between liquidity, proxied by the current ration, and profitability. When MODEL 1 is applied separately for store-based retailers, the coefficient
increases, but remains non-significant. Thus, the alternative hypothesis is rejected, and H0= No
relationship between current ratio and profitability can be established in Chinese retail firms is accepted.
Relationship between inventory days outstanding and profitability (MODEL 2)
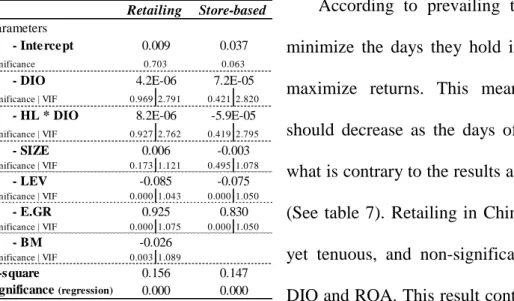
Table 7 - MODEL 2
According to prevailing theory, firms should minimize the days they hold inventory in order to maximize returns. This means that profitability should decrease as the days of inventory increase, what is contrary to the results achieved by MODEL 2
(See table 7). Retailing in China reveals a positive, yet tenuous, and non-significant, relation between DIO and ROA. This result contradict Deloof (2003) and Sharma and Kumar (2011) that found a significant negative relationship between inventory days and ROA. However, similar findings were witnessed by Padachi (2006) or when Muralidhara and Shollapur (2016) analyzed the Indian retail industry. A study conducted to retail in China, points out as major challenges for store-based retailers both demand fluctuations and inadequate forecasting. In such manner, one explanation might be that by holding inventory for more days, retailers are more prepared to meet customer demands timely. Also, different
Parameters - Intercept significance - DIO significance | VIF 0.969 2.791 0.421 2.820 - HL * DIO significance | VIF 0.927 2.762 0.419 2.795 - SIZE significance | VIF 0.173 1.121 0.495 1.078 - LEV significance | VIF 0.000 1.043 0.000 1.050 - E.GR significance | VIF 0.000 1.075 0.000 1.050 - BM significance | VIF 0.003 1.089 R-square Significance (regression) Source: SPSS Output -0.075 0.830 0.147 0.000 0.037 0.063 7.2E-05 -5.9E-05 -0.003 0.009 4.2E-06 0.703 0.006 0.156 0.000 -0.085 0.925 Retailing Store-based -0.026 8.2E-06
20
standards adopted in financial reporting in the Chinese retail firms analyzed, either IFRS / IAS, USGAAP or domestic accounting standards can explain diversity in the results and limits comparability. The information collected to the study is unswervingly impacted by firms’ inventory measurement cost flows assumptions, such as the FIFO, LIFO or Weighted Average Cost flows. When running the models for store-based retailers only, the liquidity and profitability relation remains non-significant. Yet, H1 is rejected and the null hypothesis is
accepted, H0= No relationship between days inventory outstanding and profitability can be
established in Chinese retail firms.
Relationship between days payables outstanding and profitability (MODEL 3)
Table 8 - MODEL 3
Liquidity, measured by DPO, presents a negative, however weak, relationship with ROA. One can infer that by extending the trade credit received by suppliers by one day, firms will reduce its profitability by 0.46%. These results are in line with Dellof (2003), Padachi (2006) and Sharma and Kumar (2011). Arguments that support this result are the fact that less profitable firms tend to delay its payments to suppliers (Dellof, 2003) since lower profitability normally implies a lower level of cash being generated which normally translates in firms delaying payments (Padachi, 2006). However, these justifications put, in some way, DPO as a consequence of profitability, rather than the opposite. Therefore, an alternative explanation may be the benefits firms are wasting when paying suppliers earlier such as discounts. Still, delaying payments in order to improve cash flows may deteriorate the relationship with suppliers which may engender inefficiencies at the operating side impacting profitability negatively (Deloitte, n.d.). The dummy variable for firms that have a higher payment period is positive and significant, meaning that extending this
Parameters - Inte rce pt significance - DPO significance | VIF 0.000 2.638 0.022 2.875 - HL * DPO significance | VIF 0.014 2.581 0.621 2.885 - SIZE significance | VIF 0.401 1.163 0.267 1.109 - LEV significance | VIF 0.000 1.078 0.000 1.062 - E.GR significance | VIF 0.000 1.077 0.000 1.052 - BM significance | VIF 0.001 1.083 R-square Significance (regression) Source: SPSS Output 0.000 0.000 0.910 0.807 -0.028 0.182 0.169 2.0E-04 3.6E-05 0.004 -0.005 -0.079 -0.069 0.035 0.057 0.147 0.005 -4.6E-04 2.7E-04 Retailing Store-based
21
period for these firms would still have a negative impact on profitability, but at a lower level (- 0.26%). One explanation may be that firms with high values of DPO are no longer receiving discounts or hold stable relations with suppliers and so, extending the period for one more day will only mean more cash available for other purposes. Conversely, for store-based retailers, this analysis changes with DPO presenting a positive and significant relation with profitability. This may derive from the fact that the average payment period for this group is higher (+10 days), and so, the second explanation presented before applies. Hence, the null hypothesis is rejected and the alternative one is accepted, H1= A relationship between days payable
outstanding and profitability can be established in Chinese retail firms, meaning managers can improve retail firms’ profitability by efficiently managing its payables.
Relationship between operating cash flow ratio and profitability (MODEL 4)
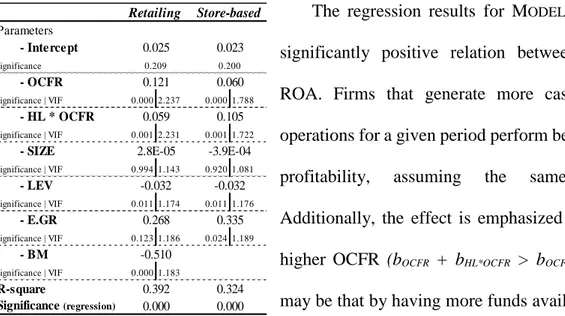
Table 9 - MODEL 4
The regression results for MODEL 4 showcase a
significantly positive relation between OCFR and ROA. Firms that generate more cash flows from operations for a given period perform better in terms of
profitability, assuming the same obligations.
Additionally, the effect is emphasized for firms with higher OCFR (bOCFR + bHL*OCFR > bOCFR). One reason
may be that by having more funds available, firms can invest in opportunities as they come without having to incur in extra costs when raising external capital. MODEL 4, compared with the others, is the one that shows the highest R-square (39.2%)
for retail in general, meaning it is capable of explaining more the variance in retail firms’ profitability. Interestingly, the dummy Business Model holds a considerably negative coefficient bearing the lower returns of internet pure players. Overall, the research recommends to managers they can boost firms’ profitability by efficiently managing firm’s cash flows in
Parameters - Intercept significance - OCFR significance | VIF 0.000 2.237 0.000 1.788 - HL * OCFR significance | VIF 0.001 2.231 0.001 1.722 - SIZE significance | VIF 0.994 1.143 0.920 1.081 - LEV significance | VIF 0.011 1.174 0.011 1.176 - E.GR significance | VIF 0.123 1.186 0.024 1.189 - BM significance | VIF 0.000 1.183 R-square Significance (regression) Source: SPSS Output -0.510 0.392 0.324 0.000 0.000 2.8E-05 -3.9E-04 -0.032 -0.032 0.268 0.335 0.209 0.200 0.121 0.060 0.059 0.105 Retailing Store-based 0.025 0.023
22
order to increase OCFR. This fact may derive from the better conditions of credit and investment or how the firm can take advantage of opportunities by having available funds. The
alternative hypothesis is accepted, H1= A relationship between operating cash flow ratio and
profitability can be established in Chinese retail firms.
Regarding control variables that are common to all models, leverage and economic growth are in MODELS 1, 2 and 3 related to profitability at a statistically significant level (only MODEL
4 presents a different result). LEV has a negative relation, coherent with the theory respecting the agency costs of debt. That said, managers should ponder the negative implications of resorting to external capital. On the other hand, E.GR presents a positive one, with a considerably high coefficient in most cases, matching the predictions that a positive economic outlook implies superior profitability for firms. These results are coherent with previous studies (Sola, 2014; Muralidhara & Shollapur, 2016). Firm’s size, contrary to other studies, is a non-significant variable in the models tested. This result may suggest that because only the biggest firms were chosen for the analysis, therefore, a reduced variation is present in the sample, evidenced by the small variation coefficient (18%). Intercept values that absorb the effect of variables external to the model were non-significant, with the exception for MODEL 3 when
tested for store-based retailers (5.7%) meaning that a significant part of ROA is being explicated by other variables, together with days payable outstanding.
8. Conclusions
The purpose of this Work Project was to clarify the relationship between liquidity and profitability in the retail industry with evidence from listed retail firms in China. This study addresses to managers, namely how they can effectively improve firms’ profitability through liquidity management in the retail industry, which normally presents negative cash conversion cycles and lower returns when compared to manufacturing.
23
China’s retail market is the 2nd largest in the world, with all categories experiencing high
levels of growth. Though the spotlight goes to internet pure players, store-based retail still dominates in terms of value. The declining average returns, are the motivation to investigate whether this can be caused by managers choices regarding liquidity.
The outcomes display a significant relationship between liquidity and profitability for two
of the analyzed liquidity measures, namely days payables outstanding (MODEL 3) and operating
cash flow ratio (MODEL 4). The payment period to suppliers is significantly and negatively
related to profitability. Retailers should not extend the period between orders and payments to suppliers, since they may abdicate of discounts or deteriorate commercial relationships. Managers should aim for friendly relationships with suppliers to attain enhanced-term contracts and propose early payments if discounts are granted.
Regarding operating cash flow ratio (MODEL 4), a significant and positive correlation was
identified. By having more funds available, retailers can invest in opportunities as they come without having to incur in extra costs to raise external capital. Therefore, managers can increase retailer’s returns through efficient liquidity management.
Additionally, differences were found between the two groups of retailers, store-based retailers and internet pure players. The dummy variable Business Model is significant in all cases, penalizing internet pure players, which according to tested models have a lower return on assets.
Though this study extends existing literature by providing new insight into the relationship between liquidity and profitability in the Chinese retail industry, it has some limitations. Firstly, one can identify the disparity between the numbers of observations in the two groups of retailing firms. Data for internet pure players is reduced due to the smaller number of firms publicly listed, as they only recently started to release financial data, and additionally the fact that most of them have obtained negative returns across the analyzed period. Secondly, some store-based
24
retailers are also investing in online platforms, and some internet players are entering the offline market, which raises difficulties in the separation of firms in these two categories. Thirdly, the study does not make a distinction between firms in terms of the accounting standards they have adopted when preparing the financial statements. Fourthly, the study was conducted only for retailers operating in China, excluding, therefore, foreign firms.
For future research authors may mitigate some of these limitations, by further analyzing the similarities and differences between the two groups of firms in the retail industry, when more fundamental data is available or test the effects of accounting standards in the relationship between liquidity and profitability.
9. References
Almeida, Rui. 2016. “The relationship between liquidity and profitability in the Food & Beverage industry: Evidence from Europe and United States”. Nova School of Business and Economics. https://run.unl.pt/handle/10362/17236
Atieh, Sulayman. 2014.“Liquidity Analysis Using Cash Flow Ratios as Compared to Traditional Ratios in the Pharmaceutical Sector in Jordan”. International Journal of Financial Research, 5(3): 146-158. Biggs, Chris, Chande, Amee, Matthews, Erica, Mercier, Pierre, Wang, Angela, and Zou, Linda. 2017. “What China Reveals About The Future Of Shopping”. Accessed on 25/11/2018. Retrieved from https://www.bcg.com/publications/2017/retail-globalization-china-reveals-future-shopping.aspx. Deloitte. n.d. “Strategies for Optimizing your Accounts Payable Report”. Accessed on 10/12/2018. Retrieved from https://www2.deloitte.com/content/dam/Deloitte/ca/Documents/finance/ca-en-FA-strategies-for-optimizing-your-accounts-payable.pdf
Deloof, Marc. 2003. “Does Working Capital Management Affect Profitability of Belgian Firms?”
Journal of Business Finance Accounting, 30(3-4): 573-588.
Demirgünes, Kartal. 2016. “The Effect of Liquidity on Financial Performance: Evidence from Turkish Retail Industry”. International Journal of Economics and Finance, 8(4): 63-79.
Eljelly, Abuzar M. 2004. “Liquidity ‐ profitability Tradeoff: An Empirical Investigation in an Emerging Market”. International Journal of Commerce and Management, 14(2): 48-61.
Euromonitor International. 2018. “Retailing in China: January 2018”. Retrieved from Passport
database. http://www.portal.euromonitor.com.
Flamind, Vlad. 2015. “Why India’s e-retail Market is Set to Boom Like China’s”. [LinkedIn article] Accessed on 15/10/2018. Retrived from www.linkedin.com/pulse/indias-e-retail-market-boom-like-chinas-vlad-flamind? articleId=6027327988117360640
Gombola, Michael, and Ketz, J. 1983. “Financial Ratio Patterns in Retail and Manufacturing Organizations”. Financial Management (1972), 12(2): 45-56.
25 Jensen, Michael C. 1986. “Agency Costs of Free Cash Flow, Corporate Finance, and Takeovers”. The
American Economic Review, 76(2): 323-329.
Matsangou, Elizabeth. 2018. “China’s Transitioning Economy”. Accessed on 21/09/2018. Retrieved from https://www.worldfinance.com/markets/chinas-transitioning-economy
Muralidhara, and Shollapur, M. R. 2016. “Effect of Working Capital Management on Firm’s Profitability: Evidence from Selected Indian Retail Firms”. Finance India, 30(4): 1251-1263.
Niresh, J. Aloy. 2012. “Trade-off Between Liquidity & Profitability: A Study of Selected Manufacturing Firms in Sri Lanka”. Journal of Arts, Science & Commerce, 3(4): 34-40.
Padachi, Kesseven. 2006. “Trends in Working Capital Management and its Impact on Firms' Performance: An Analysis of Mauritian Small Manufacturing Firms”. International Review of Business
Research Papers, 2(2): 45-58.
Pimentel, Renê, Braga, Roberto, and Nova, Silvia. 2005. “Interação entre Rentabilidade e Liquidez: Um estudo exploratório”. Revista de Contabilidade do Mestrado em Ciências Contábeis da UERJ,
10(2): 83-97.
Ray, Sarbapriya. 2012. “Evaluating the Impact of Working Capital Management Components on Corporate Profitability: Evidence from Indian Manufacturing Firms”. International Journal of
Economic Practices and Theories, 2(3): 127-136.
Richards, Verlyn D., and Laughlin, Eugene J. 1980. “A Cash Conversion Cycle Approach to Liquidity Analysis”. Financial Management, 9(1): 32-38.
Schilling, George. 1996. “Working Capital's Role in Maintaining Corporate Liquidity”. TMA
Journal,16(5): 4-7.
Sekaran, Uma. 2013. Research Methods for Business: A Skill-Building Approach. Chichester. West Sussex: Wiley.
Sharma, A., and Kumar, Satish. 2011. “Effect of Working Capital Management on Firm Profitability”. Global Business Review, 12(1): 159-173.
Sola, Cristina M. 2014. “Short-Term Financial Management and Firm Value”. University of Murcia.
https://www.tdx.cat/handle/10803/133833
Sreejesh, S., Mohapatra, Sanjay, and Anusree, M. R. 2014. Business Research Methods: An Applied
Orientation. Cham: Springer.
Sur, Debasish, and Chakraborty, Kaushik. 2011. “Evaluating Relationship of Working Capital and Profitability: A Study of Selected Multinational Companies in the Indian Pharmaceutical Sector”. IUP
Journal of Management Research, 10(2): 7–22.
Tibor, Tarnóczi, and Veronika, Fenyves. 2011. “Liquidity Management and Corporate Risk”. Annals
of Faculty of Economics, 1(1): 530-536.
Uyar, Ali. 2009. “The Relationship of Cash Conversion Cycle with Firm Size and Profitability: An Empirical Investigation in Turkey”. International Research Journal of Finance and Economics, (24):
26
Appendix 1 – Sample composition
Name of company Index Classification Type of Retailing Alibaba Group Holding Ltd NYSE Composite Index E-commerce Discretionary Internet Pure Player Anhui Andeli Department Store Co Ltd Shanghai Stock Exchange Composite Index Department Stores Store-Based Beijing Capital Retailing Group Co Ltd Shanghai Stock Exchange Composite Index Department Stores Store-Based Beijing Cuiwei Tower Co Ltd Shanghai Stock Exchange Composite Index Department Stores Store-Based Beijing Urban-Rural Commercial Group Co Ltd Shanghai Stock Exchange Composite Index Department Stores Store-Based BeijingHualian Hypermarket Co Ltd Shanghai Stock Exchange Composite Index Food & Drug Stores Store-Based Better Life Commercial Chain Share Co Ltd Shenzhen Stock Exchange Composite Index Food & Drug Stores Store-Based CCOOP Group Co Ltd Shenzhen Stock Exchange Composite Index Department Stores Store-Based Changchun Eurasia Group Co Ltd Shanghai Stock Exchange Composite Index Department Stores Store-Based Changsha Tongcheng Holdings Co Ltd Shenzhen Stock Exchange Composite Index Department Stores Store-Based Chengdu Hongqi Chain Co Ltd Shenzhen Stock Exchange Composite Index Food & Drug Stores Store-Based China Shun Ke Long Holdings Ltd Hong Kong Hang Seng Index Food & Drug Stores Store-Based Chongqing Department Store Co Ltd Shanghai Stock Exchange Composite Index Department Stores Store-Based Cogobuy Group Hang Seng Composite Information Techonology Index E-commerce Discretionary Internet Pure Player Dashang Co Ltd Shanghai Stock Exchange Composite Index Department Stores Store-Based Gansu Guofang Industry & Trade Group Co Ltd Shanghai Stock Exchange Composite Index Department Stores Store-Based GOME Retail Holdings Ltd Hong Kong Hang Seng Index Consumer Elec & Applc Stores Store-Based Guangzhou Grandbuy Co Ltd Shenzhen Stock Exchange Composite Index Department Stores Store-Based Hangzhou Jiebai Group Co Ltd Shanghai Stock Exchange Composite Index Department Stores Store-Based Hefei Department Store Group Co Ltd Shenzhen Stock Exchange Composite Index Department Stores Store-Based Hunan Friendship & Apollo Commercial Co Ltd Shenzhen Stock Exchange Composite Index Department Stores Store-Based
JD.com Inc NASDAQ Composite Index E-commerce Discretionary Internet Pure Player
Jiahua Stores Holdings Ltd Hong Kong Hang Seng Index Department Stores Store-Based Jiajiayue Group Co Ltd Shanghai Stock Exchange Composite Index Food & Drug Stores Store-Based Jumei International Holding Ltd NYSE Composite Index E-commerce Discretionary Non-Store Lanzhou Minbai Shareholding Group Co Ltd Shanghai Stock Exchange Composite Index Department Stores Store-Based Lianhua Supermarket Holdings Co Ltd Hong Kong Hang Seng Index Food & Drug Stores Store-Based LightInTheBox Holding Co Ltd NYSE Composite Index E-commerce Discretionary Internet Pure Player Liqun Commercial Group Co Ltd Shanghai Stock Exchange Composite Index Department Stores Store-Based Maoye Commericial Co Ltd Shanghai Stock Exchange Composite Index Department Stores Store-Based Meituan Dianping Hong Kong Hang Seng Index E-commerce Discretionary Internet Pure Player Nanjing Xinjiekou Department Store Co Ltd Shenzhen Stock Exchange Composite Index Department Stores Store-Based Nanning Department Store Co Ltd Shanghai Stock Exchange Composite Index Department Stores Store-Based New Huadu Supercenter Co Ltd Shenzhen Stock Exchange Composite Index Food & Drug Stores Store-Based Ningbo Zhongbai Co Ltd Shanghai Stock Exchange Composite Index Department Stores Store-Based Rainbow Department Store Co Ltd Shenzhen Stock Exchange Composite Index Department Stores Store-Based Renrenle Commercial Group Co Ltd Shenzhen Stock Exchange Composite Index Food & Drug Stores Store-Based Shanghai Bailian Group Co Ltd Shanghai Stock Exchange Composite Index Food & Drug Stores Store-Based Shanghai Xujiahui Commercial Co Ltd Shenzhen Stock Exchange Composite Index Department Stores Store-Based Shanghai Yimin Commerce Group Co Ltd Shanghai Stock Exchange Composite Index Department Stores Store-Based Shenyang Commercial City Co Ltd Shanghai Stock Exchange Composite Index Department Stores Store-Based Shirble Department Store Holdings China Ltd Hong Kong Hang Seng Index Department Stores Store-Based Springland International Holdings Ltd Hong Kong Hang Seng Index Food & Drug Stores Store-Based Suning.com Co Ltd Shenzhen Stock Exchange Composite Index Consumer Elec & Applc Stores Store-Based Tianjin Quanye Bazaar Group Co Ltd Shanghai Stock Exchange Composite Index Department Stores Store-Based Vipshop Holdings Ltd NYSE Composite Index E-commerce Discretionary Internet Pure Player Wangfujing Group Co Ltd Shanghai Stock Exchange Composite Index Department Stores Store-Based Wenfeng Great World Chain Development Corp Shanghai Stock Exchange Composite Index Department Stores Store-Based Wuhan Department Store Group Co Ltd Shenzhen Stock Exchange Composite Index Department Stores Store-Based Wuhan Hanshang Group Co Shanghai Stock Exchange Composite Index Department Stores Store-Based Wuhan Zhongnan Commercial Group Shenzhen Stock Exchange Composite Index Department Stores Store-Based Wuhan Zhongnan Commercial Group Shenzhen Stock Exchange Composite Index Department Stores Store-Based Xinjiang Youhao Group Co Ltd Shanghai Stock Exchange Composite Index Department Stores Store-Based Xinjiang Winka Times Department Store Co Ltd Shanghai Stock Exchange Composite Index Department Stores Store-Based
Yi Hua Holdings Ltd Hong Kong Hang Seng Index Department Stores Store-Based
Yinchuan Xinhua Commercial Group Co Ltd Shanghai Stock Exchange Composite Index Department Stores Store-Based Yonghui Superstores Co Ltd Shanghai Stock Exchange Composite Index Food & Drug Stores Store-Based Zhongbai Holdings Group Co Ltd Shenzhen Stock Exchange Composite Index Food & Drug Stores Store-Based Zhongxing Shenyang Commercial Building Group Co Ltd Shenzhen Stock Exchange Composite Index Department Stores Store-Based