Other uses, including reproduction and distribution, or selling or
licensing copies, or posting to personal, institutional or third party
websites are prohibited.
In most cases authors are permitted to post their version of the
article (e.g. in Word or Tex form) to their personal website or
institutional repository. Authors requiring further information
regarding Elsevier’s archiving and manuscript policies are
encouraged to visit:
Rapid, sensitive and simultaneous determination of ascorbic and uric acids in human
plasma by ion-exclusion HPLC-UV
Rita Ferin
a,b,⁎
, Maria Leonor Pavão
a,b, José Baptista
a,baDepartment of Technological Sciences and Development, University of the Azores, Rua da Mãe de Deus, 9501-801 Ponta Delgada, Azores, Portugal bCenter of Research in Natural Resources (CIRN), University of the Azores, Rua da Mãe de Deus, 9501-801 Ponta Delgada, Azores, Portugal
a b s t r a c t
a r t i c l e i n f o
Article history: Received 7 August 2012
Received in revised form 20 December 2012 Accepted 13 January 2013
Available online 23 January 2013 Keywords: Ascorbic acid Uric acid Plasma antioxidants HPLC-UV Ion-exclusion Atherosclerosis
Objectives: Ascorbic (AA) and uric (UA) acids act as antioxidants and are capable to react with biological-ly relevant oxidants. We aimed to developed a simple, rapid, sensitive, and accurate ion-exclusion HPLC-UV methodology for the simultaneously determination of AA and UA in human plasma.
Methods: Analytical pre-requisites, such as the use of heparin as an anticoagulant and meta-phosphoric acid as a stabilizer were added for accurate and reliable measurements.
Chromatographic separation was achieved by an isocratic elution on a HEMA-BIO 1000 SB analytical column using a phosphate buffer, pH 2.4, as a mobile phase.
Results: Results indicated an excellent linearity with correlation coefficients (r2)≥0.999. The LOD of AA and UA was 1.02 and 1.42 nmol/mL, respectively, while LOQ ranged from 0.306 to 0.426 nmol/mL. A great repeatability for both antioxidants was found, where the CV (%) values for intra-day were lower than 1.8% and under 6.5% for the inter-day assay. The recovery of AA ranged from 92% to 96% and from 99% to 100% for UA.
Conclusion: This validated method allows the determination of both antioxidants within 10 min, and is well suited to routine measurements and/or high-throughput clinical analysis. The methodology was applied to assess the antioxidant status of a group of Azorean subjects.
© 2013 The Canadian Society of Clinical Chemists. Published by Elsevier Inc. All rights reserved.
Introduction
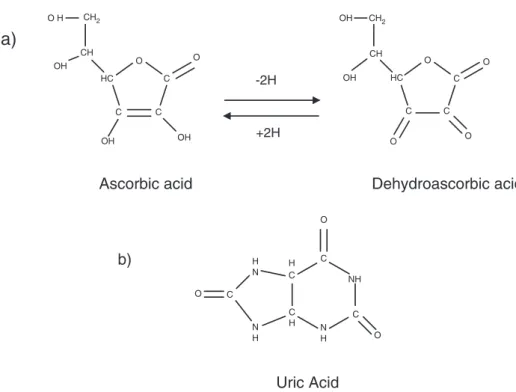
Atherosclerosis (AT), hardening and narrowing of the arteries, is the major cause of cardiovascular disease (CVD), and is a multifactor pro-gressive pathological process where inflammation and oxidative pro-cesses have a central role, from fatty streak formation to plaque rupture and thrombosis[1]. Several studies suggested that the oxida-tion of low-density lipoprotein (LDL)-cholesterol may play an impor-tant role in promoting premature AT. According to the oxidative-modification hypothesis of atherogenesis, LDL-cholesterol in its native state is not atherogenic. However, LDL-cholesterol particles will become atherogenic and initiate the atherosclerotic silent process, with the for-mation of foam cells, if they are oxidatively modified[2]. The antioxi-dant content of LDL-cholesterol is critical for its protection. As a result, the balance between the pro-oxidant challenge and the presence of an-tioxidants determines the extent of the arterial wall modification[3,4]. Antioxidants such as ascorbic acid (AA) and uric acid (UA) (Fig. 1)
participate in defense mechanisms against oxidative damage as free radical scavengers[5].
L-Ascorbic acid (vitamin C) is a water-soluble vitamin which is in-volved in several biochemical reactions in cells and tissues[6]. Under physiological conditions, AA is an electron donor, which allows it to react with biologically relevant radicals and other oxidants such as superoxide anion, hydroxyl radical, singlet oxygen and hypochlorous acid[7]. Furthermore, it can regenerate vitamin E (α-tocopherol) from bothα-tocopheryl radical and tocophrylquinone in membranes[7]. Vi-tamin C also acts as a cofactor for enzymes involved in the biosynthesis of collagen and carnitine, participates in the conversion of neurotrans-mitter dopamine to norepinephrine and in the metabolism of tyrosine [8], and is involved in the absorption of iron from non-heme sources from intestine[6]. Almost all animals are able to endogenously synthe-size large quantities of vitamin C. However, humans lost this ability as a result of a series of inactivating mutations of the gene encoding gulonolactone oxidase (GULO), the rate limiting enzyme in the vitamin C biosynthetic pathway. Therefore, to compensate, humans must con-sume exogenous vitamin C on a daily basis, from a variety of dietary sources as fruit and vegetables[7,9,10].
UA is the end product of endogenous and dietary purine nucleo-tide metabolism in humans. It is derived from xanthine, which, in turn, results from hypoxanthine, being both reactions catalyzed by xanthine oxidase[11,12]. In most species, UA is further metabolized
Clinical Biochemistry 46 (2013) 665–669
⁎ Corresponding author at: Department of Technological Sciences and Development, University of the Azores, Apartado 1422, 9501-801 Ponta Delgada, Azores, Portugal. Fax: +351 296650171.
E-mail addresses:rborges@uac.pt(R. Ferin),lpavao@uac.pt(M.L. Pavão),
baptista@uac.pt(J. Baptista).
0009-9120/$– see front matter © 2013 The Canadian Society of Clinical Chemists. Published by Elsevier Inc. All rights reserved.
http://dx.doi.org/10.1016/j.clinbiochem.2013.01.006
Contents lists available atSciVerse ScienceDirect
Clinical Biochemistry
to allantoin by the urate oxidase (uricase) enzyme, but humans lack this enzyme because of a defective gene that is not transcribed [13,14]. Therefore, UA is excreted in urine, and plasma UA levels in humans are appreciably higher as compared to those in most mam-mals. Studies in vitro have pointed out the important role of uric acid as an antioxidant substance, acting as a potent scavenger of sin-glet oxygen and hydroxyl radicals and as a chelator of transitional metal ions which are thus converted to poorly reactive forms[12,15]. Several methods have been presented by different researchers for the determination of ascorbic and uric acids in biological samples such as: spectrophotometric methods, high performance liquid chro-matography (HPLC) with electrochemical (EC) or ultraviolet (UV) de-tection[16,17], and capillary electrophoresis (CE) coupled with UV [18]or EC[19]. However, only a few studies have described the simul-taneous determination of AA and UA. Several pre-analytical procedures are required for an accurate and reliable determination of these two an-tioxidants in human plasma, mainly because AA is extremely sensitive to oxidation and degradation during blood sampling, handling, storage, and analysis[20,21]. Additionally, it is necessary to stabilize the plasma samples by protecting them from light and high temperatures, as well as acidifying the samples before storage, particularly when it is not pos-sible to immediately perform the analysis. According to Lykkesfeldt[22] the blood collection, including the anticoagulant used, have consider-able influence on the outcome data.
The aim of the present study was the development of a simple, rapid, sensitive, precise, and accurate ion-exclusion HPLC-UV method-ology (isocratic elution) for the simultaneously determination of AA and UA to be applied to blood samples donated by Azorean subjects with no declared chronic diseases.
Materials and methods Chemicals
L(+)-Ascorbic acid, dehydro-L-ascorbic acid (DHAA), perchloric acid (PCA), and acetonitrile were purchased from Sigma-Aldrich (Sigma-Aldrich Chemie, Steinheim, Germany). Meta-phosphoric acid (MPA), trichloroacetic acid (TCA), sodium dihydrogen phosphate (NaH2PO4), and dodecyltrimethyl ammonium chloride were obtained
from Fluka (Sigma-Aldrich Chemie, Steinheim, Germany). Potassium dihydrogeno phosphate (KH2PO4), uric acid, and ortho-phosphoric acid were provided by Merck (Darmstadt, Germany). Sodium hydroxide (NaOH) and ethylenediaminetetraacetic acid disodium (Na2EDTA) were obtained from Riedel-de Haën (Sigma-Aldrich Chemie, Steinheim, Germany). Deionized water obtained from an in-house Milli-Q water purification system (Millipore, Bedford, MA, USA) was used for the preparation of the mobile phase and the standard solutions. All solvents were HPLC grade and standards of the highest purity available. Blood samples
Stability is a key problem of AA blood analysis, because AA is rapidly degraded to DHAA (Fig. 1). Both AA oxidation and DHAA hydrolysis are further prevented to some extent by acidification. Acids as PCA, TCA, and MPA have been investigated for the AA stabilization[23,24]. How-ever, MPA showed to be more efficient, considering both stabilization of AA and DHAA and precipitation of plasma sample proteins. MPA was adopted in our study because it also showed the ability to separate from AA with superior resolution and left lower level of contamination. Whole blood samples were collected from 321 (187 women and 134 men) subjects (under fasting conditions) whom consented to participate in this study. Venous blood was drawn in heparinised vacutainers Sarstedt (Sarstedt AG & Co., Nümbrecht, Germany) by a standardized procedure of venipucture. The individuals were selected under the following criteria: apparently healthy with no declared chron-ic diseases (including diabetes and CVD), aged 20 to 60 years, all born and living in the Azores Archipelago (Portugal). Subjects that had been taking vitamin supplements were excluded from the study. The study re-ceived ethical committee approval of our institution and all participants provided written informed consent.
Plasma was generated by immediately centrifugation at 2500 ×g for 15 min at 4 °C. One aliquot of plasma in an opaque Eppendorf tube was exhaustively vortexed with cold freshly prepared 10% MPA (1:1; v/v) for 30 s, and stored at−80 °C until further analysis. For the quantifica-tion of the analytes, thawed plasma samples were vortexed and then centrifuged at 16,000 ×g for 15 min at 4 °C. One aliquot of 20μL from the clear supernatant was promptly used for chromatographic analysis. All the procedures were performed under light protection.
CH OH CH2 O H HC C OH C OH C O O CH OH CH2 OH HC C O C O C O O
Ascorbic acid
Dehydroascorbic acid
C O C O C O N H N H C H C H N H NH
Uric Acid
-2H
+2H
a)
b)
Standards preparation and calibration curves
A standard stock solution containing 5 mmol/L of AA was freshly, daily prepared in Milli-Q water. The working standard solutions of AA were prepared by diluting the stock solution with Milli-Q water, cov-ering the range of 0–200 (0, 5, 15, 25, 50, 75, 100, 150, 200) μmol/L analyzing each working standard solution in quadruplicate. The stock solution of UA was freshly prepared at 1.2 mmol/L by dissolving in 20 mmol/L NaOH. The working standard solutions of UA ranged from 0 to 500 (0, 10, 30, 60, 120, 200, 300, 400, 500)μmol/L, and were pre-pared by appropriately diluted stock solution with 20 mmol/L NaOH. All daily prepared stock and working standard solutions were carefully protected from light during preparation and analyses, and were also maintained in ice. The multicalibration curves were constructed by plotting the peak area of each analyte against concentration which gave the values of the slope along with the intercept and correlation co-efficient for each calibration curve.
Chromatographic conditions
Plasma sample analyses were carried out with an Agilent Technologies (Avondale, PA, USA) HPLC model 1200 system with UV (DAD) detector. Two different types of reversed phase columns, with different degrees of hydrophobicity and different carbon loadings were initially tested for the MPA, AA and UA separation from the other plasma components. The separation was investigated, for the best resolution, using mobile phases with different ratios of organic phase to aqueous phase and differ-ent pH values. In order to achieve a complete separation, particularly between MPA and AA, a fine-tuning resolution was performed with Chromolith Performance RP18-5μm (100 mm×4.6 mm I.D.) column coupled with a Chromolith Performance RP18-5μm (10 mm×4.6 mm) guard column, provided by Phenomenex (Torrence, CA, USA), following the methodology of Karlsen et al.[25]with slightly modification. The mo-bile phase was prepared by addition of 2% acetonitrile to the aqueous phase (2.5 mmol/L NaH2PO4, 2.5 mmol/L dodecyltrimethyl ammonium chloride and 1.25 mmol/L Na2EDTA in milli-Q water). Theflow rate was 0.6 mL/min. The injection volume used was 5μL. A variable wavelength DAD detector was used at 264 nm. The results of these experiments have shown a partially overlapped MPA and AA signals that compromise the quantification accuracy. In order to improve the separation the present method was developed using an HEMA-BIO 1000 SB analyt-ical column (250 × 4.6 mm I.D., 10μm particle size; obtained from Tessek, Ltd., Prague, Czech Republic) protected by a Onyx Monolithic C18 guard-column (10 × 4.6 mm, I.D.; provided by Phenomenex, Torrence, CA, USA). The mobile phase consisted of 20 mmol/L KH2PO4, pH 2.4, afterfiltration through a 0.45 μm cellulose acetate membrane Whatman (Dassel, Germany). The temperature of the column oven was maintained at 35 °C, and theflow rate used was 0.50 mL/min. An aliquot of 20μL was injected through a Rheodyne 71251 injection valvefitted with a 20 μL sample loop (Rheodyne, Cotati, CA, USA). For UV-detection the wavelength (DAD) was set at 245 nm. The quantita-tive determinations were achieved by using the external standard method with the Agilent Technologies ChemStation software and work-ing standard solutions of the analytes. The sample concentration was limited to the linearity range in order to avoid peak tailing and retention time shifting, which may occur when the sample amount approaches the column sample load capacity. Results were expressed asμmol/mL of plasma and all analysis were performed in triplicate. The chromato-grams were recorded according to the retention time.
Method validation
The analytical method was validated taking into consideration the precision, repeatability, specificity, sensitivity, linearity within the re-ferred concentration ranges, and recovery[26].
The precision of the chromatographic methodology was evaluated by performing intra- and inter-day multiple injections of AA and UA standard solutions with three different concentrations, and by checking the percentages of the coefficient of variation of the peak area. The spec-ificity of the method was tested by co-elution of AA and UA with au-thentic standards and by spectral comparison with standards using the diode-array detector. The sensitivity of the method was determined by quantifying the limit of detection (LOD) that was evaluated using a lower analyte concentration that would yield a signal-to-noise ratio (S/N) of 3; the limit of quantification (LOQ) represents the analyte con-centration that would yield a signal-to-noise (S/N) of 10. The linearity of the method was investigated with the use of AA and UA calibration curves from freshly standard solutions within the expected and exceed-ing concentration ranges. The accuracy of this method was evaluated by determining the recovery of AA and UA in samples with known amounts of these two antioxidants. Three different known amounts of each stan-dard compound were added to the plasma sample which was subjected to the HPLC chromatographic analysis. The recovery was calculated based on the difference between the total concentration determined in the spiked samples and the concentration observed in the non-spiked samples. All analyses were carried out in triplicate.
Statistical analysis
Statistical analysis was performed by using SPSS 15.0 for software for windows (SPSS Institute, Chicago, IL). Linear regression was applied to develop an equation to predict the AA and UA plasma concentrations. Differences between men and women were tested by Student's t-test and data are presented as mean± SD. A P-value ofb0.05 was consid-ered to be statistically significant.
Results and discussion Sample preparation
For a reliable and correct chromatographic separation of AA and UA from plasma, it is required to take pre-analytical procedures since sta-bility is a crucial problem for these antioxidants. The whole blood sam-ples must be collected into vacutainer tubes containing heparin as anticoagulant[25,27,28], and must be kept in the dark and at +4 °C until plasma was separated from cells, since temperature, light, and the presence or absence of oxygen induces the analytes' degradation [29]. Immediately after the centrifugation, plasma samples were acidi-fied with meta-phosphoric acid to stabilize the sample before storage at−80 °C since measurements could be performed within this time [27].
Chromatographic separation
A representative HPLC chromatogram of the human plasma sample obtained is shown in Fig. 2. Retention times for AA and UA were 6.056 min and 8.463 min, respectively. The identification of the peaks was done by comparison of the retention times with those correspond-ing to the pure standards ran separately in the same analytical condi-tions, confirmed by spike of the authentic standards to the plasma sample and by spectral comparison with standards using the DAD pro-file between 200 and 400 nm. The isocratic elution of the two analytes was completed within 10 min (Fig. 2), allowing a new injection every 12 min and consequently a high-throughput HPLC analyses. The com-plete chromatographic separation of the three analytes (MPA, AA and UA), particularly between MPA and AA, was successfully achieved using the HEMA-BIO 1000 SB, a strong cation exchange analytical col-umn containing sulphobuthly groups. These groups are bound to a hy-drophilic hydroxyethyl methacrylate backbone. The retention on the ion-exchange columns is controlled by electrostatic attraction and/or repulsion forces, hydrophobic interactions and the size-exclusion effect
by partial penetration into the pores[28]. In our study, MPA that is ion-ized at the pH of the mobile phase is excluded from the ionic functional group\SO3−in the column, reducing its retention time and allowing a better separation from AA and UA that are protonated at the mobile phase pH. The column stability at the very low mobile phase pH is assured by the polymeric matrix of the stationary phase. In addition, this AA and UA plasma separation method has the advantage of saving time and volume of mobile phase that are of crucial importance for rou-tine analysis. Under these elution conditions, all the peaks of interest were well separated and there were no other interfering peaks from the plasma.
Method validation
The validating parameters for both calibration curves (slope, intercept, correlation coefficient) as well as for the linear range are shown inTable 1. Results indicated an excellent linearity for both analytes over the referred concentration ranges with correlation coefficients (r2)≥0.999. The LOD of the assay (at a signal-to-noise ratio of 3) for AA and UA was 1.02 and 1.42 nmol/mL, respectively, while the LOQ (a signal-to-noise ratio of 10) ranged from 0.306 to 0.426 nmol/mL. The precision of isocratic HPLC-UV methodology was evaluated by performing intra- and inter-day multiple injections of AA and UA standard solutions with three different concentrations and by checking the percentages of coef-ficient of variation of the peak area. The results presented inTable 2 re-vealed a great repeatability for both antioxidants, since the CV (%)
values for intra-day were lower than 1.8% and under 6.5% for the inter-day. The assessment of the analytical recovery was based on the difference between the total concentration determined in the spiked plasma samples and the concentration in the non-spiked samples (Table 3). Three different known amounts of AA and UA authentic stan-dards were added to the plasma samples (n= 3) which were subjected to the chromatographic analysis.Table 3shows the good recovery for both antioxidants. For AA the recovery ranged from 92% to 96% and for UA from 99% to 100%. Regarding the validation parameters we can-not compare our results with others reported in literature. The few pub-lished results for the simultaneous determination of AA and UA plasma levels used different separation methods (capillary electrophoresis and RP-HPLC-ECD)[16,18]. Our methodology shows that it is possible to accurately determine the amount of AA and UA in plasma samples by HPLC with UV detection, which does not agree with Li and Franke[16] who reported that HPLC-UV is not suitable for plasma AA determination.
Application of the method
The presented methodology was employed for the assessment of AA and UA levels in 321 plasma samples from subjects with no de-clared chronic diseases. The mean values for the concentrations of
Fig. 2. HPLC chromatogram obtained from the analysis of plasma sample with UV detection. Chromatographic conditions: HEMA-BIO 1000 SB column (250 × 4.6 mm I.D., 10μm); Mobile phase: isocratic elution with 20 mmol/L KH2PO4 buffer pH 2.4 and the flow rate was 0.50 mL/min; temperature 35 °C; UV detection (λ=245 nm). Legend:
meta-phosphoric acid— MPA (3.704 min), ascorbic acid — AA (6.056 min), and uric acid — UA (8.463 min).
Table 1
The regression equations, the linear range and the limits of detection and quantifica-tion of plasma ascorbic acid (AA) and uric acid (UA).
Analytes Linear range (μmol/L) Linear equation r2a LODb (nmol/mL) LOQc (nmol/mL) AA 5–200 y = 20.822x−14.629 0.999 0.306 1.02 UA 10–500 y = 0.6052x−0.6193 0.999 0.426 1.42 a r2— correlation coefficient. b LOD— limit of detection. c LOQ— limit of quantification.
Table 2
Intra- and inter-day (n = 10) precision data for peak area (mean ± SD), and coefficient of variation (CV) of three different concentrations of ascorbic (AA) and uric (UA) acids.
Analytes Standard concentration (μmol/L) Intra-day precision (n = 10) Inter-day precision (n = 10) Mean ± SD CV (%)a Mean ± SD CV (%)a AA 15 293.029 ± 3.94 1.34 304.152 ± 13.76 4.52 25 496.689 ± 0.44 0.09 521.579 ± 28.74 5.51 75 1520.214 ± 0.63 0.04 1508.263 ± 14.20 0.94 UA 30 372.229 ± 0.32 0.09 371.882 ± 9.41 2.53 60 770.541 ± 5.27 0.68 776.683 ± 18.86 2.43 200 2580.655 ± 45.79 1.77 2446.316 ± 158.82 6.49 aCV(%) = (SD/Mean) × 100.
AA and UA are illustrated inTable 4. The revealed values for both an-tioxidants are within the reference range as compared with reported results in literature[30,31]. AA concentrations were significantly higher (17%) in women than in men (Pb0.001), whereas UA levels were signif-icantly higher (51%) in men as compared to women (Pb0.001). Conclusion
The HEMA-BIO 1000 SB analytical column showed the ability to separate AA and UA from MPA with superior resolution as compared with the reversed phase C18 column. A validated and rapid isocratic HPLC-UV method was successfully developed for the simultaneous determination of AA and UA levels in human plasma. The methodology offers great sensitivity, precision, accuracy and reproducibility for the determination of both antioxidants within 10 min, and is well suited to routine measurements and/or high-throughput clinical analysis. Acknowledgments
This work was supported by the project‘Search for nuclear and mitochondrial biomarkers of atherosclerosis in isolated populations from Azores Islands’ with a reference M2.1.2/F/009/2007, funded by the Regional Government of the Azores, and R.F. is a PhD grantee of Fundação para a Ciência e a Tecnologia [SFRH/BD/34322/2007]. References
[1] Lusis AJ. Atherosclerosis. Nature 2000;407:233–41.
[2] Singh U, Jialal I. Oxidative stress and atherosclerosis. Pathophysiology 2006;13: 129–42.
[3] Jialal I, Devaraj S. Low-density lipoprotein oxidation, antioxidants, and atherosclerosis: a clinical biochemistry perspective. Clin Chem 1996;42:498–506.
[4] Epstein FH, Diaz MN, Frei B, Vita JA, Keaney Jr JF. Antioxidants and atherosclerotic heart disease. N Engl J Med 1997;337:408–16.
[5] Violi F, Micheletta F, Iuliano L. Antioxidants and atherosclerosis. Eur Heart J Sup-plements 2002;4:B17–.
[6] Levine M, Rumsey SC, Daruwala R, Park JB, Wang Y. Criteria and recommenda-tions for vitamin C intake. JAMA 1999;281:1415–23.
[7] Verrax J, Buc Calderon P. The controversial place of vitamin C in cancer treatment. Biochem Pharmacol 2008;76:1644–52.
[8] Padayatty SJ, Levine M. New insights into the physiology and pharmacology of vitamin C. Can Med Assoc J 2001;164:353–5.
[9] Li Y, Schellhorn HE. New developments and novel therapeutic perspectives for vitamin C. J Nutr 2007;137:2171–84.
[10] Frikke-Schmidt H, Lykkesfeldt J. Role of marginal vitamin C deficiency in atherogenesis: in vivo models and clinical studies. Basic Clin Pharmacol Toxicol 2009;104:419–33. [11] Kim KM, Henderson GN, Ouyang X, et al. A sensitive and specific liquid
chromatography–tandem mass spectrometry method for the determination of in-tracellular and exin-tracellular uric acid. J Chromatogr B 2009;877:2032–8. [12] Strazzullo P, Puig JG. Uric acid and oxidative stress: relative impact on
cardiovas-cular risk. Nutr Metab Cardiovasc Dis 2007;17:409–14.
[13] Glantzounis G, Tsimoyiannis E, Kappas A, Galaris D. Uric acid and oxidative stress. Curr Pharm Des 2005;11:4145–51.
[14] Wu X, Muzny DM, Chi Lee C, Thomas Caskey C. Two independent mutational events in the loss of urate oxidase during hominoid evolution. J Mol Evol 1992;34:78–84. [15] Kand'ár R,Žáková P, Mužáková V. Monitoring of antioxidant properties of uric
acid in humans for a consideration measuring of levels of allantoin in plasma by liquid chromatography. Clin Chim Acta 2006;365:249–56.
[16] Li X, Franke AA. Fast HPLC-ECD analysis of ascorbic acid, dehydroascorbic acid and uric acid. J Chromatogr B 2009;877:853–6.
[17] Pappa-Louisi A, Pascalidou S. Optimal conditions for the simultaneous ion-pairing HPLC determination ofl-ascorbic, dehydro-L-ascorbic,D-ascorbic, and uric acids with on-line ultraviolet absorbance and electrochemical detection. Anal Biochem 1998;263:176–82.
[18] Zinellu A, Sotgia S, Deiana L, Carru C. Pre-analytical factors affecting ascorbic and uric acid quantification in human plasma. J Biochem Biophys Methods 2006;67: 95–105.
[19] Yao X, Wang Y, Chen G. Simultaneous determination of aminothiols, ascorbic acid and uric acid in biological samples by capillary electrophoresis with electrochem-ical detection. Biomed Chromatogr 2007;21:520–6.
[20] Dhariwal K, Hartzell W, Levine M. Ascorbic acid and dehydroascorbic acid mea-surements in human plasma and serum. Am J Clin Nutr 1991;54:712–6. [21] Karlsen A, Blomhoff R, Gundersen T. Stability of whole blood and plasma ascorbic
acid. Eur J Clin Nutr 2007;61:1233–6.
[22] Lykkesfeldt J. Ascorbate and dehydroascorbic acid as biomarkers of oxidative stress: validity of clinical data depends on vacutainer system used. Nutr Res 2012;32:66–9.
[23] Kafkas E, Koşar M, Türemiş N, Başer K. Analysis of sugars, organic acids and vita-min C contents of blackberry genotypes from Turkey. Food Chem 2006;97:732–6. [24] Romeu-Nadal M, Castellote A, Gayą A, López-Sabater M. Effect of pasteurisation on ascorbic acid, dehydroascorbic acid, tocopherols and fatty acids in pooled ma-ture human milk. Food Chem 2008;107:434–8.
[25] Karlsen A, Blomhoff R, Gundersen TE. High-throughput analysis of vitamin C in human plasma with the use of HPLC with monolithic column and UV-detection. J Chromatogr B 2005;824:132–8.
[26] Causon R. Validation of chromatographic methods in biomedical analysis view-point and discussion. J Chromatogr B Biomed Sci Appl 1997;689:175–80. [27] Chung WY, Chung JKO, Szeto YT, Tomlinson B, Benzie IFF. Plasma ascorbic acid:
measurement, stability and clinical utility revisited. Clin Biochem 2001;34: 623–7.
[28] Nováková L, Solich P, Solichová D. HPLC methods for simultaneous determination of ascorbic and dehydroascorbic acids, TrAC. Trends Anal Chem 2008;27:942–58. [29] Parviainen M, Nyyssonen K. Ascorbic acid. In: de Leenheer AP, Lambert WE, Van Bocxlaer JF, editors. Modern Chromatographic Analysis of Vitamins. Marcel Dekker. Inc.; 1992
[30] Corti A, Casini AF, Pompella A. Cellular pathways for transport and efflux of ascorbate and dehydroascorbate. Arch Biochem Biophys 2010;500:107–15.
[31] Waring W, Webb D, Maxwell S. Uric acid as a risk factor for cardiovascular disease. QJM 2000;93:707–13.
Table 3
Recovery of ascorbic acid (AA) and uric acid (UA) from human plasma samples (n = 3). Analytes Concentration (μmol/L) Recovery (%) CV (%)
Plasma Spiked Measured
AA 34.2 ± 6.9 15 45.3 ± 6.4 92 ± 0.6 0.62 25 56.8 ± 5.5 96 ± 2.8 2.96 50 80.0 ± 6.2 95 ± 0.8 0.85 UA 137.3 ± 26.7 30 167.4 ± 25.5 100 ± 1.1 1.10 60 196.8 ± 23.4 100 ± 1.7 1.70 120 254.0 ± 23.3 99 ± 1.5 1.51 Table 4
Ascorbic (AA) and uric (UA) acids plasma levels in the apparently healthy subjects, according to gender.
Antioxidants (μmol/L) Alla
Womena
Mena
(321) (187) (134)
AA 53 ± 23 56 ± 23 48 ± 23⁎⁎⁎
UA 209 ± 89 171 ± 65 259 ± 93⁎⁎⁎
aValues are mean ± SD for (n) subjects; asterisks denote significant differences
be-tween gender. ⁎⁎⁎ Pb0.001.