http://dx.doi.org/10.1590/s2175-97902018000117381
Article
*Correspondence: M. G. Bonthu. Assistant Professor, Sri Vasavi Institute of Pharmaceutical Sciences, Tadepalligudem-534201, Andhra Pradesh, India. E-mail:[email protected]
Simultaneous determination of candesartan and
hydrochlorothiazide in human plasma by LC-MS/MS
Mohan Gandhi Bonthu
1*, Lakshmana Rao Atmakuri
2,Venkateswara Rao Jangala
31Department of Pharmaceutical Analysis, Sri Vasavi Institute of Pharmaceutical Sciences, Tadepalligudem, Andhra Pradesh,
India, 2Department of Pharmaceutical Analysis, V. V. Institute of Pharmaceutical Sciences, Gudlavalleru, Andhra Pradesh,
India, 3Department of Pharmaceutical Analysis, St. Paul’s College of Pharmacy, Turkayamjal(V), Telangana, India
A simple, sensitive, rapid and highly efficient LC-MS/MS method was developed for the determination of Candesartan and Hydrochlorothiazide simultaneously in human plasma. The method employed Zorbax eclipse C18 (150 X 4.6 mm, 5µ) column using acetate buffer: acetonitrile (25:75%, v/v) as the mobile phase. The mobile phase flow rate is 1 mL/min which was delivered into the mass spectrometer electron spray ionization chamber. The Liquid/liquid extraction procedure was used in the method for the extraction of analytes. The chromatograph was attached to a negative ion mode tandem mass spectrometer and the method was validated for all the parameters as per the guidelines of US-FDA. The ions were detected in multiple reaction monitoring mode and the transitions are m/z 439.00→309.10 and 295.80→268.80 for candesartan and hydrochlorothiazide respectively. Isotopic standards were used as internal standards for effective recovery of the analytes. The drugs were analyzed over a calibration range of 1.027-302.047 ng/mL for candesartan and 1.044-306.945 ng/mL for hydrochlorothiazide respectively with regression coefficient greater than 0.99. The mean extraction recoveries are 96.95±5.61 and 100.55±4.82 for candesartan and hydrochlorothiazide respectively. The precision and accuracy values for all the studies were within the range of ≤15% and 85-115%. The performed stability studies indicate that the developed method is stable in plasma for 15 h at room temperature (bench top); 52 h (in injector); for 112 days at -70 ºC for long term stability; five successive freeze and thaw cycles. The developed method could be successfully employed for the determination of selected drugs in biological samples.
Keywords: Candesartan. Hydrochlorothiazide. LC-MS/MS. Method validation. Human plasma.
INTRODUCTION
Candesartan (CAN), is chemically 2-ethoxy-1-({4-[2-(2H-1, 2, 3, 4-tetrazol-5-yl) phenyl] phenyl}
methyl)-)-1H-1,3-benzodiazole-7-carboxylic acid. It is
an angiotensin receptor blocking agent which can be used alone or in combination with other drugs for the treatment of hypertension. It competes with angiotensin-II for its receptors there by lowering blood pressure. It is also used as an effective alternative for the treatment of heart failure,
myocardial infarction, coronary diseases and systolic
dysfunction (The Merck Index, 2006).
Hydrochlorothiazide (HCT), is chemically 6-chloro-1, 1-dioxo-3, 4-dihydro-2H
-1,2,4-benzo-thiadiazine-7-sulfonamide. It is a prototypical member of the thiazide diuretic. It helps in reduction of reabsorption
of various electrolytes through renal tubules resulting
in excretion of water along with different electrolytes
like sodium, potassium, chloride, magnesium etc. It is
widely used in the treatment of edema, hypertension, hyperparathyroidism, and diabetes insipidus (The Merck index, 2006).
Thorough survey of literature disclosed good
number of analytical methods which include UV (Erk, 2003a;Naseemet al., 2009), HPTLC (Bipin, Sachinet al.,
2008), HPLC (Qutab et al., 2007; Be et al., 1990; Richter,
Oertel, Kir, 1996; Erk, 2003b; Zendelovska, Stafilovm
Molisevski, 2004; Balamuralikrishna, Syamasundar,
2010; Annapurna, Narendra, Ravi, 2012; Veeranjaneyulu,
Aneesha, Nandakishore, 2012; Narendra, Satyanarayana,
et al., 2014) methods are available for the evaluation of
CAN and HCT in bulk, pharmaceutical dosage forms and in biological samples individually or in combination with other drugs. To our knowledge, no LC-MS/MS method is
available for the simultaneous evaluation of these drugs
in human plasma using isotopic internal standards. Hence, we made an attempt to develop a simple method for the
appraisal of these drugs. The developed method has been
validated as per the guidelines given by US-FDA for biological samples (ICH, 1996; ICH, 1997).
EXPERIMENTAL
Chemicals and materials
CAN and HCT were procured from Dr. Reddy’s Laboratories Limited, Hyderabad, India. Candesartan
d4 (CAN- IS), Hydrochlorothiazide 13C
6 (HCT-IS) were
obtained from Clear-synth Labs Limited, Mumbai, India. HPLC grade methanol, HPLC grade acetonitrile, analytical grade formic acid and HPLC grade diethyl ether were purchased from Merck Specialties, Mumbai, India.
K2EDTA human plasma was obtained from a registered blood bank, Secunderabad, India and was stored at –20°C
prior to use.
Liquid chromatographic and mass spectrometry
A Shimadzu HT (Shimadzu, Japan) LC system which was furnished with degasser (DGU-20A5), binary
pump (LC-20AD) in company with auto-sampler (SIL-HTC) was used. Zorbax Eclipse C18 (150 × 4.6 mm, 5 µm) column was employed for the separation of analytes, which was preserved at 40°C±2°C in column oven (CTO-10AS). A mixture of 5 mM ammonium acetate: acetonitrile (25:75%, v/v) was filtered as mobile phase, which was delivered at a flow rate of 1.0 mL/min into the mass spectrometer electrospray ionization chamber.
Analytes and IS were ascertained by MS/MS detection under negative ion mode using an MDS Sciex (Foster City, CA, USA) API-4000 mass spectrometer. It is furnished with a Turbo ion spray. The routine specifications like curtain gas, nebulizer gas (GS1), auxiliary gas (GS2) and collision gas (CAD) were fixed at 20, 21, 31 and 6 psi, respectively. The compounds specifications like declustering potential (DP), collision energy (CE), collision exit potential (CEP) and entrance potential (EP) for CAN, HCT, CAN-IS and HCT-IS were -40, -30, -15, -10 V; -99, -29, -15, -10 V ; -40, -32, -15, -10 V and -99, -29, -15, -10 V respectively. Diagnosis of the ions was accomplished in the multiple reaction monitoring (MRM) mode, observing
the transition of the m/z 439.00 parent ion to the m/z 309.10
daughter ion for CAN, m/z 295.80 parent ion to the m/z
268.80 daughter ion for HCT, m/z 443.00 parent ion to the
m/z 312 00 daughter ion for CAN-IS and m/z 301.80 parent
ion to the m/z 274.90 daughter ion for HCT-IS. The dwell
time was 200 msec. The analytical data were exercised by Analyst software (version 1.4.2). Summary of optimized method parameters were tabulated in Table I and optimized system parameters were portrayed inTable II.
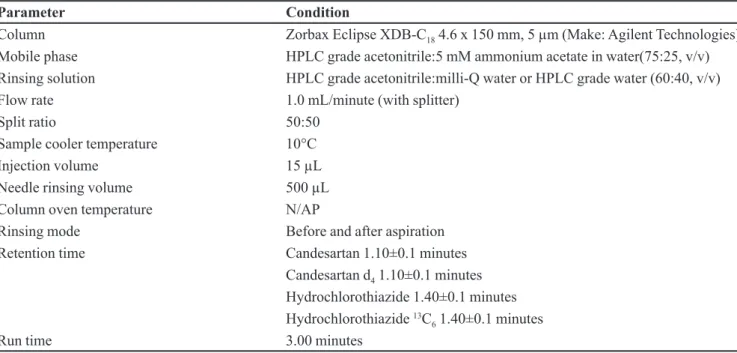
TABLE I - Summary of optimized conditions
Parameter Condition
Column Zorbax Eclipse XDB-C18 4.6 x 150 mm, 5 µm (Make: Agilent Technologies)
Mobile phase HPLC grade acetonitrile:5 mM ammonium acetate in water(75:25, v/v)
Rinsing solution HPLC grade acetonitrile:milli-Q water or HPLC grade water (60:40, v/v)
Flow rate 1.0 mL/minute (with splitter)
Split ratio 50:50
Sample cooler temperature 10°C
Injection volume 15 µL
Needle rinsing volume 500 µL
Column oven temperature N/AP
Rinsing mode Before and after aspiration
Retention time Candesartan 1.10±0.1 minutes
Candesartan d4 1.10±0.1 minutes
Hydrochlorothiazide 1.40±0.1 minutes
Hydrochlorothiazide 13C
6 1.40±0.1 minutes
Preparation of reagents
5 mM ammonium acetate buffer
About 385.4 mg of ammonium acetate was weighed accurately and transferred into a clean and dry 1000 mL standrad flask. About 100 mL of HPLC/Milli Q grade water was added to mix the contents and then subjected to sonication on an ultrasonicator for 5 min. Finally, the solution was made up to the mark with HPLC/Milli Q grade water.
Mobile phase (25:75%, v/v)
500 mL of 5mM ammonium acetate was transferred into a two liters volumetric flask. About 500 mL of HPLC grade acetonitrile was added to it and mixed it well,
sonicated in an ultrasonic bath for 5 min and made up to
the mark with acetonitrile.
Diluent (v/v)
A mixture of HPLC grade acetonitrile and Milli Q/ HPLC grade water in the volume ratio of 60:40%, v/v respectively was prepared and used as diluent.
Rinsing Solution (v/v)
The Diluent was employed as a rinsing solution.
5% formic acid buffer(v/v)
5.00 mL of formic acid was carefully withdrawn using calibrated pipette and transferred into a 100 mL standard flask and to this few mL of Milli Q/HPLC
grade water was added and mixed it well, then sonicated
it in an ultrasonic bath for 5 min, finally made up to the mark.
Preparation of internal standards (IS) solution
Accurately weighed and transferred 2 mg of Candesartan d4 and Hydrochlorothiazide
13C
6 working
standards separately into 2 mL standard flasks. Dissolved in HPLC grade methanol and made up the volume with the same to produce a solution of 1.0000 mg/mL of
candesartan d4 and hydrochlorothiazide 13C
6.
Combined stock dilution of candesartan d4 and hydrochlorothiazide 13C
6 was prepared at a concentration
of 5000.000 ng/mL and 5000.000 ng/mL, respectively
using diluent.
Preparation of candesartan and hydrochlorothiazide stock solution
Accurately weighed and transferred 2 mg of candesartan and hydrochlorothiazide working standards separately into 2 mL volumetric flasks. Dissolved in HPLC grade methanol and made up the volume with the same to produce a solution of 1.0000 mg/mL of candesartan and hydrochlorothiazide.
Sample preparation
One set of calibration curve standards; one or more sets of quality control samples and plasma samples were withdrawn from the deep freezer and allowed it to thaw at room temperature. The thawed samples were placed on
TABLE II - LC-MS/MS optimized system parameters
Parameter CAN CAN D4 HCT HCT 13C
6
Ionization mode Negative Negative Negative Negative
Detection m/z 439.00 (parent) and
309.10 (product) 443.00 (parent) and 312.00 (product) 295.80 (parent) and 268.80 (product) 301.80 (parent) and 274.90 (product)
Ion Spray Voltage (IS) -4500.00 V -4500.00 V -4500.00 V -4500.00 V
Temperature (TEM0C) 500.00 500.00 500.00 500.00
Curtain Gas (CUR) 20.00V 20.00V 20.00V 20.00V
Collision Gas (CAD) 6.00psi 6.00psi 6.00psi 6.00psi
GS1 21.00 psi 21.00 psi 21.00 psi 21.00 psi
GS2 31.00psi 31.00psi 31.00psi 31.00psi
Declustering Potential (DP) -40.00V -40.00V -99.00V -99.00V
Collision Energy (CE) -30.00 V -32.00 V -29.00 V -29.00 V
Collision Cell Exit Potential (CEP) -15.00 V -15.00 V -15.00 V -15.00 V
Entrance Potential (EP) -10.00 V -10.00 V -10.00 V -10.00 V
Dwell time (m.sec) 200 200 200 200
a vortex to ensure complete mixing of the contents. 100 µL of the sample was pipetted out into prelabelled 15 mL stopper glass test tubes. 10 µL of internal standard dilution (combined dilution of 5000.000 ng/mL Candesartan d4 and Hydrochlorothiazide 13C
6) was added, except in blank
wherein added 10 µL of diluent and vortexed. Then, added 500 µL of 5% formic acid buffer and vortexed. 5 mL of tertiary butyl methyl ether (TBME) was added and placed
the samples for 20 min on the reciprocating shaker at 200
rpm. Then samples were centrifuged at 4000 rpm for 10 minutes at 4°C. Then the superficial organic layer (4 mL) was shifted to prelabelled glass test tubes and evaporated to dryness under liquid nitrogen at 45°C. The samples were reconstituted with 250 µL of mobile phase and 15 µL of the sample was injected into the system.
VALIDATION PROCEDURES
The developed method was validated for various specifications to reach the acceptance criteria as per the guidelines of US-FDA (ICH, 1996; ICH, 1997).
Matrix effect
The interference consequences of human plasma elements over the ionization of CAN, HCT, CAN-IS and HCT-IS were assessed in this test. The responses of the post extracted plasma QC samples (n=6) were equated with the response of analytes from neat (aqueous) standard samples at equivalent concentrations. It was assessed at low and high concentrations viz., CAN; 3.10 and 256.20 ng/mL, HCT; 3.12 and 262.07 ng/mL, whereas for the internal standards it was determined at a single concentration of 250 ng/mL.
Specificity
The specificity of the analyte was assessed by concealing six different batches of human blank plasma spiked with its contrary analyte.
Sensitivity
The sensitivity is determined by injecting six LLOQ samples from six different lots of human plasma and by spiking the concentration of HCT-ULOQ. The specificity of the HCT was determined by screening six different batches of human blank plasma spiked with CAN-ULOQ.
Recovery
The recovery of CAN, HCT, CAN-IS and HCT-IS was assessed by correlating the responses of the post
extracted plasma QC standard samples (n=6) with the response of neat samples at equivalent concentrations.
Calibration curve
A nine-point calibration curve (1.027, 2.567, 5.135, 10.27, 25.674, 51.348, 102.696, 205.392 and 302.047 ng/ mL for CAN and 1.044, 2.609, 5.219, 10.438, 26.095, 52.189, 104.378, 208.757 and 306.995 ng/mL for HCT) was plotted by taking the peak area ratio of each analyte:
internal standard against the nominal concentration of
calibration curve standards. Using the assessment of different weighing factors, the results were made to fit by linear regression analysis with the help of 1/X2 (X: concentration) weighting factor. The limit for calibration curve is to possess a correlation coefficient (r) of 0.99 or
more.
Precision and accuracy
For this study, six replicates containing CAN and HCT at five different QC levels were selected [for CAN: 1.08 (LLOQ), 3.087 (LQC), 35.079 (MQC1), 152.516 (MQC2) and 258.502 (HQC) ng/mL; for HCT: 1.092 (LLOQ), 3.121 (LQC), 35.466 (MQC1), 154.199 (MQC2) and 261.354 (HQC) ng/mL]. The inter-assay precision was assessed by monitoring the mentioned QC level samples on four different runs. The benchmark for the prominence of the data included accuracy within ±15% deviation (SD) and a precision of within ±15% relative standard deviation (RSD) except for LLOQ, where it should not exceed ±20% of SD.
Stability experiments
The stability of analytes and internal standards was assessed randomly by injecting replicate freshly prepared samples in autosampler after the initial injection. The
peak areas of the analytes and internal standard obtained
at initial run were marked as the reference to assess the
relative stability of the analytes at further stages. Stability
of analytes for benchtop study is performed at two different concentrations in six replicates. Freezer stability of the analytes for the biosamples was assessed by analyzing the QC samples stored at –70 °C±15°C. The stability of analytes in biomatrix following repeated freeze-thaw cycles (stored at –70 °C±15°C between cycles) was assessed using QC samples spiked with analytes. Samples were considered to be stable if assay values were within the acceptable limits of accuracy (i.e., ±15% SD) and
RESULTS
Liquid chromatography and mass spectroscopy
Method development using various solvents such
as acetonitrile and methanol, using different buffers such
as ammonium formate, ammonium acetate and formic
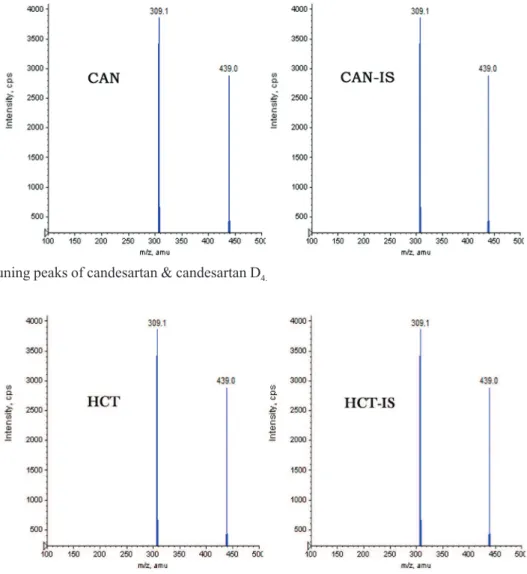
acid; changed flow-rates (0.1-1.5 mL/min) were tried for effective separation of analytes with good resolution. Finally, the desired resolution was accomplished with 5mM ammonium acetate: acetonitrile (25:75, v/v) at a flow rate of 1.0 mL/min, on Zorbax Eclipse XBD C18 (150 × 4.6 mm, 5 µm) column for the evaluation of electrospray response for CAN, HCT, CAN-IS and HCT-IS. In order to finalize ESI conditions for CAN, HCT, CAN-IS and HCT-IS, the assessment was carried out in negative ionization mode with MRM scan. The mass spectra for CAN, HCT, CAN-IS and HCT-IS observed peaks at m/z 439.00,
295.80, 443.00, and 301.80 respectively. The transition of
m/z 439.00 → 309.10 was used for quantification of CAN
and m/z 295.80 → 268.80 was used for quantification of
HCT. Similarly, for CAN-IS m/z 443.00 → 312.00 and
m/z 301.80 →m/z 274.90 was used for quantification of
HCT-IS was used for assessment purpose. Mass tuning
peaks are depicted in Figures 1 and 2.
The ideal combination of Zorbax Eclipse column usage and negative ion mode for quantification of CAN and HCT helped in achieving greater resolution of the peaks and also for concurrent quantification of both analytes with low LLOQ and shorter run time compared with the earlier
reported independent methods. Moreover, the employment of isotopic internal standards helped in achieving recovery values on the higher end compared to previous methods.
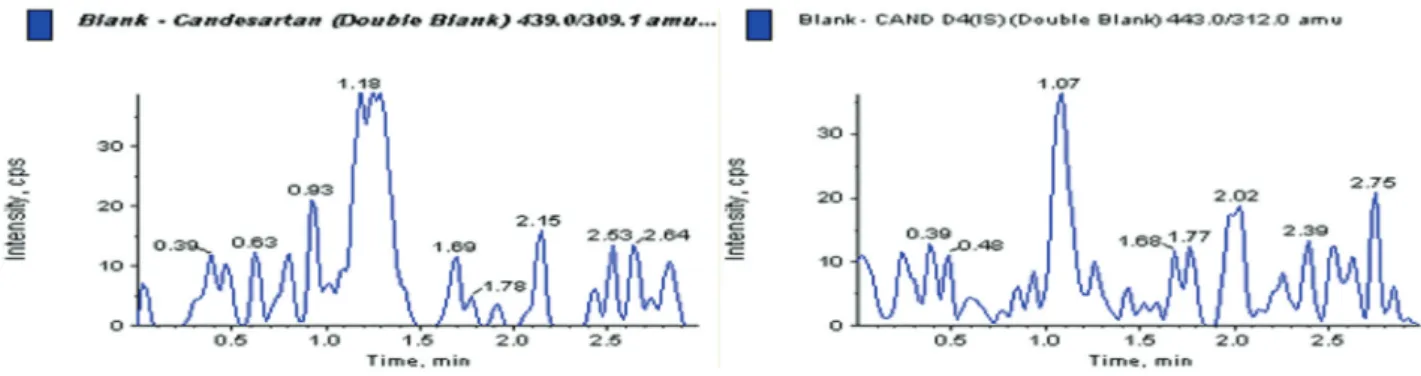
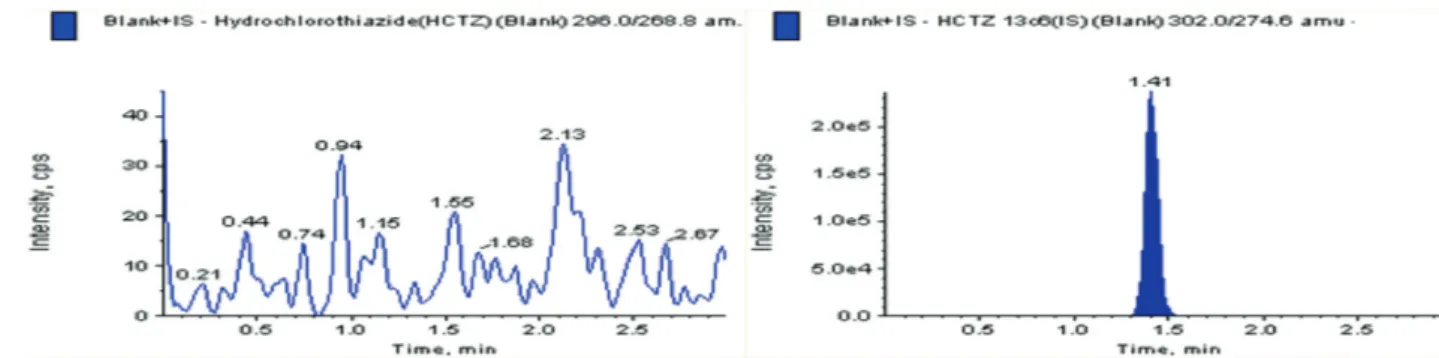
Matrix effect, specificity and sensitivity
Interferences were not observed at the retention times of the analytes when the blank plasma samples
FIGURE 1 - Mass tuning peaks of candesartan & candesartan D4.
from different lots were injected into the system. Under sensitivity studies, the %CV value was found to be 6.53 which is acceptable as per the guidelines. The average matrix factor values calculated are 1.060 for CAN and 1.033 for HCTZ at LLOQ QC and HQC concentrations. Significant peaks were absent at the retention times of analytes and no change in peak areas of the analytes was observed which indicates very less effect of plasma extract on the ionization of analytes and internal standards.
A representative chromatogram for the control
human plasma (free of the analyte and IS) and human plasma spiked with CAN, HCT, CAN-IS, HCT-IS at LLOQ are shown in Figure 3 to Figure 8 respectively. No
interfering peaks from interfering compounds are observed
at the retention times of analytes and IS. The retention time
of CAN and CAN-IS was 1.10 min and HCT and HCT-IS was 1.40 min. respectively. The total chromatographic run time was 3.0 min.
Recovery
Recovery was evaluated for each analyte at HQC concentration and the response in terms of peak area was employed for the calculations. Recovery was found to be to be 98.86%±1.17% and 99.72%±1.40% for CAN and HCT respectively. The recovery of CAN-IS and HCT-IS was 96.95%±3.69% and 100.55% ±2.10%. The results obtained in recovery studies were tabulated in Table III.
FIGURE 4 - Representative chromatogram of blank plasma sample-HCT.
FIGURE 5 - Representative chromatogram of blank plasma sample with CAN- IS.
Calibration curve
The calibration curve plotted shows outstanding recovery in the entire calibration range. The plot was drawn by taking peak-area ratios (peak area analyte/peak area IS) on x-axis and concentration on y-axis considering their best fit using weighing factor (1/x2). The mean regression (n=4) was found to be >0.995. The lowest concentration with the RSD<20% was taken as LLOQ and was found to be 1.080 and 1.092 ng/mL for CAN and HCT respectively. The %accuracy calculated for the mean of back-calculated concentrations for five calibration curves for CAN and HCT was within 97.54-99.78 and 97.39-100.67, respectively; while the precision (%CV) values diverse from 7.06-7.02 and 1.49-4.39 for CAN and HCT, respectively.
FIGURE 6 - Representative chromatogram of blank plasma sample with HCT-IS.
FIGURE 7 - Representative chromatogram of standard CAN (LLOQ sample).
FIGURE 8 - Representative chromatogram of standard HCT (LLOQ sample).
TABLE III - Recovery and matrix effect of CAN and HCT QC
samples
Analyte ID
QC sample (ng/mL)
n=6
% Recovery IS normalized matrix factor
CAN LQC 3.087 99.78±7.06 1.060±6.12
MQC 152.516 99.26±2.01
---HQC 256.523 95.54±3.41 0.985±1.26
CAN-IS ---- 250 96.95±3.69
---HCT LQC 3.121 98.31±3.92 1.033±5.98
MQC 154.199 101.11±2.24
---HQC 261.354 99.73±3.21 1.015±0.86
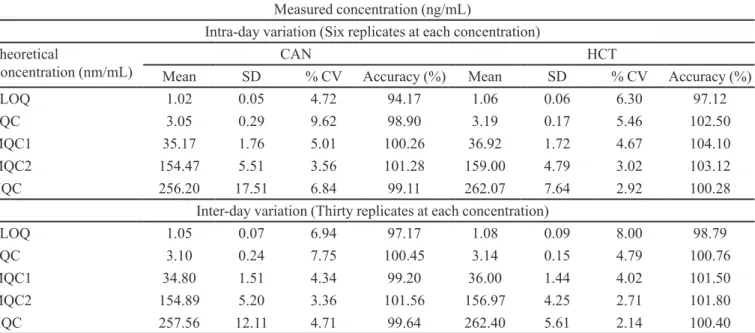
---Accuracy and precision
Accuracy and precision data for intra-day and
inter-day plasma samples for CAN and HCT are presented in Table IV. The assay values on both the occasions (intra and inter-day) were found to be within the accepted variable
limits.
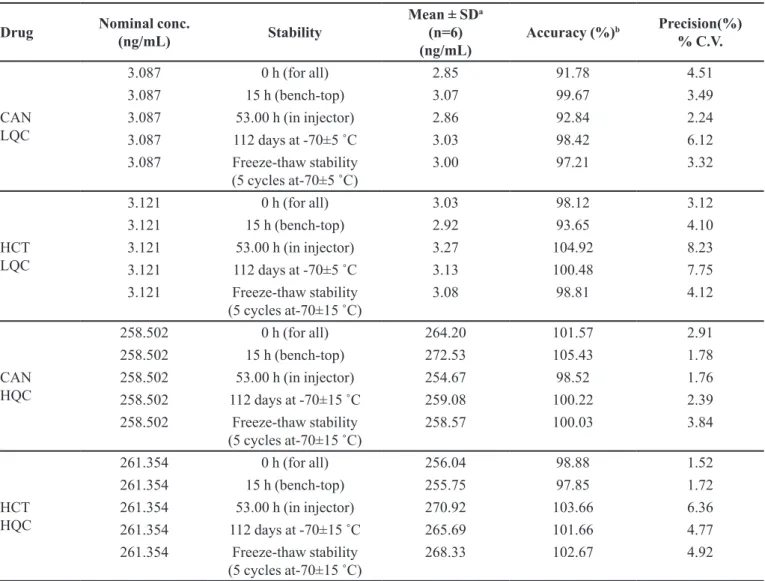
Stability
The selected concentrations for CAN and HCT at LQC and HQC deviated within ±15% of the average concentrations in a series of stability tests viz., 53.00 h (in-injector), 15.00 h (bench-top), and for 112 days freezer stability at –70 °C±15°C (Table V).
DISCUSSION
Several methods have been reported for the
estimation of CAN and HCT using LC-MS/MS. Till date, no LC-MS/MS method was reported for the simultaneous
determination of these drugs using isotopic internal
standards. It is always recommended to select an internal standard with close chemical properties to have effective extraction and recovery values. Bearing this fact in mind, we have selected isotopic internal standards for both the
drugs. In addition, the earlier reported methods have got
fewer recovery values due to the employment of regular extraction procedures.
It was indeed an essence in optimizing
chromatographic conditions, mass spectrometric
parameters and extraction techniques to develop
a selective, sensitive and rapid assay method for
simultaneous determination of CAN and HCT in human plasma. Under mentioned conditions, CAN, HCT, CAN-IS and HCT-CAN-IS exhibit a high sensitivity in negative
ion detection mode rather than positive ion detection
mode. The final composition of mobile phase was 5mM ammonium acetate: acetonitrile (25:75, v/v), both analytes and their internal standards got good responses with the possible best peaks and eluted within 3 minutes. The
method got all the validation parameters in limits and has got greater recovery values compared to earlier reported methods.
CONCLUSION
A highly sensitive, specific, reproducible and
high-throughput LC- MS/MS bioanalytical method was developed and validated to quantify CAN and HCT
simultaneously in human plasma. This method could
be used to characterize the concentrations of CAN and HCT in pharmacokinetic studies. We believe that the LC-MS/MS method presented by us has got good merits
over the earlier reported methods. Advantages of the
current method is less sample volume, utilizes simple extraction method and enables simultaneous estimation of combination drugs; hence we believe that the future
TABLE IV - Intra and inter-day precision of CAN and HCT QC samples
Measured concentration (ng/mL)
Intra-day variation (Six replicates at each concentration)
Theoretical
Concentration (nm/mL) Mean SD CAN% CV Accuracy (%) Mean SD HCT% CV Accuracy (%)
LLOQ 1.02 0.05 4.72 94.17 1.06 0.06 6.30 97.12
LQC 3.05 0.29 9.62 98.90 3.19 0.17 5.46 102.50
MQC1 35.17 1.76 5.01 100.26 36.92 1.72 4.67 104.10
MQC2 154.47 5.51 3.56 101.28 159.00 4.79 3.02 103.12
HQC 256.20 17.51 6.84 99.11 262.07 7.64 2.92 100.28
Inter-day variation (Thirty replicates at each concentration)
LLOQ 1.05 0.07 6.94 97.17 1.08 0.09 8.00 98.79
LQC 3.10 0.24 7.75 100.45 3.14 0.15 4.79 100.76
MQC1 34.80 1.51 4.34 99.20 36.00 1.44 4.02 101.50
MQC2 154.89 5.20 3.36 101.56 156.97 4.25 2.71 101.80
HQC 257.56 12.11 4.71 99.64 262.40 5.61 2.14 100.40
TABLE V - Stability data of CAN and HCT quality controls in human plasma
Drug Nominal conc.
(ng/mL) Stability
Mean ± SDa
(n=6) (ng/mL)
Accuracy (%)b Precision(%)
% C.V.
CAN LQC
3.087 0 h (for all) 2.85 91.78 4.51
3.087 15 h (bench-top) 3.07 99.67 3.49
3.087 53.00 h (in injector) 2.86 92.84 2.24
3.087 112 days at -70±5 ˚C 3.03 98.42 6.12
3.087 Freeze-thaw stability
(5 cycles at-70±5 ˚C) 3.00 97.21 3.32
HCT LQC
3.121 0 h (for all) 3.03 98.12 3.12
3.121 15 h (bench-top) 2.92 93.65 4.10
3.121 53.00 h (in injector) 3.27 104.92 8.23
3.121 112 days at -70±5 ˚C 3.13 100.48 7.75
3.121 Freeze-thaw stability
(5 cycles at-70±15 ˚C) 3.08 98.81 4.12
CAN HQC
258.502 0 h (for all) 264.20 101.57 2.91
258.502 15 h (bench-top) 272.53 105.43 1.78
258.502 53.00 h (in injector) 254.67 98.52 1.76
258.502 112 days at -70±15 ˚C 259.08 100.22 2.39
258.502 Freeze-thaw stability
(5 cycles at-70±15 ˚C) 258.57 100.03 3.84
HCT HQC
261.354 0 h (for all) 256.04 98.88 1.52
261.354 15 h (bench-top) 255.75 97.85 1.72
261.354 53.00 h (in injector) 270.92 103.66 6.36
261.354 112 days at -70±15 ˚C 265.69 101.66 4.77
261.354 Freeze-thaw stability
(5 cycles at-70±15 ˚C) 268.33 102.67 4.92
aBack-calculated plasma concentration; b(Mean assayed conc. At 0 h) X 100
bioanalytical methods would utilize this method for estimation of CAN and HCT in various biological matrices with little or no modification.
REFERENCES
Annapurna MM, Narendra A, Ravi KK. Liquidchromatographic method for the simultaneous quantitative determination of candesartan cilexetil and hydrochlorthiazide in pharmaceutical dosage forms. J Drug Del Ther. 2012;2(2):48-54.
Balamuralikrishna K, Syamasundar B. Development and validation of high performance liquid chromatographic method for the simultaneous estimation of candesartan cilexetil and hydrochlorothiazide in combined tablet dosage form. Der Pharm Chem. 2010;2(6):231-237.
Be SK, Arun M, David RO,Kin KH. Column-switching high performance liquid chromatographic (HPLC) determination of hydrochlorothiazide in rat, dog and human plasma.Pharm Res. 1990;7(12):1257-1261.
Bharathi DV, Hotha KK, Chatki PK, Satyanarayana V,Venkateswarlu V. LC-MS/MS method for simultaneous estimation of candesartan and hydrochlorothiazide in human
plasma and its use in clinical pharmacokinetics. Bioanal.
2012;4(10):1195-1204.
Brushinina OS, Gurto RV, Timofeev MS, Frelikh GA, Slepichev VA, Yanovskaya EA, et al. Determination of candesartan andhydrochlorothiazide in human plasma by HPLC coupled with mass spectrometry. Int J Anal Mass Spec Chrom. 2014;2(2):25-32.
Erk N. Application of First Derivative UV-spectrophotometry
and ratio derivative spectrophotometry for the simultaneous
determination of candesartan cilexetil and hydrochlorothiazide. Pharmazie. 2003a;58(11):796-800.
Erk N. Simultaneous analysis of candesartan cilexetil and hydrochlorothiazide in human plasma and dosage forms using hplc with a photodiode array detector. J LiqChromRel Tech. 2003b;26(15):2581-2591.
International Conference on Harmonization.ICH.Q2B, validation of analytical procedures methodology.1997, 62, US FDA Federal Register. Geneva, Switzerland: ICH; 1997.
International Conference on Harmonization.ICH.International Conference on Harmonizationof technical requirements for registration of pharmaceuticals for human use (ICH) guideline
on validation of analytical procedure-methodology: Geneva,
Switzerland; 1996.
Narendra D, Satyanarayana T, Ganga RB. Simultaneous
determination of candesartan and hydrochlorothiazide in combined pharmaceutical dosage form by new RP-HPLC method. Res J PharmBioChem Sci. 2012;3(1):270-278.
Naseem AC, Mohammad B, Enas A,Khalid IH. Determination of candesartan cilexetil in tablet dosage forms and dissolution
testing samples by first derivative uv spectrophotometric method. Anal Lett. 2009;42(14):2232-2243.
Qutab SS, Razzaq SN, Ashfaq M, Shuja ZA, Khan IU. Simple
and sensitive LC–UV method for simultaneous analysis of hydrochlorothiazide and candesartan cilexetil in pharmaceutical formulations.Acta Chrom. 2007;19:119-129.
Richter K, Oertel R, Kir W. New sensitive method for the determination of hydrochlorothiazide in human serum by high-performance liquid chromatography with electrochemical detection.J Chrom A. 1996;729(1-2):293-296.
Singh B, Lokhandae RS, Dwivedi A, Sharma S, Dubey N.Improved simultaneous quantitation of candesartan and hydrochlorthiazide in human plasma by UPLC-MS/MS and its application in bioequivalence studies. J Pharm Anal. 2014;4(2):144-152.
Surbhi M, Ravi PS, Rajkamal P, Saranjit S. LC and LC-MS/TOF studies on stress degradation behaviour of candesartan cilexetil.J Pharm Biomed Anal. 2010;52(3):345-354.
The Merck Index.14th edition.Whitehouse Station, NJ:Merck Research Laboratories Division of Merck and Co. Inc.; 2006; p. 1742, 4785
Veeranjaneyulu D, Aneesha A,Nandakishore A. Stability indicating RP-HPLC method for the simultaneous determination of candesartan cilexetil and hydrochlorothiazide in bulk and dosage forms. Indian J Rese Pharm Bio. 2012;1(5):720-724.
Zendelovska D, Stafilov T,Milosevski P. Development of solid-phase extraction method and its application for determination of hydrochlorothiazide in human plasma using HPLC. Bio Chrom. 2004;18(2):71-76.
Received for publication on 27th June 2017