24 > 27 June 2015
Faro - Portugal
University of Algarve
Faculty of Sciences and TechnologyConference on Technology
in Mathematics Teaching
ConFerenCe ProCeedIngs
Nélia Amado and Susana Carreira (Editors)12th International Conference on Technology
in Mathematics Teaching
Conference Logo: Susana Carreira
Cite as:
Amado, N. & Carreira, S. (Eds.). (2015). Proceedings of the 12th
International Conference on Technology in Mathematics Teaching.
University of Algarve, Faro, Portugal.
Website: http://ictmt12.pt/
The Proceedings are available at http://hdl.handle.net/10400.1/6081
Editors: Nélia Amado & Susana Carreira Publisher: Universidade do Algarve
Faro, Portugal, 2015
Copyright @2015 left to Authors ISBN 978-989-8472-68-7
Cover design: Ludovico Silva
474
THE SUPPORT OF THE SPREADSHEET IN THE LEARNING OF THE
TOPIC QUADRATIC EQUATIONS
Sandra Nobre*, Nélia Amado** and João Pedro da Ponte***
* Unidade de Investigação do Instituto de Educação, Universidade de Lisboa; Bolseira da FCT & Agrupamento de Escolas Professor Paula Nogueira; ** FCT, Universidade do Algarve & Unidade de Investigação do Instituto de Educação, Universidade de Lisboa, *** Instituto de Educação, Universidade de
Lisboa, Portugal
sandraggnobre@gmail.com, namado@ualg.pt, jpponte@ie.ulisboa.pt
In this paper we analyse the role of the spreadsheet in the development of algebraic thinking of grade 9 students in the study of 2nd degree equations. The research aims are (i) to understand how students approach their tasks in the spreadsheet, i.e., which representations they use and how they coordinate them, and (ii) the extent to which using spreadsheets in conjunction with working with paper and pencil, influences the development of algebraic thinking, particularly in the use of more formal (algebraic) language. Data analysis focuses on the productions and dialogues of a student while solving tasks with the spreadsheet in the classroom. The spreadsheet, articulated with working with paper and pencil, was important to the student’s developing of her algebraic thinking in this topic, boosting the use of a more formal language.
Keywords: algebraic thinking; spreadsheet; mathematical representations; quadratic equations; formal methods
INTRODUCTION
The algebraic language “is the only system that offers opportunity to logically investigate, justifiy, generalize and prove mathematical hipotheses” (Panasuk, 2010), p. 253). However, for a large number of students this language remains an obstacle when they are expected to use it. The spreadsheet is widely recognized as a very useful tool for introducing algebra and for developing algebraic thinking (e.g., Dettori et al., 2001; Rojano, 2002) as it promotes an understanding of relations of dependence between variables and encourages students to present algebraic methods rather than arithmetic methods (Rojano, 2002). Our perspective of algebraic thinking stresses the distinction between using algebraic notation and understanding algebraic structures, separated by a gap that is often underestimated. We suggest that this gap can be gainfully filled by working with suitable spreadsheet activities (Nobre, Amado & Carreira, 2012).
In this paper we analyse the role of the spreadsheet in the development of algebraic thinking of a grade 9 student during the study of 2nd degree equations. We focus on the mathematical representations that she used and seek to understand how the work on the spreadsheet, in conjunction with paper and pencil, influences her development of algebraic thinking, particularly in the use of a more formal language. This paper is part of a wider research project involving the study of various aspects of the development of algebraic thinking, like the learning algebraic formal methods, problem solving and mathematical representations. In this paper our focus is on mathematical representations.
MATHEMATICAL REPRESENTATIONS
Working with different types of representation appears to enhance learning, in that it allows students to develop a better understanding of mathematics (Clements, 1999; Goldin, 2002; Panasuk, 2010; Tripathi, 2008). Tripathi (2008) stresses that a comprehensive picture of a concept only
Proceedings of the 12th International Conference on Technology in Mathematics Teaching ICTMT12
Faro, Portugal, 24-27 June 2015
475
begins to emerge when the object it refers to is viewed from different perspectives. Thus the use of different representations can be understood as a variety of lenses which provide different perspectives and allow a broader and deeper understanding of a concept. The author notes that a discourse around the use of multiple representations can enrich the classroom culture and help students to actively participate in the learning process. In addition, she argues that students’ representations and their ability to transfer ideas from one representation to another are indicators of their understanding. And Abrahamson (2006) also suggests that classroom discussions are useful to help students understand the mathematical ideas associated with different representations.
Duval (2014) points out that one must identify a given object by means of different semiotic registers and examine, in particular, the transformation of representation registers. Following this recommendation, we analyse the transformations of representations used by a student, namely treatments (transformations within a register) and conversions (transformations that result in a representation in another register). According to Duval (2003), it is the conversion of representations of a mathematical object for another register that enables the construction of knowledge: “The originality of mathematical activity relies on the simultaneous mobilization of at least two registers of representation, or on the possibility to change at any time of register of representation” (p. 14). Yet, this is not a simple and immediate activity for most students. In general, when students work on a problem, they think of several registers at once, even when they favour just one register in the final production. This requires a continuous activity of conversion, which typically is not produced explicitly but implicitly and spontaneously.
In the work with paper and pencil, we consider the following registers of representations: natural language, numerical notation system (NNS), algebraic notation system (ANS), and pictorial and graphical representations. In the spreadsheet environment we consider: natural language, input of numerical values, formulas (variable-cell and variable-column), graphical representations and formatting means such as the colour highlighting of specific cells (Haspekian, 2005). In the study of representations in the spreadsheet we use the notions of conversion and treatment from Duval, which can be extended to representations created in this computational environment.
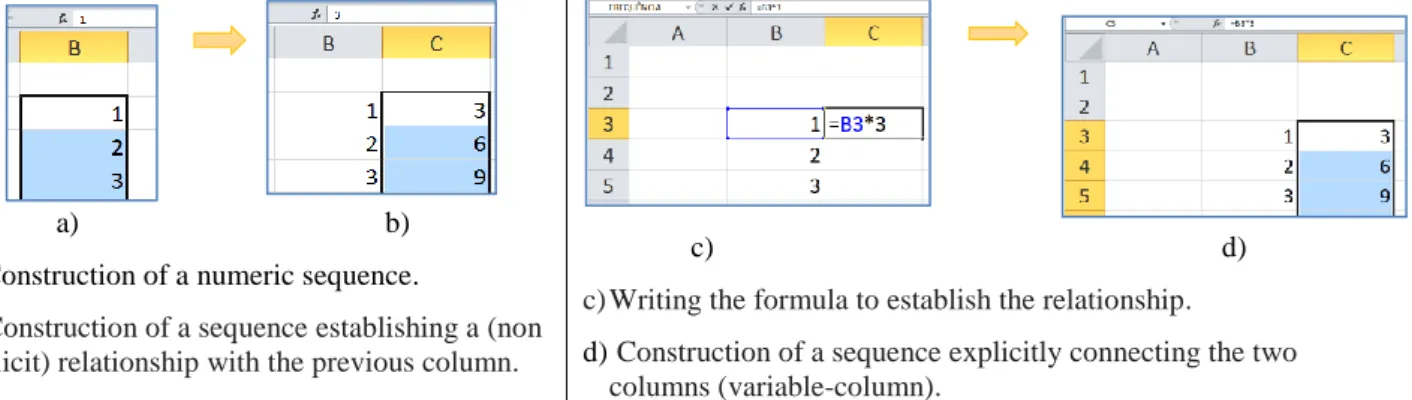
In figure 1 we show examples of treatments on the spreadsheet: the construction of a numeric sequence without using a formula or using a formula. The first case shows a linear sequence being constructed by dragging the handle of a set of cells. The same sequence may be produced by introducing a formula that establishes a relationship between the two columns. In the second case the introduction of the formula makes explicit the relationship between the two columns.
a) b) a) Construction of a numeric sequence.
b) Construction of a sequence establishing a (non explicit) relationship with the previous column.
c) d)
c) Writing the formula to establish the relationship.
d) Construction of a sequence explicitly connecting the two columns (variable-column).
476
Another relevant affordance of the spreadsheet is the conversion of tables into graphical representations.
THE STUDY OF SECOND DEGREE EQUATIONS
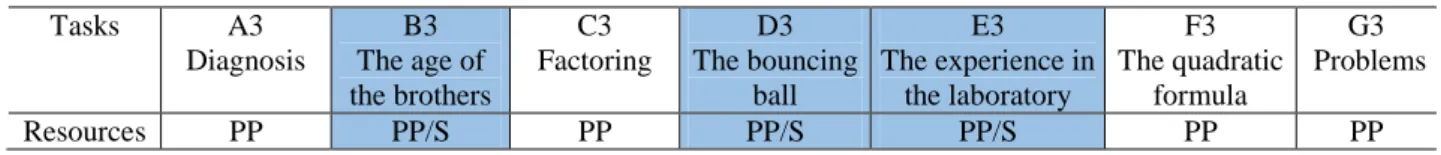
The Portuguese curricular guidelines determine that students solve quadratic equations by resorting to the square root operation, to the zero-product property and to the quadratic formula. The students must also be proficient in factoring, as well as in using the special cases of binomial multiplication. For the teaching of this topic a set of tasks was outlined, as presented in Table 1. The work on the spreadsheet was always accompanied by some questions to be solved with paper and pencil in order to promote an interaction between the use of these two resources.
Table 1. Tasks and main resources used throughout the study of the topic
Tasks A3 Diagnosis B3 The age of the brothers C3 Factoring D3 The bouncing ball E3 The experience in the laboratory F3 The quadratic formula G3 Problems Resources PP PP/S PP PP/S PP/S PP PP
Note: PP – Paper and pencil; S- Spreadsheet
In some of the problems solved with the spreadsheet, the use of graphical representations was suggested to promote a better understanding of the meaning of a quadratic function and its solutions. This is in line with Vaiyavutjamai and Clements (2006), who claim that students sometimes are capable to obtain the solutions of an equation like
xa
xb
0 but do not understand its meaning or what they stand for. Didis et al. (2011) corroborate this idea by stating that students have difficulty in understanding the meaning of symbols in 2nd degree equations On the other hand, they suggest that teachers should encourage students to use different techniques for solving 2nd degree equations as a way to improve students’ understanding of those equations.RESEARCH METHODS
In this study we aim to understand the contribution of the spreadsheet for students’ learning of 2nd degree equations. As we intend to obtain a holistic view of the researched phenomenon, we elected a qualitative research methodology. Given the nature of the study, the methodology draws on an interpretative paradigm because we want to study the phenomenon in all its complexity and in its natural context (Bogdan & Biklen, 1994). In this research we use a case study design, where the first author, assumes the dual role of teacher and researcher. The experience took 11 lessons of 90 minutes in a class of 9th grade with 24 students, aged between 14 and 18 years. Aida was chosen as case study, she has 14 years old and usually does not express difficulties in learning mathematics. Documentary data hold a relevant place as a prime source for obtaining information on the researched phenomenon. In the classroom, we collected the students’ productions, recorded the computer screens, audio-recorded their dialogues and took field notes from participant observation. The data analysis mainly involved content analysis (Bardin, 1977).
RESULTS
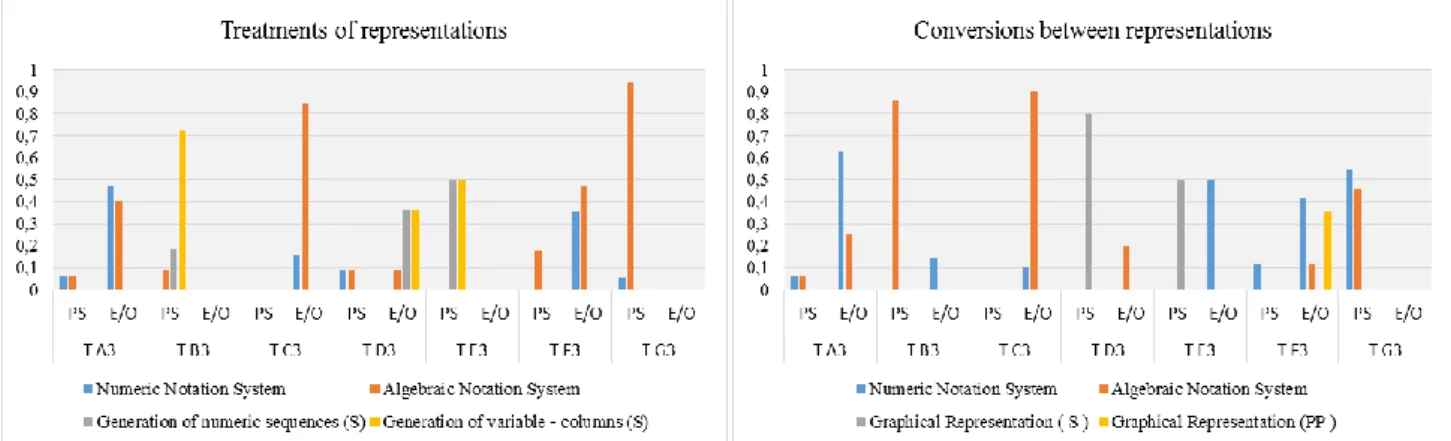
In the work of Aida on 2nd degree equations, a special attention was given to the transformation of representations carried out by the student. From this analysis two charts were produced: (i) one referring to treatments performed in NNS and ANS on the work with paper and pencil (PP) and on the generation of numeric sequences and variable-columns on the work with the spreadsheet (S), (ii)
Proceedings of the 12th International Conference on Technology in Mathematics Teaching ICTMT12
Faro, Portugal, 24-27 June 2015
477
the other referring to conversions of representations to the NNS and ANS, as well as to graphical representations (figure 2). The treatments and the conversions are grouped according to the different types of task (problem solving (PS), exercises/other (E/O).With paper and pencil, we observed an increase of treatments in ANS as result of a more intense work on manipulation of 2nd degree expressions and equations. With the spreadsheet, the treatments involved in the construction of numerical sequences and variable-columns did not present a significant increase. As for conversions, in the work with paper and pencil, initially the representations in NNS were most prevalent through calculations in assigning values to unknowns in algebraic expressions. Task B3, partially solved on the spreadsheet, was fundamental for converting to ANS with paper and pencil. In tasks D3 and E3, Aida performed conversions on the spreadsheet from the table to graphical representation that allowed perceiving the variation in parabolas with different types of concavity.
Figure 2. Summary of conversions and treatments (in percent) used by Aida
In the following, we present some excerpts of the work developed by Aida, by focusing on three tasks that she solved with the spreadsheet. Based on the student’s productions, we highlight aspects that have proved particularly relevant in her use of formal language.
In the task B3 it was proposed to solve a problem with the spreadsheet, as follows:
Carlos, Ana and Ricardo are three brothers. Ana is one year older than Carlos and one year younger than Ricardo. One day, Ana was making operations with the numbers corresponding to their ages and said to her brothers: I compared the product of your age with the square of my age and found something very interesting! See if you can also find it! What may Ana have discovered?
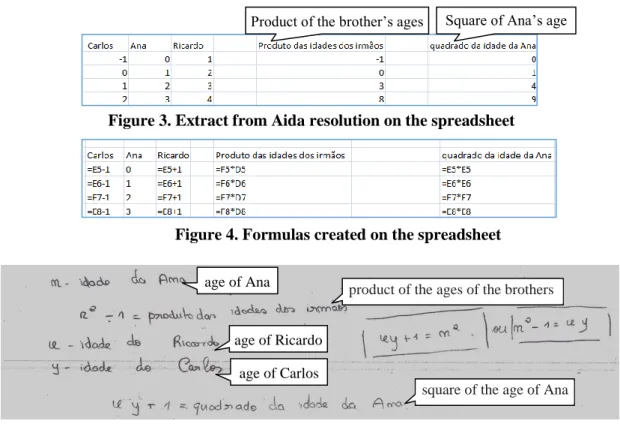
Aida started by identifying the relationship between the ages of the three persons, selected the age of Ana as an independent variable (column E) and generated a number sequence with an increment of 1 unit. Then she used the formulas “=E5-1” for the age of Carlos, and “=E5+1” for the age of Ricardo, thus generating variable-columns, dependent on the age of Ana. Later she entered the respective formulas for the “product of the brothers’ ages” and for the “square of the Ana’s age”, also generating variable-columns (figures 3 and 4).
These treatments on the spreadsheet provided by the dragging of cell handles led Aida to realise the variation in values in the different columns and to discover the relationship between the ages of the brothers, as she noted: “... if we add one unit to the product of the ages of the brothers, we obtain the age of Ana”. Afterwards, it was intended that students explained algebraically what they had concluded in the previous question. Therefore, it was required that students made the conversion of the relationship found in the spreadsheet into algebraic notation. Aida did not show explicitly the
478
relationship between the ages of the three brothers as she did not include the difference of the ages between them, as may be seen in Figure 5.
Figure 5. Answer of Aida to task B3
The student shows a caption with the meaning of the variables and writes equalities, which contain a mix of natural language and algebraic expressions. Finally, she presents two equivalent equations in response to the question. No student in the class expressed the expected algebraic relation, so it was necessary to encourage all students to rethink their answers, based on a solution from one of them. After some questioning about the relations between the three ages, and how they were expressed on the spreadsheet, the students arrived at the equality
a1
a1
a21. Then the teacher inquired the class about this equality. Aida was one of the students who did not understand it at the outset.It was then proposed that the students analysed the situation where the brothers would have an age difference of 5 years and Aida decided to use the spreadsheet. She found that the difference would then be 25. Finally, it was suggested the situation where the age difference would be k. The students no longer turned to the spreadsheet:
Teacher: If the age difference between them, rather than one, or rather than 5, is equal to k, what will happen?
Aida and Carlos: a2k2[simultaneous answer]. Others: ak times ak equalsa2k2. Pedro: Just replace 5 by k.
The discussion led the students to the generalization of the condition they had found earlier. The solution of this task encouraged the students to do the conversion of the formulas used on the
age of Ana product of the ages of the brothers
age of Carlos age of Ricardo
square of the age of Ana Figure 4. Formulas created on the spreadsheet
Product of the brother’s ages Square of Ana’s age
Proceedings of the 12th International Conference on Technology in Mathematics Teaching ICTMT12
Faro, Portugal, 24-27 June 2015
479
spreadsheet to algebraic language. Although Aida showed some lack of clarity in writing the required expression, this difficulty disappeared with the whole class discussion. In addition, the variation of the age difference helped Aida as well as other students in realizing that the initial expression could be generalized.
In task D3, also to be solved with the spreadsheet, the students were asked to represent the trajectory of a ball that was thrown vertically upwards at various moments and bounced several times on the floor. Several algebraic expressions for the height of the ball were given as functions of time: A
t 20t2160t, B
t 20t2120t, C
t 20t280t, and D
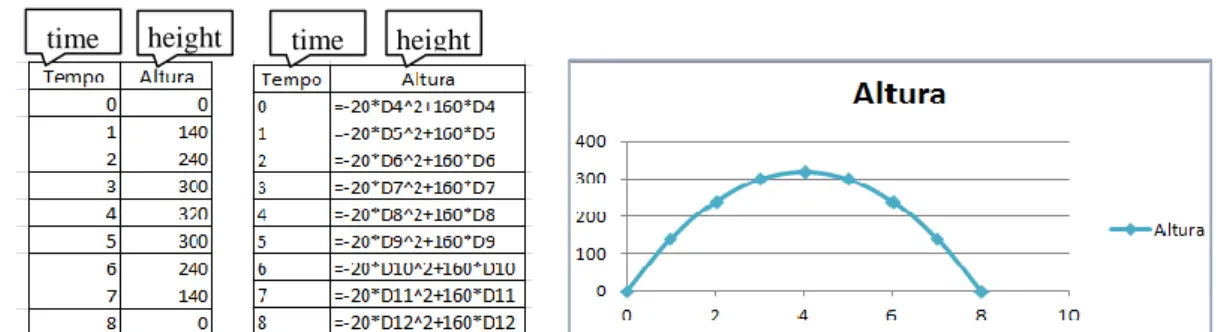
t 20t240t. The first question asked for the simulation on the spreadsheet of the first bounce of the ball, and also for its graphical representation. Aida began to insert the values for the time through a numerical sequence of increment 1. In the column for the height of the ball, she entered the calculation “=-20*0^2+160*0” in the first cell, the calculation “=-20*1^2+120*1” in the second cell, the calculation “=-20*2^2+80*2” and finally the calculation “=-20*3^2+40*3”. Therefore, in each cell she changed the formula and the value for time. Her representation was indicative of a still unclear understanding of the task, since she was using the algebraic expressions of the functions for the several balls being thrown upwards. After some clarification from the teacher, Aida generated a variable-column for the height of the ball, as shown in Figure 6. Then the student created a graph-plot with the spreadsheet.Figure 6. Table and graphical representation obtained by Aida for the first throwing of the ball
This conversion of the table to the graphical representation in the spreadsheet allowed the student to relate the table values with the graphical representation. This was her first contact with the graph of a parabola. The subsequent questions combined the work done on the spreadsheet with written work on paper, namely to find the maximum height of the ball and the time when it was reached, followed by a question on the time elapsed until the ball touched the ground.
Another question asked for the t values that would satisfy the conditionA
t 0and for its meaning in the context of the problem. Aida did not show difficulty in interpreting the condition. During the discussion, the teacher also asked the students to justify algebraically the values of t obtained. Unlike most students in the class, Aida quickly solved the equation correctly using the zero-product law, as shown inFigure 7. The teacher eventually reinforced the connection Figure 7. Answer of Aida
480
between the representations that the students had before them (the numerical table, the graph and the algebraic representation) to facilitate the understanding of the meaning of the solution of the equation:
Teacher: You have already
answered this question by looking at the table and observing the graph. Now, you have an algebraic resolution... In your graph where does the parabola intersects the x-axis?
Students: At 0 and 8.
Teacher: So this means that 0 and 8 are the solutions of the equation you have here.
The next question asked the t values so thatA
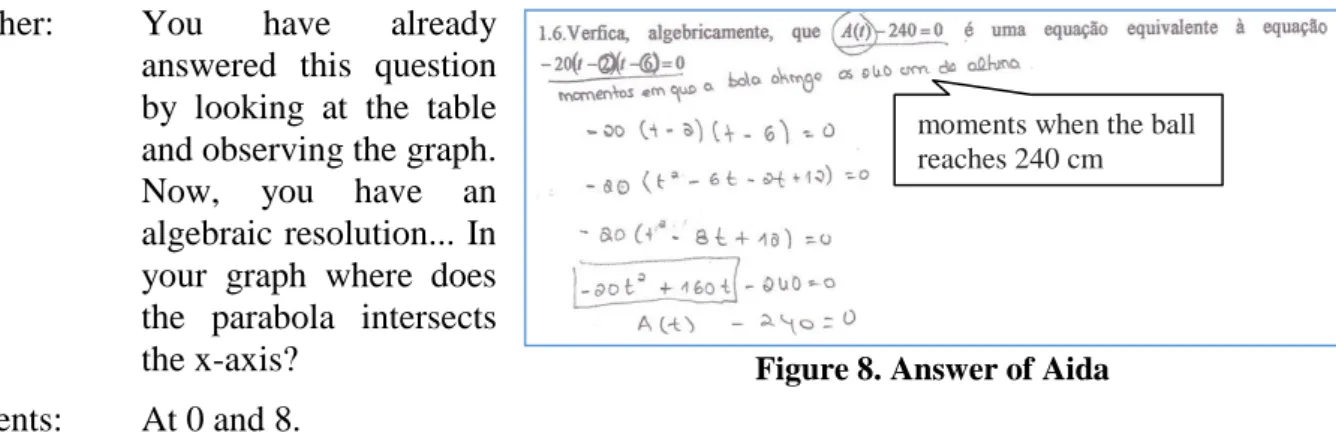
t 240. After that, the students had to show, algebraically, that the equationA
t 2400 is equivalent to 20
t2
t6
0.Many students showed difficulty in solving the question and some initially could not do it. Aida managed to solve it until the penultimate step (Figure 8). Given the difficulties of a few students, the teacher took one of their solutions on the board and explained that it is possible to write a quadratic equation as a product of factors, making its solutions visible, on the form
xr1
xr2
0c , where c is a constant and r1 an r2 are the roots.
Task E3 was carried out using both the spreadsheet and paper and pencil. In this case, an algebraic expression represented the temperature of a substance as a function of time and its graph was a parabola. Aida did not show difficulty in solving this task. As in the previous case, the determination of the output of a given input was requested and vice versa, and also their
interpretation within the context of the problem. In this task, Aida used a procedure on the spreadsheet similar to that she had already used in task D3 and she noticed that this time the parabola was facing upwards (figure 9). There were also questions about the value of the initial and final temperature of the substance, for interpreting the values in the table and in the graph created on the spreadsheet, which Aida had no difficulty in answering.
From task F3 on, the students learned and applied the quadratic formula. An interview with Aida, involving solving problems and exercises on the topic, was carried out at the end of the teaching experiment. Aida resorted to conversions to ANS for writing 2nd degree equations and for converting to NNS in calculations associated with the assigning of values, and in particular, with the use of the quadratic formula. Throughout the study, we found that problem solving was an essential activity that promoted conversions to ANS, especially in translating problems into 2nd degree equations, which is important on the learning of this topic.
Figure 9. Results of Aida Figure 8. Answer of Aida
moments when the ball reaches 240 cm
Proceedings of the 12th International Conference on Technology in Mathematics Teaching ICTMT12
Faro, Portugal, 24-27 June 2015
481
FINAL REMARKS
The proposed tasks encouraged the establishment of connections between the work with the spreadsheet and the work with pencil and paper. The spreadsheet allowed a first approach to the graphical representation of a quadratic function. This representation, in parallel with the tabular representation, and with representations in natural language, allowed Aida to understand the meaning of solving a 2nd degree equation even before the formal learning of the algebraic method, as suggested by research on the role and effectiveness of multiple representations (Clements, 1999; Goldin, 2002; Panasuk, 2010; Tripathi, 2008).
It is also worth noting the results obtained by Aida with pencil and paper, using formal algebraic language, especially in solving equations. The kind of connections that were encouraged and motivated was essential to the development of her algebraic thinking in line with the findings highlighted by Dettori et al. (2001) and by Nobre, Amado & Carreira (2012). The work in these two environments provided her the basis for understanding the meaning of factoring a 2nd degree equation based on its roots. According to Vaiyavutjamai and Clements (2006) and Didis et al. (2011), the students should solve tasks that lead to the understanding of meanings rather than merely to applying memorized procedures. The conversions performed both on the spreadsheet and from the spreadsheet into algebraic notation were pivotal to the development of the algebraic knowledge of Aida, in line with Duval’s (2014) ideas.
We conclude by emphasizing that the environment provided by the spreadsheet proved suitable for the development of the algebraic thinking of Aida, in her learning of 2nd degree equations, without the constraint of using symbolic algebra from the very beginning. Moreover, the conversions carried out contributed to her understanding of the meaning of the symbolic algebraic work carried out with paper and pencil.
REFERENCES
Abrahamson, D. (2006). Mathematical representations as conceptual composites: Implications for
design. Paper presented at the 28th Annual Meeting of the North American Chapter of the International Group for the Psychology of Mathematics Education, Merida, Mexico.
Bardin, L. (1977). Análise de conteúdo. Lisboa: Edições 70.
Bogdan, R., & Biklen, S. (1994). Investigação qualitativa em educação – uma introdução à teoria e
aos métodos. Porto: Porto Editora.
Clements, D. H. (1999). 'Concrete' manipulatives, concrete ideas. Contemporary Issues in Early
Childhood, 1(1), 45-60.
Dettori, G., Garuti, R., & Lemut, E. (2001). From arithmetic to algebraic thinking by using a spreadsheet. In R. Sutherland, T. Rojano, A. Bishop, & R. Linz (Eds). Perspectives on school
algebra (pp. 191-208). Dordrecht, The Netherlands: Kluwer.
Didiş, M., Baş, S., & Erbaş, A. (2011). Students’ reasoning in quadratic equations with one unknown. In M. Pytlak, E. Swoboda, & T. Rowland (Eds.), Proceedings of the 7th Congress of the European Society for Research in Mathematics Education (pp. 479-489). Rzeszów, Powland:
ERME.
Duval, R. (2003). Registros de representação semiótica e funcionamento cognitivo da compreensão em matemática. In S. D. A. Machado (Org.). Aprendizagem em matemática: Registros de
482
Duval, R. (2014). Comment analyser le problème crucial de la compréhension des mathématiques?
Revista Iberoamericana de Educácion Matemática, 37, 9-20.
Goldin, G. (2002). Representation in mathematical learning and problem solving. In L. D. English (Ed.), Handbook of international research in mathematics education (pp. 197-218). Mahwah, NJ: Lawrence Erlbaum.
Haspekian, M. (2005). An ‘instrumental approach’ to study the integration of a computer tool into mathematics teaching: The case of spreadsheets. International Journal of Computers for
Mathematical Learning, 10(2), 109-141.
Nobre, S., Amado, N., & Carreira, S. (2012). Solving a contextual problem with the spreadsheet as an environment for algebraic thinking development. Teaching Mathematics and its Applications,
31, 11-19.
Panasuk, R. (2010). Three-phase ranking framework for assessing conceptual understanding in algebra using multiple representations, Education, 131(4), 235-257.
Rojano, T. (2002). Mathematics Learning in the Junior Secondary School: Students’ Access to Significant Mathematical Ideas. In L. English, M. B. Bussi, G. A. Jones, R. A. Lesh, & D. Tirosh (Eds.), Handbook of international research in mathematics education (vol. 1, pp. 143-161). Mahwah, NJ: Lawrence Erlbaum.
Tripathi, P. (2008). Developing mathematical understanding through multiple representations.
Mathematics Teaching in the Middle School, 13(8), 438-445.
Vaiyavutjamai, P., & Clements, M. A. (2006). Effects of classroom instruction on students’ understanding of quadratic equations. Mathematics Education Research Journal, 18(1), 47-77.