no âmbito do projeto PEst-OE/EGE/UI0031/2014 Número avulso
Portugal 7,5 € Outros países 15 € Condições de assinatura bienal
Portugal: 20 € Outros países: 40 € ISSN 0872-4733 ISSN Digital 2183-203X DOI https://doi.org/10.14195/2183-203X_49 Depósito Legal 64932/93
António Afonso (ISEG, Universidade de Lisboa; [email protected]) Óscar Afonso (Faculdade de Economia, U. Porto; [email protected]) João Ferreira do Amaral (ISEG, Universidade de Lisboa; [email protected])
João Sousa Andrade (Faculdade de Economia, U. Coimbra; [email protected]) Manuela Arcanjo (ISEG, Universidade de Lisboa; [email protected]) Miguel St. Aubyn (ISEG, Universidade de Lisboa; [email protected])
Rui Baptista (DEG-IST, U. Lisboa; [email protected]) Pedro Brinca (Nova School of Business and Economics; [email protected])
Anabela Carneiro (Faculdade de Economia, U. Porto; [email protected]) Filipe Coelho (Faculdade de Economia, U. Coimbra; [email protected]) João Paulo Costa (Faculdade de Economia, U. Coimbra; [email protected]) Rosa Branca Esteves (Escola de Economia e Gestão, U. Minho; [email protected])
Pedro Lopes Ferreira (Faculdade de Economia, U. Coimbra; [email protected]) José Rui Figueira (DEG-IST, U. Lisboa; [email protected]) Francisco Louçã (ISEG, Universidade de Lisboa; [email protected]) Jorge Braga de Macedo (Nova School of Business and Economics; [email protected])
José Pereirinha (ISEG, Universidade de Lisboa; [email protected]) Esmeralda Ramalho (ISEG, Universidade de Lisboa; [email protected]) Joaquim Ramalho (ISCTE, Instituto Universitário de Lisboa; [email protected])
Miguel Portela (Escola de Economia e Gestão, U. Minho; [email protected]) Miguel Torres Preto (DEG-IST, U. Lisboa; [email protected]) Pedro Nogueira Ramos (Faculdade de Economia, U. Coimbra; [email protected])
José Reis (Faculdade de Economia, U. Coimbra; ([email protected]) Miguel Sousa (Faculdade de Economia, U. Porto; [email protected])
Regulation and Economic Integration: Introduction •
7
Pedro Bação / Inês Gaspar / Marta Simões
Corruption and Economic Growth: The Case of Portugal •
11
Mattia Frapporti
The European Logistics Space: On Jean Monnet and the Integration of Europe •
35
Annette Bongardt / Francisco Torres
EU Trade and Regulation: Economic and Political Dynamics •
47
Article
Rafael Morales-Lage / Aurelia Bengochea-Morancho /
Inmaculada Martínez-Zarzoso
DOI: https://doi.org/10.14195/2183-203X_49_1
Regulation and Economic Integration: Introduction
Regulação e Integração Económica: Introdução
Luís Aguiar Santos
Alice Cunha
In any society and in any historical age, economic activities have been conditioned by the legal framework and by constraints of various kinds, first and foremost cultural ones. In a broad sense, some form of regulation of economic activities has always existed; thus, different conceptions and regulatory practices have followed each other in time or have been contemporaries in different societies with their own political-legal orders.
In a narrow sense, the regulation of economic activities is a recent framework (in historical terms) oriented towards a modern market economy integrated in multinational spaces and in need of rules. The previous endemic disorder in some economic spaces and discretionary forms of political interventionism in others have supposedly been replaced by a new paradigm of freedom regulated by specialized agencies in harmony with a limited, but vigilant, political power.
From both perspectives (the broad and the narrow) one can analyze the impact of the European Unionʼs single market and the World Trade Organization on the economies and regulatory practices of various states after a quarter of a century framing several different states in these two integrated economic spaces, one on a European scale and the other on a world scale.
Indeed, economic integration and regulation are two inseparable concepts and the European Union (EU) may be considered as the most advanced model to this regard. As it gathers 28 Member States and more than 510 million inhabitants in a single internal market, in which the free movement of goods, services, capital and persons is assured, and in which citizens are free to live, work, study and do business, the number of regulations is massive. As an example, only in 2019 (January to October), counting Regulations, Directives and Decisions, approved by the top three institutions (European Parliament, Commission and Council), a total of 298 legislative acts were adopted, plus 71 amended.1
The current Notas Económicasʼs thematic issue is an output of the Research Seminar “Governance, Regulation and Economic Integration” held at ISEG – Lisbon School of Economics and Management (University of Lisbon) on May 8, 2019, and gathers a selected number of papers that were delivered at the seminar, which will contribute to the study on regulation and economic governance in increasingly integrated geographical areas.
The purpose of that event was to gather, on an interdisciplinary basis, the results of ongoing research on economic regulation in the context of its integration into multinational spaces. Of these spaces, the EU and the World Trade Organization were the most obvious: the former, because it is one of the most relevant and structured bloc worldwide; the latter, because it is the organization that sets the normative framework for global trade, of which the EU is one of the main players.
The diversity of topics and approaches, which was also one of the aims of the seminar, as well as the complexity of regulation itself, are represented in this thematic issue. The articles prove the advantage of the multidisciplinary approach, in a topic that is simultane-ously economic and normative, but that also intersects with politics and culture, unfolding in different scales of analysis – from global, regional to national/local.
The institutional impact of economic integration from the perspective of corruption is analysed by Pedro Bação, Inês Gaspar and Marta Simões in the article “Corruption and economic growth: the case of Portugal”. The authors conclude the modest progress that has been achieved in reducing corruption in Portugal between 1980 and 2018, despite the countryʼs EEC/EU membership since 1986. Regardless of the effects of corruption on eco-nomic growth, this particular issue allows us to question the nonlinear relationship between economic integration, institutional convergence and governance between different Member States. Based on the Corruption Perceptions Index data for Portugal from Transparency International, and using VAR and SVAR models, the authors concluded that corruption can have a marginal effect on the output; however, such result would indicate that the limits of the Portuguese standard of livingʼs convergence with the EU average would have to be due to factors other than corruption. Therefore, we face an understanding of regulation in which the complexity of normative, institutional and even cultural factors is called for a broad understanding of the economic phenomenon in an integrated world.
From a seemingly different perspective, focused on aspects that we could situate within the scope of the “material civilization” (infrastructures, technology), Mattia Frapportiʼs article focus on “The European logistics space: on Jean Monnet and the integration of Europe”. The author argues that the establishment of the European Coal and Steel Community in 1951 is an event in the “structural continuity” of a logistical integration that preceded the major political landmarks of the European integration process. In fact, he identifies a long process of standardization of the main infrastructure networks in the European space (ap-parent on the railway), which took place during the two great wars of the twentieth century, and in which Jean Monnet had already played a pivotal role. Such an approach connects regulation to transport, communications and distribution networks that support the move-ment of people, goods and services.
Finally, the globalization of trade flows has led to a need for integration of the major trading blocs themselves such as the EU, ASEAN, NAFTA or MERCOSUR. The relationship between these complex political and/or economic organizations requires a closer look of the economic regulation focused on the political management of economic interests, public expectations and distinct normative traditions. Annette Bongardt and Francisco Torres, in their article “EU trade and regulation in todayʼs world trading system”, deal precisely with this from the EUʼs recent experience in negotiating treaties with other trading blocs, and where all those factors interfere. The authors argue that recent experience with EU treaty
negotiation shows the need to safeguard the “European values”; and that such a need, re-flected in the principles of environmental protection or consumer rights, is fundamental to the coherence and stability of the European project itself.
In fact, as the level of economic integration increases, so does complexity, which not only involves a set of numerous regulations, enforcement and arbitration mechanisms, but also political and civilizational issues, such as the abovementioned, which are at the core of the European integration project. To this regard, it will be interesting to follow the future results of both the Digital Single Market, already under implementation, and the upcoming Euro-pean Commissionʼs “Green Deal” project and the impact that they will have on regulation.
[email protected] DOI: https://doi.org/10.14195/2183-203X_49_2
Corruption and Economic Growth: The Case of Portugal
Corrupção e Crescimento Económico: O Caso Português
Pedro Bação
Inês Gaspar
Marta Simões
Received for publication: July 1, 2019 Revision accepted for publication: October 29, 2019 ABSTRACT
In this paper we investigate the impact of corruption on economic growth in Portugal over the period 1980-2018. The empirical approach makes use of a VAR model inspired by the standard Cobb-Douglas aggregate production function. The VAR model includes the capital stock, hours worked, total factor productivity and the corruption perceptions index (CPI) of Transparency International. The CPI combines several sources of information on the level of corruption in each country. The scale of this index goes from 0, the highest level of corruption, to 10, the lowest level. The magnitude of the estimated effect of corruption on economic growth in the unrestricted VAR model is large (and positive), but statistically not significantly different from zero. However, the results from the estimation of a structural VAR model with economically plausible long-run restrictions indicate modest gains from reducing corruption.
Keywords: Corruption; economic growth; Portugal; VAR model; SVAR. JEL Classification: D73: O11; O40; O52
RESUMO
Neste texto estudamos o impacto da corrupção sobre o crescimento económico em Portugal no período 1980-2018. A abordagem empírica emprega um modelo VAR inspirado pela função de produção Cobb-Douglas tradicional. O modelo VAR inclui o stock de capital, as horas de trabalho, a produtividade total dos factores e o índice de percepções da cor-rupção (CPI) da Transparency International. O CPI combina informação sobre o nível de corrupção de diferentes fontes para cada país. A escala do índice vai de 0, o nível mais alto de corrupção, a 10, o nível mais baixo. A magnitude do efeito estimado da corrupção sobre o crescimento económico no modelo VAR sem restrições é grande (e positiva), mas do ponto de vista estatístico não é significativamente diferente de zero. Contudo, os resultados da estimação de um modelo VAR estrutural com restrições de longo prazo plausíveis do
ponto de vista económico indicam que a redução da corrupção trará ganhos, ainda que relativamente modestos.
1. IntroductIon
By joining the European Economic Community – now the European Union (EU) – in 1986, after the political revolution of 1974 and the first steps as a democracy (following 48 years of dictatorship), Portugal became officially committed to the European integra-tion process, viewed as important in supporting the transiintegra-tion to a developed democracy and in achieving higher standards of living. European integration resulted in more policies and regulations moving from the national to the European level. It also led to the adop-tion of new models of governance, requiring more transparency and accountability, which were considered instrumental in reducing corruption. Nevertheless, in the 2017 Special Eurobarometer on Corruption, 92% of Portuguese respondents stated that corruption is a widespread problem in their country (EU average: 68%) and 42% said that they are per-sonally affected by corruption in their daily life (EU average: 25%). Additionally, 54% of Portuguese respondents believed corruption had become worse over the past three years (EU average: 43%). As for businesses’ attitudes towards corruption in the EU, 59% of businesses in Portugal stated that favouring friends and family members in public institutions is among the most widespread practices and 70% agreed that the only way to succeed in business is to have political connections. In its 2018 report released in January 2019, Transparency International (TI), a leading non-governmental organization in the anticorruption effort, places Portugal below the European average in its Corruption Perceptions Index (CPI), down one place in the world ranking from the 29th to the 30th position. At the economic level, despite some years of fast and above average economic growth (following EU acces-sion), since the beginning of the 21st century economic growth has been dismal, resulting in divergence from the average per capita income in the EU. A natural question that arises is thus whether the high relative levels of corruption can be partly responsible for the slowing down of output growth in Portugal.
But is good governance, and the consequent control of corruption, really important for promoting growth? The literature predicts two opposite effects of corruption on economic growth (Aidt, 2009; Ugur, 2014; Saha et al., 2017). According to Aidt (2009), Leff (1964) was one of the first authors to regard corruption as a driver of economic growth (the greasing the wheel hypothesis). The argument is that corruption allows economic agents to correct and avoid existing government failures (such as cumbersome and time-consuming regula-tions), and thus facilitates beneficial deals that would not take place in the absence of cor-ruption, which contributes to faster growth. On the other hand, authors such as Buchanan and Tullock (1962) argue that corruption creates inefficiencies rather than corrects them, which in turn hampers growth (the sanding the wheel hypothesis).
The sign of the relationship between corruption and economic growth is thus an empiri-cal issue. Here we address this issue for the case of Portugal over the period 1980-2018. We report estimates obtained using different approaches. Our preferred approach relies on a VAR model based on the Solow growth model, i.e., a VAR model that includes total factor productivity, capital and labour, besides a measure of corruption. Our main contribution is that we report estimates of the impact of corruption on economic growth in Portugal imposing the constraint that temporary shocks to corruption do not have long-run impacts on the level of the other variables in the VAR model and, consequently, on output. In other
words, our focus is on estimating the long-run effect of corruption on the level of output, in a framework that rules out implausible dynamics in that relation.
Previous literature highlights the fact that no “one-size-fits-all” implications can be derived in the case of this relationship. By focusing on a single country we overcome to some extent data comparability and parameter heterogeneity issues and are able to apply time series methodologies that allow us to identify the existence (or not) of a causal impact between corruption and the behaviour of output. Also, generalizing the results from panel data studies for each and every country in the sample may lead to the implementation of inadequate policies since if the link between corruption and growth is heterogeneous across countries, panel results may lead to misleading inference when, for instance, a large negative effect that applies to only one country offsets many small positive or non-existent effects that took place in other countries. Historical time series analyses of output dynamics are thus more likely to lead to appropriate conclusions with the aim of deriving policy implications for specific countries.
The paper is organized as follows. Section 2 gives a concise presentation of the theo-retical predictions on the sign of the relationship between corruption and growth, as well as a review of some recent empirical evidence. Section 3 introduces the data and describes the empirical strategy. Section 4 presents and discusses the results. Concluding remarks are given in section 5.
2. theoretIcal Background and recent FIndIngs
The literature that studies the relationship between corruption and economic growth from the theoretical point of view revolves around two main axes, the one that sees corrup-tion as a threat to economic growth, known as the ‘sanding the wheels’ hypothesis, and the other which poses that the nexus is positive, the ‘greasing the wheels’ hypothesis – see e.g. Aidt (2009), OECD (2013), Ugur (2014) and Campos et al. (2016). The negative impact of corruption on growth results from the inefficient resource allocations and distortions in economic policies associated with corruption. The former appear because corruption influ-ences the ability of private investors to evaluate the relative merits of different investment projects, and also because corruption influences decisions on how public funds are invested. For instance, Cieslik and Goczek (2018) develop an AK endogenous growth model with international capital mobility that predicts that corruption negatively affects the stock of international investment in the host country. Theoretical predictions favouring a positive impact of corruption on growth pose that corruption can help to develop businesses faster, bypassing inefficient regulations, increasing efficiency and growth in more bureaucratic and inefficient countries. Corruption is viewed as a “second best” solution, given the distortions caused by the malfunctioning of public institutions, with bureaucracy hampering invest-ment. Thus corruption can help only in situations where some aspects of good governance are absent and economic policy is inefficient (Aidt, 2009). For instance, Dzumashev (2014) develops a model that draws on the endogenous growth model of Barro (1990) where the public sector interacts with the private sector through taxation and public goods provision. The model predicts that the interaction between corruption and governance shapes the
efficiency of public spending, which in turn determines the growth effects of corruption. Specifically, corruption improves economic efficiency only when the actual government size is above the optimal level, implying that a growth-maximising level of corruption is possible. The model additionally predicts that the incidence of corruption declines with economic development. Reverse causation from economic growth to corruption is thus also possible as documented by the literature that investigates the determinants of corruption (Treisman, 2000, 2007; Pellegrini and Gerlagh, 2008). In a recent survey on the causes and effects of corruption, Dimant and Tosato (2018) find support for the argument that growth reduces corruption in the presence of strong institutions; however, it has no effect when institutions are weak. The OECD (2013) claims that only rich countries can afford high quality institu-tions and thus have low incidence of corruption. Tresiman (2000) had already argued that corruption will be lower in more developed countries, where citizens are more educated and the wages in public office higher.
The sign of the relationship between corruption and economic growth is thus an empiri-cal issue. This nexus has attracted a lot of attention in empiriempiri-cal research, an interest patent in two recent studies that use meta-analysis as a tool for synthesizing evidence on this topic. Ugur (2014) identifies 327 estimates of corruption’s direct effect on per-capita GDP growth from 29 studies. Ugur concludes that the results indicate that corruption has a negative ef-fect on per capita GDP growth, but the magnitude of the efef-fect is small and more adverse in low income countries. Campos et al. (2016) apply meta-regression analysis to a sample of 41 empirical studies encompassing 460 comparable estimates of the effect of corruption on growth. About 32 percent of those estimates support a significant and negative impact of corruption on growth, 62 percent suggest a statistically insignificant relationship, while approximately only 6 percent support a positive and significant relation. The authors find evidence of a true effect of corruption on growth, stronger in academic studies, with the large degree of heterogeneity in the results driven by authors’ affiliation (academics systematically report smaller and less negative effects), whether the estimation methodology controls for endogeneity and uses fixed-effects (increases the negative effect) and the inclusion in the model of trade and institutions (both tend to decrease the negative effect).
Recent empirical studies that investigate the corruption-growth nexus include Paul (2010), Farooq et al. (2013), Huang (2016), Chapsa, Tsanana and Katrakilidis (2015), D’Agostino, Dunne and Pieroni (2016), Saha, Malik and Vortelinos (2017) and Cieslik and Gozcek (2018).
Similar to the present study, Paul (2010) and Farooq et al. (2013) explore time series data for specific countries. Paul (2010) conducts a survey to build a corruption perceptions index for Bangladesh from 1972 to 2009 which is then used to investigate the direction of Granger causality between corruption and growth. The main conclusion is that corruption influences growth (from 1977 onwards), but the opposite does not apply, and that the sign of the relationship is positive, a result that the author interprets as an indication that the transition to a market economy initiated in Bangladesh in the late 70s was not accompanied by sufficient reforms at the public administration and legislative levels, making corruption a necessary means to promote private sector investment and in this way growth. Farooq et al. (2013) examine the nexus for Pakistan with data for the period 1987–2009. The results found using cointegration and VECM approaches indicate that there is a long run
relationship between the variables, with corruption, proxied by the CPI from Transparency International, hampering growth.
The remaining studies apply panel data methodologies taking advantage of both the cross section and time series dimension of the data. Applying time series methodologies adapted to a panel data context to determine the direction of causality, Huang (2016) investigates the corruption-growth nexus in thirteen Asia-Pacific countries over the period 1997–2013. The results show that the impact of corruption on growth is only significant for South Korea (and positive), while causality on the opposite direction was only found for China. Saha et al. (2017) use fixed effects and generalized method of moments (GMM) estimators to examine the non-linear effect of corruption on growth in a wide sample that includes 110 countries over the period 1984-2009. The authors find that the relationship is best described by an inverted U curve indicating that corruption is beneficial for growth at low levels of corruption but after a threshold (around 6, on a scale from 0, least corrupt, to 10, most corrupt, resulting from a rescaling of the ICRG corruption index) the effect is growth retarding. For a more restricted sample that includes only the fourteen older EU member states (ignoring Luxembourg) over the period 1995-2013, Chapsa et al. (2015) estimate a convergence regression that includes also a measure of corruption as an explanatory vari-able. The results obtained support the idea that for Greece, Ireland, Portugal and Spain, less corruption promotes growth.
D’Agostino et al. (2016) and Cieslik and Gozcek (2018) explore evidence on different transmission channels from corruption to growth. D’Agostino et al. (2016) estimate a growth regression for a panel of 106 countries and the results confirm the prediction that government investment spending enhances growth, while large military burdens, current government spending and high levels of corruption have negative effects. Additionally, the interactions between corruption and public investment and between corruption and military spending have strong negative impacts on growth: allowing for corruption makes the negative effect of military burden on growth stronger. Cieslik and Gozcek (2018) estimate a model where corruption hampers growth in an open economy by diverting international investment using data for 142 countries over the period 1994-2014. Less corruption was found both to have a positive and statistically significant impact on the growth rate of real per capita GDP and to increase investment.
To the best of our knowledge, the only previous study that attempts to quantify the impact of corruption on growth for Portugal is that of Tavares (2004). The author first estimates a growth regression in a cross section context for the period 1960-1995 and between 48 and 80 countries to assess how much different institutions matter for growth. The results obtained indicate that lower corruption fosters growth and the author next uses the estimated coef-ficient to evaluate the growth benefits of institutional reforms resulting in lower corruption in Portugal. For this purpose, Tavares computes an index that measures the yearly increase in per capita growth – estimated for the period 1960–1995 – that would result from an institutional reform elevating Portugal to the EU level in terms of (lower) corruption. Re-ducing corruption to the levels of the EU would enable growth to increase by 0.61% a year making this one of the reforms with the highest growth impact in the Portuguese economy. More recently, Júlio et al. (2013) carry out a similar analysis but focusing on the gains in terms of FDI attraction from implementing institutional reforms. They first estimate a
gravity model to assess the impact on inward FDI stocks of economic and institutional factors using data for 28 European host countries over the period 2005–2007. Institutional factors are measured with data from the Index of Economic Freedom computed by the Heritage Foundation, the Political Risk Rating from the International Country Risk Guide and the World Bank’s Doing Business database. The first two indicators include measures of corrup-tion and the authors estimate the respective impact in terms of FDI attraccorrup-tion concluding that less corruption is one of the main institutional drivers of inward FDI. These estimates are next used to assess how institutional reform in Portugal, corresponding to reaching the EU-15 and EU-17 average levels in terms of different institutional indicators, may impact the country’s ability to attract FDI. The main conclusion is that investment freedom is the institutional reform with the highest impact in Portugal, but lowering corruption and improving the quality of bureaucracy are also at the top of the list. Although the literature has not reached a consensus on the sign of the overall impact of FDI inflows on economic growth in the host economy (Carbonell and Werner 2018), if the relationship is positive for Portugal then according to the results of Júlio et al. (2013) lowering corruption could result in quantitatively important growth benefits.
Whether corruption is a threat or an opportunity to economic growth thus remains an open empirical question and no one-size-fits-all policy response can be derived from the existing theoretical literature and empirical evidence. In what follows we focus on the ex-perience of a particular country, Portugal. Due to the heterogeneous relationship between corruption and and economic growth patent in the reviewed literature, single-country studies are needed to gain a better understanding of the nexus in specific economies.
3. ECONOMETRIC ISSUES AND DATA
The empirical studies on the relation between corruption and growth usually employ an equation such as the following (see Ugur, 2014, for a more detailed discussion):
gt = β0+β1Ct+∑yjZj,t+єt. (1)
The dependent variable in equation (1) is the growth rate of real GDP per capita, C is the measure of corruption and Z represents the control variables. The interpretation of the estimation results depends on what control variables are included, for example, on whether Z contains lags or differences of C and g. If we can ignore the contents of Z, then equa-tion (1) implies that a transitory (permanent) variaequa-tion in corrupequa-tion will have a temporary (permanent) effect on the growth rate. The transitory effect on the growth rate will translate into a permanent effect (a shift) on the level of GDP. A permanent effect on the growth rate will cause the new path of GDP to diverge from the path that would have been observed in the absence of the shock. From an economic point of view, the two outcomes are very different and therefore it is important to be clear on what the model that is to be estimated implies for the path of GDP. If the researcher’s framework indicates that a permanent shift in corruption should cause only a permanent shift in the level of GDP, then the first differ-ence of C should replace C in equation (1).
Furthermore, there is still the question of which variables to include as control variables (Z). These should be the variables that determine GDP growth, or at least those determinants that may be correlated with corruption, otherwise their absence would lead to an endogeneity problem. The difficulty lies in identifying those factors and in obtaining the corresponding data. A large number of factors have been suggested as fundamental growth determinants, leading to a problem of model uncertainty and making the results for a specific explanatory variable dependent on the regressors that each researcher finds relevant to include.
In this paper, we propose to address this issue in the following way. The standard ap-proach to the study of growth makes use of a Cobb-Douglas aggregate production function in which output (Y) depends on total factor productivity (A), the capital stock (K) and the labour input (L)1:
.
Yt=A K Lt ta 1t-a (2) Taking logs and first-differencing we get
( ) ,
gtY=gtA+agtK+ 1-a gtL (3)
where the g’s are the log-growth rates of the variables in superscript. From this point of view, what matters for GDP growth is the growth of productivity and of factor inputs – these are the proximate sources of growth. Our approach is based on the analysis of the relation between corruption and these variables. In other words, does corruption influence any of the proximate sources of GDP growth? To answer this question, we resort to a VAR model where we include the growth rates of total factor productivity, capital stock and hours worked, alongside a variable related to corruption. The growth rate of total factor productivity must be estimated; we do so by setting α, the capital share, to one third, as is customary. The variable related to corruption may be either a corruption index or its first difference. As discussed above, if the variable is the level of the corruption index, then a permanent variation in corruption will have cumulative effects on the path of GDP; if the variable is the first difference of the corruption index, then the model will imply that a permanent variation in corruption will have temporary effects on the growth rate of GDP and will only shift (permanently) the level of GDP.
1 We consider a production function with two inputs, capital and labour, and do not extend it to include human
capital due to measurement issues associated with the latter, namely because of very limited data availability for the quality of human capital. Additionally, considering only a measure of the quantity of human capital, such as average years of schooling is problematic for the specific case of Portugal since the time series is basically a straight line with a break at the beginning of the 21st century. In fact, Gouveia and Coelho (2018), p. 38 report that “(…) when only a quantity measure of human capital (mean years of schooling) is allowed for, the estimates of TFP are implausible as several countries, such as Spain, Italy and Portugal have very short periods of TFP growth (or none in the case of Spain), and prolonged reductions in recent years. If human capital is captured in the residual instead, relative levels and trends of TFP estimates become more plausible (…)”
The general VAR model of order p to analyse the relationship between corruption and real GDP growth in Portugal over the period 1980-2017 can thus be defined as follows: Xt = a+β1Xt-1+β2Xt-2+...+βpXt-p+єt, (4) where the vector X contains the variables under analysis and the variable for corruption is considered either in levels (logs) or the first difference of the log (gCPI).
Transparency International defines corruption as: “(…) behaviour on the part of of-ficials in the public sector, whether politicians or civil servants, in which they improperly and unlawfully enrich themselves, or those close to them, by the misuse of the public power entrusted to them”. We measure corruption with the Corruption Perceptions Index (CPI) published by Transparency International. This index is available from 1995 until 2018. We also employ the series provided in the CANA dataset (Castellacci and Natera, 2011), which extends the CPI series back to the 1980-1994 period. The CPI combines several sources of information on the level of corruption in each country.2 The scale of this index goes from
0, the highest level of corruption, to 10, the lowest level. Since this index is based on the perceptions of corruption, it is only a proxy for actual corruption, but the very nature (il-legal) of corruption makes better alternatives difficult to come by.3 This data has been used
in several previous empirical studies, such as Aidt (2009), Farooq et al. (2013), Haque and Kneller (2015), Huang (2016), Saha et al. (2017) and Cieslik and Goczek (2018), among others.4
2 See https://www.transparency.org/.
3 Hamilton and Hammer (2018) classify measures of corruption in two categories: subjective indicators that measure the perceptions and/or experience of corruption by different groups (e.g. country analysts, business people) using survey data; and objective indicators which calculate the magnitude of waste and abuse in public works and/ or services using, for instance, data from the criminal justice system on unlawfull acts such as briberies and embezzle-ment or audits of specific projects. The authors argue that the aggregate survey-based indicators are strongly corre-lated with the objective measures.
4 Alternative indexes of corruption include the ICRG. However, ICRG is not freely available for researchers. Moreover, the CPI is viewed as the most suitable measure for corruption in the public sector since the ICRG main aim is to measure the risk for investors associated with corruption and is thus not as encompassing a measure of cor-ruption as the CPI. In particular, it reflects mainly political instability, which may be only partially caused by corrup-tion. Another alternative could be the Worldwide Governance Indicators, in particular the dimension Control of Corruption, but this has been criticized for several methodological issues such as definitions problems or the use of the unobserved components model (Langbein and Knack 2010; Thomas 2010; Qu et al. 2019).
Figure 1: Corruption perceptions index for Portugal, 1980-2018
Source: Castellacci and Natera (2011) and Transparency International. Figure 2: Growth rate of real per capita GDP in Portugal (%), 1980-2018
Source: AMECO and authors’ computations.
Figure 1 shows the CPI series and Figure 2 shows the evolution of the growth rate of real GDP per capita for Portugal over the period 1980-2018. At first sight, it is difficult to see a clear relation between the corruption index (which is basically constant, although punctuated by a few spikes) and the growth rate of real GDP per capita (which appears to be declining in recent decades). We started by regressing the growth rate of real GDP
per capita on the CPI5 using all the data points and also omitting the point for 2009. Both
regressions yield statistically insignificant coefficients for corruption. The regression that omits the point for 2009 illustrates the difficulties of estimating the effect of corruption on GDP growth with our (relatively small) sample. Omitting the point for 2009 (the year in which the international financial crisis had the largest impact on economic activity) reduces the estimate by more than half, from 1.9 to 0.9. Still, the estimates of the coefficient of cor-ruption are clearly positive in both cases, and, if either of the estimates corresponded to the true effect, they would assign to reducing corruption in Portugal a very significant effect on GDP growth. If corruption had been lower in Portugal in a way that made the Corruption Perceptions Index increase by 1.7 points, so as to match the average value of the index for Germany, then the average growth rate of Portuguese GDP would have been 1.5 (if we take the 0.9 estimate) or more than 3 percentage points (if we use the 1.9 estimate) higher. This evidence is only illustrative in terms of gauging the impact of corruption on GDP growth in the Portuguese case and should thus be taken with care. Univariate regressions are not informative about causality (which could run either or both ways); the regression postulates a contemporaneous effect of corruption on GDP growth and ignores all the other factors that influence GDP growth.
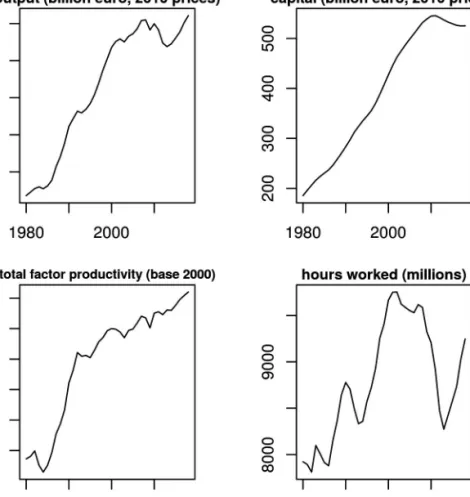
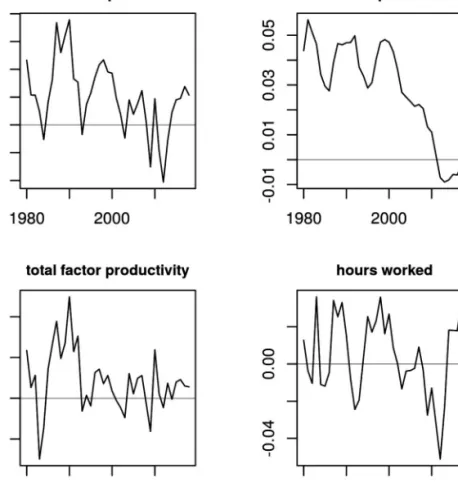
The econometric approach described before allows us to deal with these issues. That ap-proach requires data for output, the capital stock and hours worked. We obtained measures of these variables from the AMECO database (8 November 2018 release). For output we use the series “Gross domestic product at 2010 reference levels”, for the capital stock we use “Net capital stock at 2010 prices: total economy”, and for hours worked we use “Total annual hours worked: total economy”. With these series, we estimated total factor produc-tivity using equation (2) and setting α=1/3. The original AMECO series and our estimate of total factor productivity are plotted in Figure 3. The first differences of the logarithm of the capital stock, hours worked and total factor productivity are plotted in Figure 4 – these transformed series will be used in the VAR model. Figures 3 and 4 reveal behaviours that may have a detrimental impact on the performance of our VAR model. In fact, the swings in the levels of the series, especially since the onset of the sovereign debt crisis, may be challenging for a simple VAR model. The most obvious case is that of the capital stock, which in recent years displays an inversion of the trend.
Figure 3: The AMECO series and our estimate of total factor productivity
Figure 4: Transformed series (first differences, logs) for inclusion in the VAR model
Source: AMECO and authors’ computations.
4. results
We estimated two VAR models, one with the corruption indicator in levels (implying that permanent changes in corruption have cumulative effects on GDP), the other with the first difference of the corruption index (implying that permanent changes in corruption shift the level of GDP).6
6 We tested, using the ADF test, for the existence of unit roots in the logs of output, capital, productivity, hours
The order of the VAR model was selected by setting a maximum order of two; this choice comes from dividing the result of the formula suggested by Schwert (1989) for univariate AR models by the number of variables included in our model (four). The formula is thus:
/ , int l T 4 12 100 . max 0 25 ) =
b
^
h
l
(6)where int(.) is the integer part of the argument and T is the number of observations. The rationale for adjusting Schwert’s formula in this way is that the same number of lags of each variable will be present in each equation of the VAR model; therefore, the four variables will be consuming degrees of freedom in every equation of the VAR model – the division by four takes this into account. For both versions of the VAR model, the information criteria and the likelihood ratio test point to one lag (see Table 1).
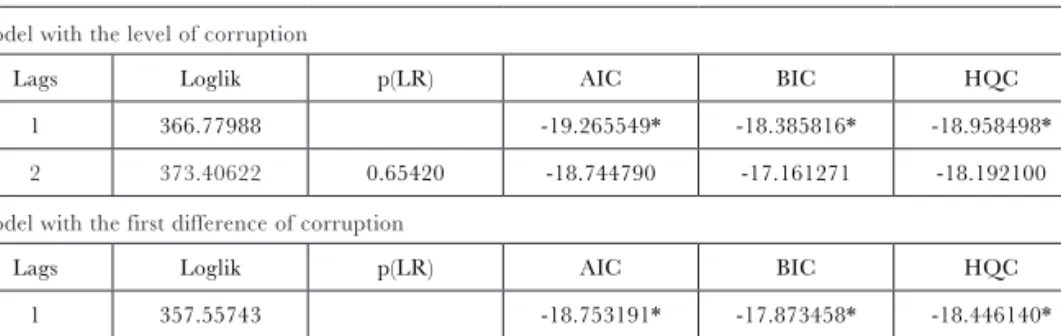
Table 1: Selection of the optimal number of lags in the VAR models Model with the level of corruption
Lags Loglik p(LR) AIC BIC HQC
1 366.77988 -19.265549* -18.385816* -18.958498*
2 373.40622 0.65420 -18.744790 -17.161271 -18.192100
Model with the first difference of corruption
Lags Loglik p(LR) AIC BIC HQC
1 357.55743 -18.753191* -17.873458* -18.446140*
2 367.00382 0.27426 -18.389101 -16.805582 -17.836411
Notes: p(LR) is the p-value for the test of one lag (the null hypothesis) against two. Estimated over the period 1983-2018. The results of the estimation of the selected VAR models show that the model with corruption in levels appears to fit the data better than the model with the first difference of corruption: the log-likelihood is 366.77988 for the model with the level and 357.55743
for the model with the first difference. Since the number of parameters is the same in both models, the difference in the log-likelihood gives rise to similar differences in the value of the information criteria (Akaike, Bayesian and Hannan-Quinn). Therefore, the results sug-gest that a permanent change in the level of corruption may have cumulative effects on GDP; in other words, it may have a powerful impact on living standards. Nevertheless, we a unit root. The ADF test applied to the first differences rejects the null hypothesis of a unit root for all series except the capital stock. Nevertheless, we decided to treat the first difference of capital as stationary, based on two arguments. First, given that output is a linear combination of the other three series, the results of the ADF test for capital are inconsistent with the results of the tests for output, productivity and hours worked. Second, the estimated VAR mod-els (which include the first difference of capital) are stationary, i.e. the eigenvalues of the companion matrix are outside of the unit circle.
still need to know whether the impact on GDP (via either the capital stock, hours worked or productivity) is positive or negative, and whether it is statistically significant.
Table 2 shows the estimated coefficients for lagged corruption in the equations for the other variables in the model. None of the estimates is statistically significant. However, the magnitude of the estimates is large and could again assign to corruption a very important role in the evolution of, in particular, productivity and hours worked.
Table 2: Coefficient of lagged corruption in the other equations of the VAR model
Equation coefficient std. error t-ratio p-value
Capital 0.00296367 0.00332219 0.8921 0.3792
TFP -0.0105714 0.0102260 −1.034 0.3092
Hours 0.00864046 0.0129871 0.6653 0.5108
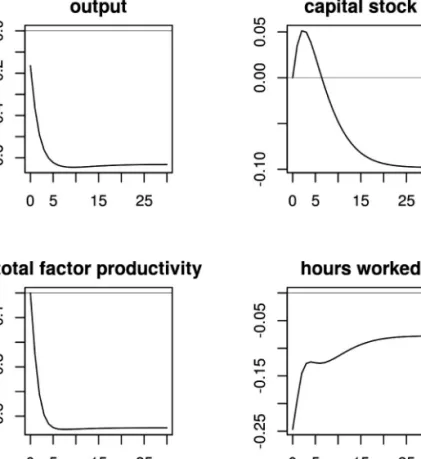
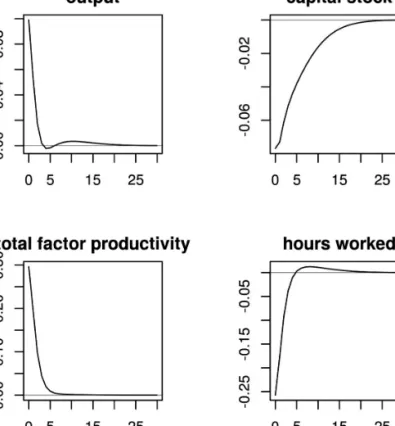
In a VAR model the correct way to assess the importance of corruption is by analyz-ing the impulse-response functions. The difficulty is that this requires an assumption about the structure of the relationship between the variables in the model. Here we employ the standard Cholesky decomposition, which imposes a recursive structure on the shocks that move the variables. We believe that hours worked is the variable that can more rapidly ad-just to shocks. Therefore, we will assume that hours worked will react contemporaneously to all the structural shocks in the model. On the opposite extreme we consider the capital stock; accordingly, it will only react contemporaneously to the structural shock associated with the capital stock equation. Similar to the capital stock, total factor productivity should also display some inertia. We thus assume it only reacts contemporaneously to its specific structural shock and to capital stock shock. As a result, corruption will be in between hours worked and total factor productivity, and may react contemporaneously to its own shocks and to shocks to the capital stock and to total factor productivity. The estimated impulse-response functions and the 90% confidence intervals (dashed lines) are shown in Figure 5. Note that the impulse response function for output can be obtained by substituting output for hours worked in the VAR model.
Figure 5: Impulse-response functions of log-diffs (percent) to a temporary change in corruption
The impulse-response functions are also not significantly different from zero (the con-fidence interval never excludes zero). Nevertheless, the prevailing effect across the three components of the production function seems to be negative: an increase in the corrup-tion index (a decline in perceived corrupcorrup-tion) would appear to decrease hours worked and productivity. Consequently, the estimated impact of a temporary increase in the corruption index (a decrease in perceived corruption) would shift down the level of output, as shown in Figure 6. The shift corresponding to a one-standard-deviation temporary shock in the CPI would amount to about -0.6 percentage points of GDP. If the shock is permanent, then the effect would be a decrease of 0.6 percentage points every period (see Figure 7). This would be a very large impact, if it were real; we cannot forget that the coefficients of lagged corruption are not statistically significant.
Figure 6: Impulse-response function of levels (percent) to a temporary change in corruption
The fact that the previous VAR model, based on the Cholesky decomposition, implies a large negative and cumulative response of the level output to a permanent change in the level of corruption is unpalatable. It is a reflection of the fact that the model allows tempo-rary changes in corruption to have permanent effects on the levels of the other variables. However, this possibility can be ruled out by imposing – as suggested by Blanchard and Quah (1989) – long-run restrictions on the VAR model, and thus moving to a more com-plex structural VAR (SVAR) model. We therefore impose the restrictions that temporary shocks to corruption have zero long-run impacts on the levels of the other variables. From the restrictions included in the Cholesky-based version of the model, we must drop those that impose a zero contemporaneous response to a shock to corruption. The new impulse response functions are presented in Figures 8 to 10. The impact of a shock to corruption is still not statistically significant (Figure 8). However, in the SVAR model temporary shocks to corruption have a positive effect on the levels of output and productivity (Figure 9). As required by the long-run restrictions imposed in the SVAR model, the impact tends to zero over time (all variables are approximately back to the pre-shock position 30 periods after the shock). As a result, a permanent shock to corruption in the SVAR model shifts the level of output up. The impact of this is relatively small: in the long run, a one standard deviation shock to corruption raises output by about 0.2 percentage points. Given that the standard deviation of the corruption shock is also around 0.2, if the index of corruption were to improve 1.7 units in Portugal (to reach German levels), output in Portugal would shift up 1.7 percentage points. This estimate is far from those obtained with the Cholesky VAR model, and with the simple univariate regressions, which implied a permanent impact on the average growth rate.
Figure 9: Impulse-response function of levels (percent) to a temporary change in corruption in the SVAR model
Figure 10: Impulse-response function of the level of output (percent) to a permanent change in corruption in the SVAR model
5. conclusIon
In this paper we analyze the relationship between corruption and economic growth in Portugal in recent decades (1980-2018). We employed a VAR model comprising the Cor-ruption Perceptions Index produced by Transparency International, as well as the factors determining output suggested by the standard Cobb-Douglas aggregate production function: the capital stock, total factor productivity and hours worked. The results indicate that the model with the level of the CPI fits the data better than the model with the first difference of the CPI. However, the corruption index was not statistically significant in the equations of the other variables in the VAR model. A somewhat puzzling finding is that, despite the lack of statistical significance, the magnitude of the coefficients on the corruption index is sizeable, leaving open the possibility that the impact of corruption on the other variables may be large (and positive). In fact, taking the estimated coefficients as correct implies that a temporary one-standard-deviation shock to the corruption index (equivalent to a decrease in perceived corruption) would lead output to shift down 0.6 percentage points. Consequently, a permanent shock to the corruption index (less corruption) would cause output to decline by that amount every period. These estimates are very large and consequently sound implausible. We therefore moved to a SVAR model with long-run restrictions that eliminate any impact of temporary shocks to corruption on the long-run level of output. The results from the SVAR model indicate that if the level of corruption in Portugal reached the level of corruption in Germany, the long-term benefit would be an increase of 1.7 percentage points in the level of output. This sounds like a modest gain, but it is much more plausible than the estimates provided by the VAR model. Overall, this result implies that the failure of the Portuguese standards of living to converge to those of the richest countries in the EU is prob-ably not due (for the most part) to corruption in the Portuguese economy. Further research, with alternative methods, namely based on panel data, may help shed light on this issue.
reFerences
Aidt, T.S. (2009) Corruption, institutions, and economic development, Oxford Review of Economic Policy, 25(2), 271-291.
Barro, R.J. (1990) Government spending in a simple model of endogeneous growth, Journal of Political
Economy, 98(S5), 103-125.
Carbonell, J.B.; Werner, R.A. (2018) Does foreign direct investment generate economic growth? A new empirical approach applied to Spain, Economic Geography, 94(4), 425-456.
Blanchard, O.J.; Quah, D. (1989) The dynamic effects of aggregate demand and supply disturbances,
American Economic Review, 79(4), 655-673.
Buchanan, J.; Tullock, G. (1962) The Calculus of Consent: Logical Foundations of Constitutional Democracy, Ann Arbor, MI, The University of Michigan Press.
Campos, N.; Dimova, R.; Saleh, A. (2016) Corruption and economic growth: An econometric survey of the evidence, Journal of Institutional and Theoretical Economics, 172(3), 521-543.
Castellacci, F.: Natera, J.M. (2011) A new panel dataset for cross-country analyses of national systems, growth and development (CANA), Innovation and Development, 1(2), 205-226.
Chapsa, X.; Tsanana, E.; Katrakilidis, C. (2015) Growth and convergence in the EU-15: More evidence from the cohesion countries, Procedia Economics and Finance, 33, 55-63.
Cieślik, A.; Goczek, Ł. (2018) Control of corruption, international investment, and economic growth: Evidence from panel data, World Development, 103, 323-335.
D’Agostino, G.; Dunne, J.P.; Pieroni, L. (2016) Government spending, corruption and economic growth,
World Development, 84, 190-205.
Dimant, E.; Tosato, G. (2018) Causes and effects of corruption: What has past decade’s empirical research taught us? A survey, Journal of Economic Surveys, 32(2), 335-356.
Farooq, A.; Shahbaz, M.; Arouri, M.; Teulon, F. (2013) Does corruption impede economic growth in Pakistan?, Economic Modelling, 35, 622-633.
Gouveia, A.; Coelho, M. (2018) The Portuguese Economy: Short Essays on Structural Changes, Lisbon, GPEARI, Ministry of Finance, Portugal.
Hamilton, A.; Hammer, C. (2018) Can we measure the power of the grabbing hand? A comparative analysis of different indicators of corruption, Policy Research Working Paper World Bank. Number 8299. Haque, M.E.; Kneller, R. (2015) Why does public investment fail to raise economic growth? The role
of corruption, The Manchester School, 83(6), 623-651.
Huang, C.J. (2016) Is corruption bad for economic growth? Evidence from Asia-Pacific countries, North
American Journal of Economics and Finance, 35, 247-256.
IMF (2016) Corruption: Costs and mitigating strategies, IMF Staff Discussion Note, Number SDN/16/05. Júlio, P.; Pinheiro-Alves, R.; Tavares, J. (2013) Foreign direct investment and institutional reform:
Evi-dence and an application to Portugal, Portuguese Economic Journal, 12(3), 215-250.
Langbein, L.; Knack, S. (2010) The worldwide governance indicators: Six, one, or none?, The Journal
of Development Studies, 46(2), 350-370.
Leff, N.H. (1964) Economic development through bureaucratic corruption, American Behavioral Scientist, 8(3), 8-14.
OECD (2013) Issue Paper on Corruption and Economic Growth, G20 Leaders St. Petersburg Summit. Paul, B.P. (2010) Does corruption foster growth in Bangladesh?, International Journal of Development
Pellegrini, L.; Gerlagh, R. (2008) Causes of corruption: A survey of cross-country analyses and extended results, Economics of Governance, 9(3), 245-263.
Qu, G.; Slagter, B.; Sylwester, K.; Doiron, K. (2019) Explaining the standard errors of corruption perception indices, Journal of Comparative Economics, forthcoming.
Saha, S.; Mallik, G.; Vortelinos, D. (2017) Does corruption facilitate growth? A cross-national study in a non-linear framework, South Asian Journal of Macroeconomics and Public Finance, 6(2), 178-193. Tavares, J. (2004) Institutions and economic growth in Portugal: A quantitative exploration, Portuguese
Economic Journal, 3(1), 49-79.
Thomas, M.A. (2010) What do the worldwide governance indicators measure?, The European Journal of
Development Research, 22(1), 31-54.
Treisman, D. (2000) The causes of corruption: A cross-national study, Journal of Public Economics, 76(3), 399-457.
Treisman, D. (2007) What have we learned about the causes of corruption from ten years of cross-national empirical research?, Annual Review of Political Science, 10, 211-244.
Ugur, M. (2014) Corruption’s direct effects on per-capita income growth: A meta-analysis, Journal of
The European Logistics Space: On Jean Monnet
and the Integration of Europe
O Espaço Logístico Europeu: Jean Monnet
e a Integração Europeia
Mattia Frapporti
Received for publication: July 1, 2019 Revision accepted for publication: October 7, 2019 ABSTRACT
This article aims to investigate a different genealogical line of European integration. Through a partial use of the biography of Jean Monnet, I aim to expand the temporal borders of the path often outlined by European integration history, taking advantage of an analytical tool that is rarely used in this context: logistics. On the one hand, I propose to make the Schu-man Declaration resonant witha broader “European past”. On the other hand, my aim is to show that some categories of the global present also pervade the process of continental integration. All in all, this path reveals that the latter process was originally developed to build what I call the “European Logistics Space”.
Keywords: Jean Monnet; logistics; European integration; logistics rationale. JEL Classification: N40; N43; N47
RESUMO
Este artigo tem como objetivo investigar uma linha genealógica diferente do processo de integração europeia. Recorrendo à biografia de Jean Monnet, pretende-se expandir as fronteiras temporais muitas vezes delineadas pela história da integração europeia, utili-zando uma ferramenta analítica raramente usada neste contexto: a logística. Por um lado, propõe-se que a Declaração de Schuman faça eco de um “passado europeu” mais amplo. Por outro lado, mostra-se que algumas das categorias globais conhecidas já estão presentes no processo de integração continental. A abordagem proposta revela afinal que o último processo foi desenvolvido originalmente para construir o que se pode designar de “Espaço Logístico Europeu”.
L’Europe n’a jamais existé. Jean Monnet
1. IntroductIon
Through what we might identify as a “logistics gaze”, it is possible to understand bet-ter some of the most disruptive economic, geopolitical, and social upheavals of the global present. The so-called critical logistics studies far exceed the field in which the subject was traditionally enclosed. Indeed, until 20 years ago, logistics studies were the prerogative of technical, engineering, or managing fields; however, in the last few years, it has become – along with finance, extraction, and governance – a new analytical category that is being applied to a range of disciplines, because in contemporary «supply chain capitalism» (Tsing, 2009) we know that «logistics do politics» (Neilson, 2012; Mezzadra and Nielson, 2013, 2019).
Nevertheless, the widespread usefulness of logistics today has given rise to an approach that is excessively focused on present time. Starting from this assumption, one of the aims of this article is to assess the boundaries of logistics as a field, and test its usefulness in historical analysis, something that has been underestimated even in critical logistics studies. Specifically, I will apply “the lens of logistics” to interpret the birth of the European Coal and Steel Community (ECSC), designed by Jean Monnet, and to show how a “logistics ration-ality” informed Monnet’s thoughts and led to the rise of the European integration process. Today’s geopolitical panorama is constantly under stress. New forms of space continu-ously arise outside of the traditional form of sovereignty (Brenner, 2004; Sassen, 2013), thoroughly reshaping the “geometry of globalization” (Galli, 2001). New types of borders (Mezzadra and Neilson, 2013), spaces of exception (Ong, 2006; Collier, 2011; Easterling, 2014a, 2014b), transnational corridors (Grappi, 2016), and new kinds of supranational or intranational regions are only some examples of this tendency. In this article I aim to show how the European integration process could be seen in the same perspective, dismantling the thesis that categorically reads the rise of the process leading to today’s European Union as a direct and linear consequence of the Schuman Plan.
The story of European integration usually takes 9 May 1950 as a breaking point, a “new beginning” in the history of Europe: «Schuman’s proposal – as it says on the EU’s website – is considered to be the beginning of what is now the European Union.»1 The so-called
«founding fathers» are deeply iconized in European history,2 and among them Monnet
holds an important position. But is all of this correct? In this article I will reconsider the idea that 9 May represented the beginning of European integration, and I will underline the role Monnet played even before that date. Examining more carefully his exact method and rationale, we can assert that «he transformed Europe» (Walters and Haahr, 2005: 23), which will become clear when considering his work not just from 1950 onwards, but his previous career as well.
1 https://europa.eu/european-union/about-eu/symbols/archived-europe-day_en.
2 For example Alcide De Gasperi, Konrad Adenauer, Paul-Henri Spaak, and Schuman and Monnet themselves. See https://europa.eu/european-union/about-eu/history_en.
In addition to Monnet’s life, the history of European integration should also be examined more carefully, to avoid the limits of existing scholarship.3 In doing so, two purposes will
lead this article. First, I will retrace one of the multiple origins of the EU, building a longue durée history where the birth of the ECSC better represents the end of a long project or, at best, only an important passage of the “long twentieth century”.4 Second, I will demonstrate
that we may find some of the aforementioned categories that emerge in the global present in the process of continental integration too. In sum, this path will allow us, first, to decode the rationale that drove European integration; second, it will prove the crucial role played by Monnet; and last but not least, it will reveal that the process was originally developed so as to build what I call the “European Logistics Space”.
2. Monnet’s early lIFe Between FInance and logIstIcs
To get a fuller picture of Monnet’s thought we must start from the very beginning. Born on 9 November 1888, he spent the first part of his life in Cognac. Known worldwide, almost the entire village was involved in the production or trading of its homonymous beverage, and Monnet’s family was no exception. As happened with other firms, the cognac of Mon-net’s father was sold mostly abroad, something that – according to Jean Monnet himself – led the people of Cognac towards a “natural” anti-nationalistic feeling. As Monnet said:
Donc les gens de Cognac s’intéressent aux conditions qui existent dans ces différents pays. Je dirais même qu’ils s’y intéressent plus qu’aux conditions qui existent en France, parce que le commerce est plus sensible à ce qui se passe à Winnipeg, au Canada, qu’à Bordeaux ou en France. Donc le gens sont tout naturellement tournés vers l’extérieur. C’est naturel.5
According to Frederic J. Fransen, the citizens of Cognac could be defined as «cosmopolitan peasants» (Fransen, 2001: 6) due to their deep knowledge of world affairs. In Monnet’s own writings this characteristic is outstandingly underlined; we frequently read, in his Memoirs, of an early “global gaze” that was somehow innate in him.
Responding to the needs of the family firm, at the age of 16 Monnet left school to travel. Firstly, he went to London, where he lived for two years. In London, Monnet first experienced the “global dimension” of trade as well as of politics:
From the days of my childhood, while French society stagnated in its own parochialism, I was taught to realize that we lived in a world of vast distances, and it was natural for me to expect to meet people who spoke other languages and had different customs. To observe and take account of these customs was our daily necessity (Monnet, 1978: 43).
3 For a broad perspective on the historiography on this topic, see Kaiser and Varsori, 2010.
4 I am referring to “the long twentieth century” both for the history of capitalism (see Arrighi, 2010) and for the history of technology, where “a new era began, an era from 1850 to 2000, that we refer to as The Long Twentieth Century” (Schot and Scranton, 2014).
5 Interview by Alan Watson with Jean and Silvia Monnet, conducted on 15–16 November and 2–3 December 1971, in Rieben et al., 2004: 250.
In 1905 and 1906, the Empire’s capital was at its apogee. In the words of Giovanni Arrighi, we can affirm that London “finance” was triumphing worldwide and, at the same time, the City of London was affirming its position as the global logistical pole from 1870 to 1913 (Arrighi, 2010), the exact period in which Monnet was living in England. It was there where he understood how important the “flows” of commodities, and “logistics” more generally, would become in the new century.
After his London experience, in July 1907 Monnet moved to Canada, where he spent the greater part of his life prior to the First World War. The Canada trip was formative, particularly for the idea of European integration he developed later on; according to the political theorist Trygve Ugland, «the journey, from the beginning to end, served as inspira-tion for his theory of European supranainspira-tional unity» (Ugland, 2011: 20). We can trace two of his most important ideas back to this early period. First, in Canada Monnet discovered the political power of infrastructure. The historian George Glazebrook argues that, «without such a communication political union would be absurd» (Glazebrook, 1966: 201). James Careless claims that the so-called Pacific Railway represented a «solid groundwork for union» (Careless, 1963: 213), and even Harold Innis underlines the fact that, among the «varied effects», railways brought «the prosperity, the expansion and the integration» (Innis, 1923: 292-293). Railways allowed the linkage of different territories and different populations to a new, unified political body, after two centuries of Anglophones and Francophones contesting territorial leadership. When Monnet visited Canada this feeling was still very strong and easily sensed by the young French visitor, who perceived the territory as a proper “logistics space”, ready to answer the necessity of the upcoming global twentieth century, in which «the basis of power had changed» (Monnet, 1978: 48). In other words, Canada became a “political model” for Monnet, as US democracy was for his fellow countryman Alexis de Tocqueville:
Just as Tocqueville’s journey to America in 1831 convinced him that he had witnessed the future, it appears that Monnet’s trip to Canada in 1907 formed the quintessential core of the inspiration for his lifelong fixation on European supernational unity. (Ugland, 2011: 10)
The second reason for which this journey was so crucial to Monnet’s life is even more directly connected to logistics. In Canada, Monnet encountered the management of the Hudson Bay Company (HBC), the primary worldwide logistics society at the time. In 1911, Monnet signed a commercial agreement with HBC, where his family’s brand became «the sole supplier of brandy to HBC’s vast Canadian market» (Wells, 2011: 9). As of that mo-ment, Monnet essentially became a collaborator of HBC, which was an extremely important career move.
Eventually, the London and Canada trips led Monnet to develop a global logistics way of thinking. In England he witnessed systematized global trade; in Canada he perceived how much importance should be given to infrastructures such as railways, which could build a “logistics space” on which to base a subsequent “political space”. Since «biography, unlike method, is unique and untransferable» (Wolin, 2001: 87), I have dedicated this first section to a discussion of Monnet’s early life. It is only through a proper understanding of the lat-ter that we can inlat-terpret his lalat-ter contributions, while taking advantage of the analytical categories of the contemporary world.
3. the MaterIalIzatIonoFthe european space
Infrastructures are «the nervous system» (Opitz and Tellmann, 2015) of economy and society. The role they played in the formation of the modern nation-state has been widely analysed. Books such as that of Eugen Weber, on the modernization of France in the second half of the nineteenth century (Weber, 1976), or Joe Guldi’s essay on the definition of Eng-land as an «infrastructural state» (Guldi, 2012), are good examples of this line of research. Furthermore, many authors grant infrastructures a central role in modern biopolitical history: a clear example of these is the Canadian Pacific Railway mentioned above, a key mechanism «through which the health, welfare, and conditions of existence of the population have been constituted as objects of governmental management» (Collier, 2011: 205). Thus we see that infrastructures have an intrinsic political capacity, and that they anticipate political unity, building «collectivity through connectivity across a defined space» (Opitz and Tellmann, 2015: 175). Quoting a famous article of Langdon Winner «infrastructures have politics» (Winner, 1980); they first act on a state level, helping the creation of national «imagined communities» (Anderson, 2016). Next, they act, on a different scale, to «deboarder» (Sas-sen, 2013) the political space of modern European states, building a new idea of Europe as emancipated from historical, cultural, religious, ethnic, or moral linkages, and grounded on an infrastructural base. The creation of an “Infrastructure Europe” – from the 1850s onwards, when the so-called “hidden integration” began (Misa and Schot, 2005: 1) – prepared the way for the birth of the ECSC. Railways were the principal agent of this integration.
In the first half of the nineteenth century, the European territory was characterized by a great technical and structural diversity of railways (Schot et al., 2011). Railroad construction and management were both in the hands of private companies, with little or no intention of collaborating (Heinrich-Franke, 2009: 15). However, thanks to the birth of what we would nowadays call “railway governance agencies” (notably the Verein Deutscher Eisenbahn-Verwaltungen), the variegated railways of the European panorama gradually became more and more compatible. International conventions, such as the ones held in Bern in 1878, 1881 and 1886, were increasingly defining a number of basic international standards for the building of new railways and for the mobility of commodities. «Railway Europe» (Tis-sot, 1998) was slowly arising.
By the beginning of the First World War, European space already benefited from an efficient railway interoperability; infrastructurally speaking, many European states – such as Italy, France, Germany, the Netherlands, the Austro–Hungarian Empire, and a few other Eastern European Countries – were already integrated. This trend accelerated after the First World War, thanks to the League of Nations (LoN) and the Union International des Chemins de fer (UDC), which substituted Verein as the principal railways governance agency on European soil. It is in this context that we meet Monnet once again.
Thanks to the role he played during the First World War, Monnet became vice-secretary of the LoN, with a mandate for technical decisions (Roussel, 1996: 84). In technical mat-ters, the LoN operated well during the interwar period, providing a major impulse for the construction of «Iron Europe» (Anastasiadou, 2008): «[T]he League’s failure in international politics contrasted with its relative success as a technical organization» (Schipper et al., 2010: 114). In those years, «infrastructures were discovered as symbols for the unification