4 7 7 4 7 7 4 7 7 4 7 7 4 7 7 Rev Saúde Pública 2003;37(4):477-84
www.fsp.usp.br/rsp
Dengue and the risk of urban yellow fever
reintroduction in São Paulo State, Brazil
Dengue e risco da reintrodução da febre
amarela urbana no Estado de São Paulo
Eduardo Massad, Marcelo Nascimento Burattini, Francisco Antonio Bezerra Coutinho and Luiz Fernandes Lopez
Faculdade de Medicina da Universidade de São Paulo. São Paulo, SP, Brasil
Supported by grants of LIM01/HCFMUSP, Fundação de Amparo à Pesquisa do Estado de São Paulo (FAPESP - Processo n. 2000/01347-4), Conselho Nacional de Desenvolvimento Científico e Tecnológico (CNPq - Processo n. 304560/90-1) and PRONEX. (Processo n. 41.96.0937).
Received on 12/9/2002. Reviewed on 17/3/2003. Approved on 7/4/2003.
Correspondence to: Eduardo Massad
Faculdade de Medicina - USP Av. Dr. Arnaldo, 455
01246-903. São Paulo, SP, Brasil E-mail:edmassad@usp.br
Keywords
Yellow fever, epidemiology. Dengue, epidemiology. Mathematical models. Disease outbreaks. Aedes. Yellow fever vaccine.
Descritores
Febre amarela, epidemiologia. Dengue, epidemiologia. Modelos matemáticos. Surtos de doenças.
Aedes. Vacina contra febre amarela.
Abstract
Objective
To propose a mathematical method for the estimation of the Basic Reproduction Number, R0, of urban yellow fever in a dengue-infested area.
Methods
The method is based on the assumption that, as the same vector (Aedes aegypti) causes both infections, all the quantities related to the mosquito, estimated from the initial phase of dengue epidemic, could be applied to yellow fever dynamics. It is demonstrated that R0 for yellow fever is, on average, 43% lower than that for dengue. This difference is due to the longer dengue viremia and its shorter extrinsic incubation period.
Results
In this study the analysis was expanded to the epidemiological situation of dengue in São Paulo in the year 2001. The total number of dengue cases increased from 3,582 in 2000 to 51,348 in 2001. It was then calculated R0 for yellow fever for every city which have shown R0 of dengue greater than 1. It was also estimated the total number of unprotected people living in highly risky areas for urban yellow fever.
Conclusions
Currently there is a great number of non-vaccinated people living in Aedesaegypti
infested area in the state of São Paulo.
Resumo
Objetivo
Propor um modelo matemático para a estimativa da reprodutibilidade basal, R0, para a febre amarela urbana em uma área infestada pela dengue.
Métodos
4 7 8 4 7 84 7 8 4 7 8
4 7 8 Rev Saúde Pública 2003;37(4):477-84
www.fsp.usp.br/rsp Dengue and the risk of yellow fever
Massad E et al
Resultados
Apresenta-se a aplicação desta análise matemática à situação epidemiológica da dengue no estado de São Paulo, para o ano de 2001, onde o número de casos de dengue aumentou de 3.582, em 2000 para 51.348, em 2001. Calculou-se o valor de
R0 para a febre amarela para cada cidade do estado que tinha R0 para dengue maior que um. Estimou-se o número total de pessoas desprotegidas, sem vacina, e que vivem em áreas de alto risco para a febre amarela urbana.
Conclusões
Foi demonstrado que existe, um grande contingente de pessoas não vacinadas contra febre amarela vivendo em áreas infestadas por Aedes aegypti no Estado de São Paulo, até aquela data (2001).
INTRODUCTION
In a recent publication (Massad et al,11 2001) it was proposed a mathematical method for the estimation of the Basic Reproduction Number, R0 (Anderson & May,1 1991), and hence the threshold for triggering a major epidemic of urban yellow fever in a dengue-infested area. The method is based on the assumption that, as the vector of both infections is the Aedes aegypti, all the quantities related to the mosquito, estimated from the initial phase of dengue epidemic (see below), could be applied to yellow fever dynam-ics. It was demonstrated that R0 for yellow fever is, on average, 34% lower than that for dengue. This differ-ence is due to the longer dengue viremia and its shorter extrinsic incubation period (Monath,12 1990; Halsted,8 1990). It was then exemplified the method with dengue epidemic data from the state of São Paulo, Brazil, for the year 2000. At that time, 67 cities (about 10% of the total number of cities in the state) pre-sented dengue cases with 12 of them showing R0>1 for both dengue and yellow fever. As the measures for vector control were inadequate, the dengue epidemic spread throughout the state of São Paulo in the fol-lowing year (2001), becoming worse in intensity and number of cities affected, and therefore increasing the risk of urban yellow fever being reintroduced.
Early in the 20th century, when it was discovered that the yellow fever virus is transmitted in its urban cycle by Aedes aegypti, control measures were intro-duced leading to its almost disappearance of the Ameri-cas and, in particular, of Brazil. However, reinfestation with Aedesaegypti vector, which began in the late 1960s (Fraiha,6 1968; Franco,7 1969; Monath,13 1999), is now practically complete, and vector control is sub-stantially more difficult than before.
Dengue, another Flaviridae infection transmitted by the same peridomestic Aedes aegypti mosquitoes, re-appeared as a major urban epidemic in Brazil in the
state of Rio de Janeiro in 1986, although there has been a previous outbreak of dengue virus reported in Brazil (Marques et al,10 1994; Degallier et al,3 1996). Since then, it turned into an endemic infection with annual outbreaks, comprising more than 80,000 cases reported in the state of São Paulo in the last 5 years, of which approximately 52,000 cases occurred in 2001.
There has been no case of urban yellow fever re-ported in Brazil since 1942 (CVE* 2001). The sylvatic yellow fever, however, is enzootic in an enor-mous area of central and north-northwestern states. In the period between 1990 and 2001, 380 human cases (with 159 deaths) were reported, of which 191 (82 deaths) were reported in the last three years (CVE 2001). In addition, the epidemic is drifting from its original epicenter in the northern and central regions towards the more populated southeastern states. In 2000, two autochthonous human cases were re-ported in the state of São Paulo, the first ones in more than 50 years.
It should be mentioned that although Aedes albopictus is also present in costal areas of Brazil since the early 1980s (Forattini,4 1986), it was not included in the study analysis because its role as an important dengue transmitter in the Americas is still to be confirmed (Forattini,5 2002).
In this study the analysis presented in Massad et al,11 2001, is expanded and data from the 2001 den-gue epidemic updated. In addition it is estimated the number of cities with major risk of urban yellow fever reintroduction and the size of the population at risk.
In the next section it is briefly described the method proposed in Massad et al,11 2001, for the estimation of R0 for yellow fever as a function of R0 for dengue, estimated from the exponential growing phase of the dengue epidemic. Section 3 is dedi-cated to the description and analysis of the dengue
4 7 9 4 7 9 4 7 9 4 7 9 4 7 9 Rev Saúde Pública 2003;37(4):477-84
www.fsp.usp.br/rsp
Dengue and the risk of yellow fever
Massad E et al
epidemic in the state of São Paulo in 2001 and its potential repercussion on the risk of urban yellow fever reintroduction in affected areas. It is also esti-mate the total number of unprotected people living in highly risky areas for exposure to urban yellow fever. Finally, in the discussion section there are some observations on the current (2002) dengue epidemic in São Paulo and possible control strate-gies for avoiding a major epidemic of urban yellow fever in the dengue infested area are assessed.
Estimating R0 for yellow fever
For a vector-borne disease, R0 may be understood as the number of secondary infections spread in a community through the vector population, as direct result of the presence of a single primary case (Macdonald,9 1952; Molineaux & Gramiccia,15 1980; Burattini et al,2 1998).
The expression for R0 is given by (Massad et al,11 2001; Burattini et al,2 1998):
where NH is the total number of humans and NM is the total number of mosquitoes. Each female mos-quito bites humans at a rate of a times per unit of time. The duration of viremia (and therefore infec-tiousness) of a given vector-borne infection is γ-1 units
of time. Only a fraction of bites in infected humans, c, is considered to be infective to the vectors. The aver-age life expectancy of the mosquitoes is µ-1 and t is
the extrinsic incubation period of the infection. After
τ units of time, only a fraction e-µτ of mosquitoes survive and only a proportion b of their bites is effec-tively infective to humans.
From equation (1) it can be deduced a relation be-tween R0 of yellow fever and dengue. The resulting expression of R0 for yellow fever as a function of R0 for dengue is given by (Massad et al,11 2001):
It is also demonstrated in that previous study that R0 for yellow fever is, on average, 43% lower than that for dengue. This difference is due to the longer viremia of dengue and its shorter extrinsic incuba-tion period (Massad et al,11 2001).
The relation between the critical proportion of any control measure to be applied to a population in or-der to ensure the non-existence of a disease and the
value of its R0 is given by (Anderson & May,1 1991):
Therefore, if a proportion p of the susceptible population is vaccinated (and considered protected), then the critical proportion, pc, to vaccinate against yellow fever in order to ensure that a single infec-tive would not trigger an epidemic is (Massad et al,11 2001):
Estimating R0 from the initial exponential phase of the number of cases
As mentioned in Massad et al,11 2001, in an epi-demic of a vector-borne infection, R0 can be estimated from the initial exponential growing phase of the number of cases in each affected city, i.
Fitting a exponential
CHi is a constant to the initial growing phase of the dengue number of human cases IHs, and it can be esti-mated the coefficient λ, from which R0dengue can be calculated for each affected city i, according to:
Having R0dengue it is possible to estimate R0yf and pc from equations (2) and (3), respectively.
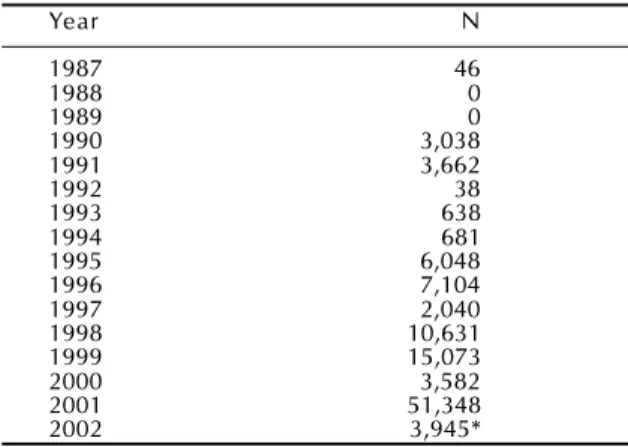
Table 1 - Evolution of Dengue epidemic in the State of São Paulo, Brazil. Year N 1987 46 1988 0 1989 0 1990 3,038 1991 3,662 1992 38 1993 638 1994 681 1995 6,048 1996 7,104 1997 2,040 1998 10,631 1999 15,073 2000 3,582 2001 51,348 2002 3,945*
*First 9 weeks only. (1)
(
)
exp 2 0 γµ µτ-= a bc
N N R H m (2)
(
)
[
]
exp 00 yf dengue
dengue dengue yf yf yf dengue yf c b c b R R
dengue γ µ τ τ
γ -= (3) (4)
1
1
0R
p
c
=
-(
)
[
]
exp 1 1 0 dengue yf dengue dengue yf yf yf dengue c c b c b R p dengue τ τ µ γ γ -=(
)
exp
C
H ii
T
I
i
H
=
λ
(5)(
)
1
2 i 0µγ
γ
µ
λ
λ
+
+
+
=
idengue
4 8 0 4 8 04 8 0 4 8 0
4 8 0 Rev Saúde Pública 2003;37(4):477-84
www.fsp.usp.br/rsp Dengue and the risk of yellow fever
Massad E et al
The dengue epidemic in São Paulo in 2001
Dengue reemerged in Brazil in 1986 and since then it has recurred with varying intensity every year. In São Paulo, after the first minor epidemics in the late 1980’s, dengue has acquired alarming proportions with yearly epidemics of growing intensity and range of geographical spread.
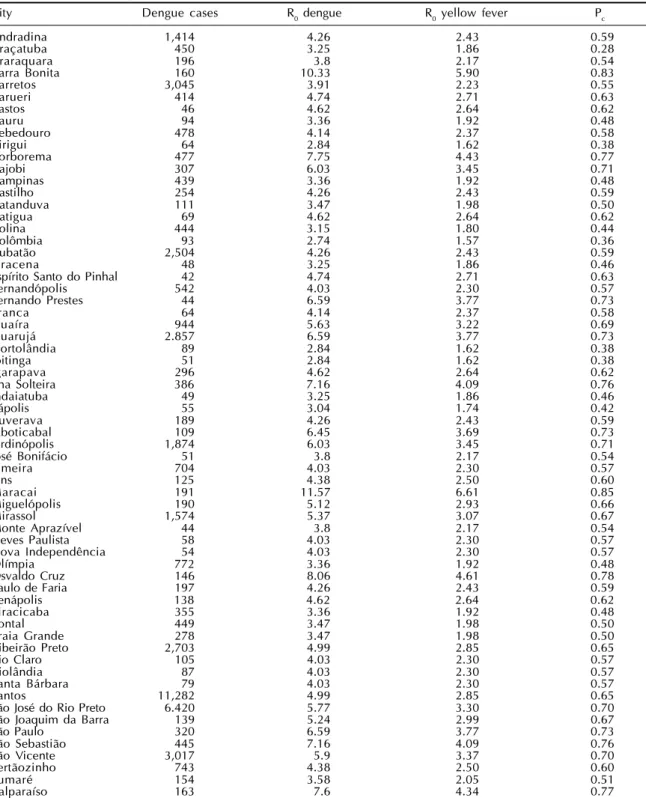
Table 2 - The number of dengue cases, the Basic Reproduction Number for dengue and yellow fever and the correspondent proportion to vaccinate against yellow fever to prevent and epidemic. São Paulo State, 2001.
City Dengue cases R0 dengue R0 yellow fever Pc
Andradina 1,414 4.26 2.43 0.59
Araçatuba 450 3.25 1.86 0.28
Araraquara 196 3.8 2.17 0.54
Barra Bonita 160 10.33 5.90 0.83
Barretos 3,045 3.91 2.23 0.55
Barueri 414 4.74 2.71 0.63
Bastos 46 4.62 2.64 0.62
Bauru 94 3.36 1.92 0.48
Bebedouro 478 4.14 2.37 0.58
Birigui 64 2.84 1.62 0.38
Borborema 477 7.75 4.43 0.77
Cajobi 307 6.03 3.45 0.71
Campinas 439 3.36 1.92 0.48
Castilho 254 4.26 2.43 0.59
Catanduva 111 3.47 1.98 0.50
Catigua 69 4.62 2.64 0.62
Colina 444 3.15 1.80 0.44
Colômbia 93 2.74 1.57 0.36
Cubatão 2,504 4.26 2.43 0.59
Dracena 48 3.25 1.86 0.46
Espírito Santo do Pinhal 42 4.74 2.71 0.63
Fernandópolis 542 4.03 2.30 0.57
Fernando Prestes 44 6.59 3.77 0.73
Franca 64 4.14 2.37 0.58
Guaíra 944 5.63 3.22 0.69
Guarujá 2.857 6.59 3.77 0.73
Hortolândia 89 2.84 1.62 0.38
Ibitinga 51 2.84 1.62 0.38
Igarapava 296 4.62 2.64 0.62
Ilha Solteira 386 7.16 4.09 0.76
Indaiatuba 49 3.25 1.86 0.46
Itápolis 55 3.04 1.74 0.42
Ituverava 189 4.26 2.43 0.59
Jaboticabal 109 6.45 3.69 0.73
Jardinópolis 1,874 6.03 3.45 0.71
José Bonifácio 51 3.8 2.17 0.54
Limeira 704 4.03 2.30 0.57
Lins 125 4.38 2.50 0.60
Maracai 191 11.57 6.61 0.85
Miguelópolis 190 5.12 2.93 0.66
Mirassol 1,574 5.37 3.07 0.67
Monte Aprazível 44 3.8 2.17 0.54
Neves Paulista 58 4.03 2.30 0.57
Nova Independência 54 4.03 2.30 0.57
Olímpia 772 3.36 1.92 0.48
Osvaldo Cruz 146 8.06 4.61 0.78
Paulo de Faria 197 4.26 2.43 0.59
Penápolis 138 4.62 2.64 0.62
Piracicaba 355 3.36 1.92 0.48
Pontal 449 3.47 1.98 0.50
Praia Grande 278 3.47 1.98 0.50
Ribeirão Preto 2,703 4.99 2.85 0.65
Rio Claro 105 4.03 2.30 0.57
Riolândia 87 4.03 2.30 0.57
Santa Bárbara 79 4.03 2.30 0.57
Santos 11,282 4.99 2.85 0.65
São José do Rio Preto 6.420 5.77 3.30 0.70
São Joaquim da Barra 139 5.24 2.99 0.67
São Paulo 320 6.59 3.77 0.73
São Sebastião 445 7.16 4.09 0.76
São Vicente 3,017 5.9 3.37 0.70
Sertãozinho 743 4.38 2.50 0.60
Sumaré 154 3.58 2.05 0.51
Valparaíso 163 7.6 4.34 0.77
evo-4 8 1 4 8 1 4 8 1 4 8 1 4 8 1 Rev Saúde Pública 2003;37(4):477-84
www.fsp.usp.br/rsp
Dengue and the risk of yellow fever
Massad E et al
lution of dengue cases in the state of São Paulo since 1987.
In Table 2 the dengue situation is described for the 64 cities with R0>1 for dengue in the year 2001. The first column shows the name of the city; the second shows the total number of reported cases in those cites; the third column shows the estimated value of R0 dengue; the fourth column shows the calcu-lated values of R0yf; and the last column shows the estimated proportion of individuals that should be vaccinated against yellow fever in order to prevent an epidemic.
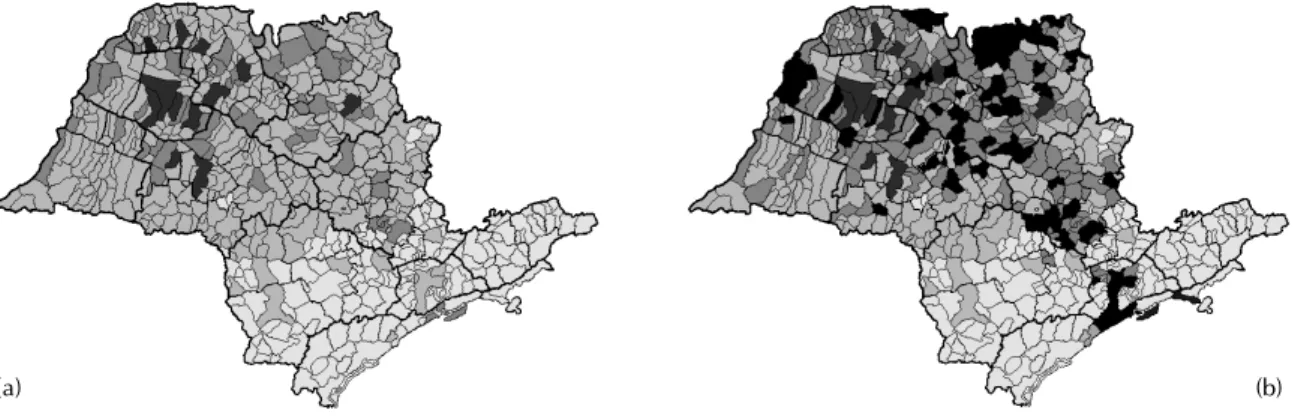
In Figures 1a and 1b, the epidemic evolution is presented for 2000 and 2001. The figures show a map of São Paulo, where light gray areas are those municipalities infested by Ae. aegypti but with no cases of dengue reported; dark gray areas are the municipalities with dengue cases reported; and
black areas are those municipalities with dengue epidemic and R0>1.
In Table 3 present the same cities mentioned above with their respective population sizes, actual propor-tion of individuals vaccinated against yellow fever in the last 10 years, and number of individuals at risk (unprotected by vaccination).
Figure 2a shows the current control strategy against yellow fever in the state of São Paulo. Shaded areas represent municipalities included in what is called a “transition zone,” between enzootic and unscathed regions of Brazil, thought to be at risk for yellow fever. Therefore, these are the cities under intense sur-veillance and where vaccination is recommended, creating a blocking belt.
In contrast, Figure 2b show what it is believed to be a better representation of the actual risk of urban (b)
Figure 1 – (a) Dengue distribution in the state of São Paulo in 2000. Shaded areas indicate municipal districts infested with
Aedes aegypti; light grey areas indicate cities with reported cases of dengue with R0below 1; dark grey areas correspond to
the 12 municipal districts with R0 above 1. (b) The same as in Figure 1a for the year 2001. It can be noted that the epidemiological situation deteriorated.
(a)
Figure 2 – (a) Current control strategy against yellow fever in the state of São Paulo. Shaded areas indicate municipal districts infested with Aedes aegypti; dark shaded areas indicate municipalities included in the so-called “transition zone” between enzootic and unscathed regions of Brazil, subjected to vaccination in order to form a blocking belt zone. (b) Light gray areas (same as in Figure 1) which are infested with Ae. aegypti, superimposed by the blocking belt (dark gray area), and those cities with R0for yellow fever greater than 1, i.e., at risk urban yellow fever reintroduction. white areas indicate the municipalities
with vaccination against yellow fever below the critical proportion required to prevent an epidemic. Black areas correspond to those municipalities with R0 for yellow fever greater than 1 but with vaccination above that critical proportion.
4 8 2 4 8 24 8 2 4 8 2
4 8 2 Rev Saúde Pública 2003;37(4):477-84
www.fsp.usp.br/rsp Dengue and the risk of yellow fever
Massad E et al
yellow fever reintroduction in São Paulo. The fig-ure shows the same light gray areas (as in Figfig-ure 1) infested with Ae. aegypti, dark gray areas represent-ing the blockrepresent-ing belt as in Figure 2a, and those cit-ies with R0 for yellow fever greater than 1, i.e., at risk of urban yellow fever reintroduction. Yellow areas indicate municipalities with vaccination against yellow fever below the critical proportion required to prevent an epidemic that could be triggered by a
single imported case from the sylvatic yellow fever endemic areas. Green areas represent those munici-palities with R0 for yellow fever greater than 1 but with vaccination above that critical proportion.
DISCUSSION
Since the last three cases of urban yellow fever reported in Brazil in 1942, the disease has been
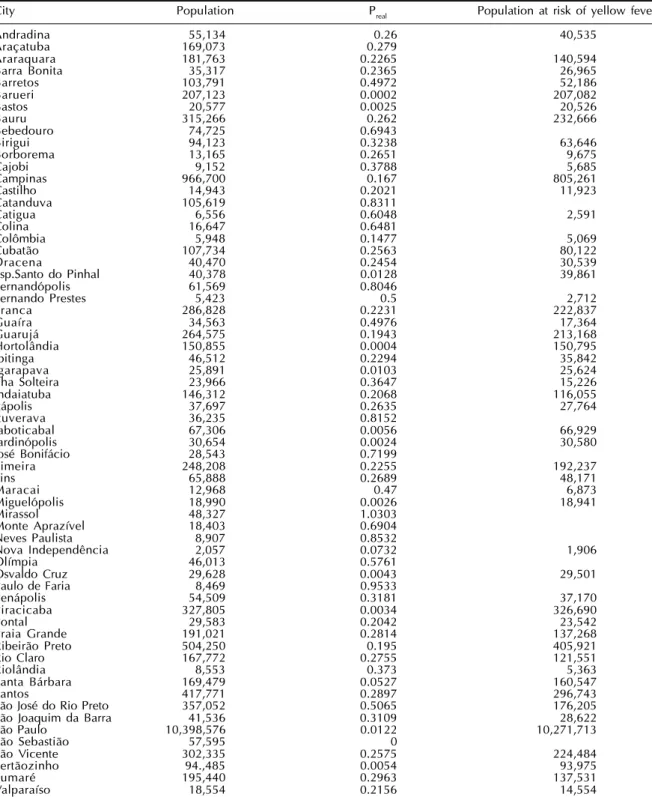
con-Table 3 - The cities with dengue and yellow fever with R0 >1, the actual proportion of people vaccinated against yellow fever
and the number of individuals at risk of yellow fever. São Paulo State, 2001.
City Population Preal Population at risk of yellow fever
Andradina 55,134 0.26 40,535
Araçatuba 169,073 0.279
Araraquara 181,763 0.2265 140,594
Barra Bonita 35,317 0.2365 26,965
Barretos 103,791 0.4972 52,186
Barueri 207,123 0.0002 207,082
Bastos 20,577 0.0025 20,526
Bauru 315,266 0.262 232,666
Bebedouro 74,725 0.6943
Birigui 94,123 0.3238 63,646
Borborema 13,165 0.2651 9,675
Cajobi 9,152 0.3788 5,685
Campinas 966,700 0.167 805,261
Castilho 14,943 0.2021 11,923
Catanduva 105,619 0.8311
Catigua 6,556 0.6048 2,591
Colina 16,647 0.6481
Colômbia 5,948 0.1477 5,069
Cubatão 107,734 0.2563 80,122
Dracena 40,470 0.2454 30,539
Esp.Santo do Pinhal 40,378 0.0128 39,861
Fernandópolis 61,569 0.8046
Fernando Prestes 5,423 0.5 2,712
Franca 286,828 0.2231 222,837
Guaíra 34,563 0.4976 17,364
Guarujá 264,575 0.1943 213,168
Hortolândia 150,855 0.0004 150,795
Ibitinga 46,512 0.2294 35,842
Igarapava 25,891 0.0103 25,624
Ilha Solteira 23,966 0.3647 15,226
Indaiatuba 146,312 0.2068 116,055
Itápolis 37,697 0.2635 27,764
Ituverava 36,235 0.8152
Jaboticabal 67,306 0.0056 66,929
Jardinópolis 30,654 0.0024 30,580
José Bonifácio 28,543 0.7199
Limeira 248,208 0.2255 192,237
Lins 65,888 0.2689 48,171
Maracai 12,968 0.47 6,873
Miguelópolis 18,990 0.0026 18,941
Mirassol 48,327 1.0303
Monte Aprazível 18,403 0.6904
Neves Paulista 8,907 0.8532
Nova Independência 2,057 0.0732 1,906
Olímpia 46,013 0.5761
Osvaldo Cruz 29,628 0.0043 29,501
Paulo de Faria 8,469 0.9533
Penápolis 54,509 0.3181 37,170
Piracicaba 327,805 0.0034 326,690
Pontal 29,583 0.2042 23,542
Praia Grande 191,021 0.2814 137,268
Ribeirão Preto 504,250 0.195 405,921
Rio Claro 167,772 0.2755 121,551
Riolândia 8,553 0.373 5,363
Santa Bárbara 169,479 0.0527 160,547
Santos 417,771 0.2897 296,743
São José do Rio Preto 357,052 0.5065 176,205
São Joaquim da Barra 41,536 0.3109 28,622
São Paulo 10,398,576 0.0122 10,271,713
São Sebastião 57,595 0
São Vicente 302,335 0.2575 224,484
Sertãozinho 94.,485 0.0054 93,975
Sumaré 195,440 0.2963 137,531
4 8 3 4 8 3 4 8 3 4 8 3 4 8 3 Rev Saúde Pública 2003;37(4):477-84
www.fsp.usp.br/rsp
Dengue and the risk of yellow fever
Massad E et al
fined to enzootics of the sylvatic form (FUNASA,* 2001). This is perpetuated by a cycle involving pri-mates and mosquitoes of the gender Haemagogus sp. and Sabethes sp. Sporadic human cases of the sylvatic form have been reported since then, with a total of 380 (159 deaths) cases between 1990 and 2001. This relatively low number of cases is due to basically two factors: low migration rates between urban centers and enzootic reservoirs and an effec-tive vaccination program encouraging people to be vaccinated 10 days before visiting enzootic areas. In addition, this control program includes an intense surveillance program of Ae. aegypti and vaccina-tion creating a blocking belt of vaccinated indi-viduals living in the transition zone between ur-banized areas and enzootic regions.
The state of São Paulo shares borders with en-zootic states. In spite of that only two autochthonous cases of sylvatic yellow fever has been reported so far. However, the spread of Aedes aegypti towards coastal areas, and the ensuing spread of dengue, is putting at risk cities far away from the blocking belt vaccination areas, as shown in Figure 2b. A global vaccination campaign against yellow fever should be carried out with great care. Although safe the vaccine is not free from adverse effects (Monath,14 1999). In Brazil, it has been estimated between 1 and 21 fatality cases per million doses (Struchiner, personal communication). At the moment, consid-ering the worsening of dengue epidemic in São Paulo (more than 10,000 cases reported in the first 8 weeks of the year), and considering the adverse ef-fects of the yellow fever vaccine, the current vacci-nation strategy should be revised.
The current preventive program of vaccination fo-cuses on areas of the state as shown in Figure 2a, part of the blocking belt. In addition, vaccination of peo-ple traveling to enzootic regions is strongly recom-mended. However, as shown in Figure 2b, this strat-egy is inconsistent with the current epidemiological
*“Fundação Nacional de Saúde, Ministério da Saúde, Brasil”. Data available in 2001. Http://www.funasa.gov.br
scenario of the state of São Paulo. It is worth noting that only 16% of the municipalities in the blocking belt have R0 for yellow fever greater than 1. Further-more, only 26% of the cities with R0 for yellow fever greater than 1 have achieved protective coverage lev-els. Therefore, it could be that the state of São Paulo is wasting vaccines and resources, and posing a risk of adverse effects to people by routinely vaccinating the remaining 84% of the cities in the blocking area which have R0 for yellow fever lower than 1 while failing to protect those cities at actual risk.
More serious is the fact that half of the 61 cities with R0 for yellow fever greater than 1 and inadequate vaccination are outside the blocking belt area, and none of them have achieved the minimum vaccina-tion coverage required.
Therefore vaccination strategy should be urgently revised, as follows: 1) it is important to take into ac-count regional variation in the risk of yellow fever using the new methodology proposed in (1) and ap-plied here for the identification of areas at risk and then periodical calculation of that risk should be undertaken; 2) a compulsory vaccination program for people traveling to enzootic areas should be intro-duced and the education program to warn people of the risk of traveling to those areas without vaccina-tion at least 10 days prior should be improved; 3) routine vaccination should be targeted to the areas at risk in order to avoid unnecessary mass vaccination. This proposed targeted vaccination program would be also more cost effective in the sense that it optimizes allocation of limited resources.
Currently there are more than 15 million non-vac-cinated people living in Aedes sp. infested area in the state of São Paulo. Although the dramatic dengue epidemic is attracting the attention of public health authorities, these figures are of high concern. The risk of reemergence of urban yellow fever is indeed on one’s doorstep.
REFERENCES
1. Anderson RM, May RM. Infectious diseases of humans: dynamics and control. Oxford: Oxford University Press; 1991.
2. Burattini MN, Coutinho FAB, Lopez LF, Massad E. Modelling the dynamics of leishmaniasis considering human, animal host and vector populations. J Biol Syst
1998;6:337-56.
3. Degallier N, da Rosa AP, Vasconcelos PF, Figueiredo LT, da Rosa JF, Rodrigues SG et al. Dengue fever and its vector in Brazil. Bull Soc Pathol Exot
1996;89:128-36.
4 Forattini OP. Identificação de Aedes (Stegomyia) albopictus no Brasil. Rev Saúde Pública
4 8 4 4 8 44 8 4 4 8 4
4 8 4 Rev Saúde Pública 2003;37(4):477-84
www.fsp.usp.br/rsp Dengue and the risk of yellow fever
Massad E et al
5. Forattini OP. Culicidologia médica: identificação, biologia, epidemiologia v.2. São Paulo: EDUSP; 2002. p. 498.
6. Fraiha H. Reinfestação do Brasil pelo Aedes aegypti. Considerações sobre o risco da urbanização do vírus da febre amarela na região infestada. Rev Inst Med Trop São Paulo 1968;10:289-94.
7. Franco O. Reinfestation of Pará by Aedes aegypti.
Rev Bras Malariol Doenças Trop 1969;21:729-31.
8. Halstead SB. Dengue. In: Warren KS, Mahmoud AAF, editors. Tropical and geographical medicine. New York: McGraw-Hill; 1990 p. 675.
9. Macdonald G. The analysis of equilibrium in malaria.
Trop Dis Bull 1952;49:813-28.
10. Marques CA, Forattini OP, Massad E. The basic reproduction number for dengue fever in São Paulo state Brazil: 1990-1991 epidemic. Trans R Soc Trop Med Hyg 1994;88:58-9.
11. Massad E, Coutinho FAB, Burattini MN, Lopez LF. The risk of yellow fever in a dengue infested area.
Trans R Soc Trop Med Hyg 2001;95:370-4.
12. Monath TP. Yellow fever. In: Warren KS, Mahmoud AAF, editors. Tropical and geographical medicine. New York: McGraw-Hill; 1990. p. 661-74.
13. Monath TP. Facing up to re-emergence of urban yellow fever. Lancet 1999;353(9164):1541.
14. Monath TP. Yellow fever. In: Plotkin AS, Orenstein WA, editors. Vaccines. 3rd ed. Philadelphia: Saunders;
1999. p. 815-80.