UNIVERSIDADE DE TRÁS-OS-MONTES E ALTO DOURO
Match variables related to the outcome of the
Football European Championship (France, 2016)
MASTER'S DISSERTATION IN SPORTS SCIENCES International Master in Performance Analysis of Sports
Luís Alberto Tomás Duarte Advisor: Jaime Sampaio
Table of Contents
Abstract ... 3
Introduction ... 4
Methods ... 6
Sample and Variables ... 6
Data Analysis ... 8
Results ... 9
Discussion ... 19
Conclusion ... 22
Abstract
This study aimed to identify the game statistics that best discriminate the outcome of the matches played in the Football European Championship (France, 2016). The analysis was carried on all matches of the competition and all the variables available on the official UEFA website. A two-step cluster analysis was performed to identify different clusters amongst the game statistics. Afterwards, a discriminant analysis identified the most powerful variables in distinguishing the previously identified clusters. Results revealed that Distance Covered in the first half (Structure coefficient SC=0.742) and the Fouls Committed in the second half (SC=0.367) were the variables that most contributed to distinguish the clusters, suggesting the importance of defensive combativeness and physical conditioning. This type of analysis is important because the variables provide a lot of information about the teams, such as their tactical model or playing styles, which gives the coaches/analysts an increased knowledge about football's performance indicators.
Introduction
The analysis of different variables in team sports can provide an objective, impartial and valid record in the team's activities and therefore can be useful for evaluating and monitoring team performances (Higham, Hopkins, Pyne & Anson, 2014; O'Donoghue, 2014). In order to provide information about players' behaviour and their possible interpretation, coaches and analysts are looking for indicators that can describe and diagnose past performances that explain "what happened and why" and also try to use these indicators to predict and create future behaviours (McGArry Anderson, Wallace, Hughes & Franks, 2002). These performance indicators are a selection or combinations of variables with the aim of define some or all game performance aspects or non-training (Hughes & Bartllet, 2002). These performance indicators may be physical, psychological, technical or tactical.
Most of the studies about performance analysis in football are focused on the club’s competitions analysis (i.e., national league, Champions League, etc.), however, was been proved that teams performances can vary due to the type of competition, on the factors between teams and within the team itself (Gómez, Lago-Peñas & Pollard, 2013).
Despite recent attempts to build teams performance profiles in collective sports, the number of researches focused on the construction of performance indicators in soccer is not so significantly. Recently, a small number of studies have tried to provide performance indicators to the teams, pointing the final result of the game as a primary indicator (win/lose), which provides information on the tactical and technical success of the teams
(Gómez, DelaSerna, Lupo, Sampaio & Higham, 2014). However, the final result it is not enough to get a detailed analysis of a team because it is important to know the key points/factors that can lead a team to success in different competitions. Since the final result is characterized as a primary indicator of team’s performance, the importance given to the performance difference between the winning and the losing teams as been increasing and, related with this type of analysis, several variables appeared as being preponderant to the success in a different competition, being them the total of shots and number of shots on the target (Castellano, 2012), the percentage of ball possession and respective collective organization (Lago-Peñas, 2010), the distance traveled during a game or competition (Rampinini, 2009), the number of fouls committed and how those faults were committed (Bredmier & Shields, 1986), among others.
Therefore, in line with previous studies that compares winning and losing teams in different competitions, the aim of this study was to identify which variables had a greater influence on the 2016 UEFA European Championship results, using the game performance indicators.
Methods
Sample and Variables
The data was taken from UEFA's official website, which provides the statistical data for each match played in the competition. 24 teams participated in the competition, they were distributed in 6 groups and each group was composed of 4 teams. Each team played at least 3 games of the group stage and each game lasted 90 minutes. After completing all group stage matches, the two teams that have the best score and the third best of the entire groups move to the next phase of the competition, with knock-outs until the final match. The games in the knock-out phase have the same duration of 90 minutes, but if there is a draw during this stipulated time, there was an extra time of 30 minutes to try and find a winner in the match. If there is still a tie by the end of this extra time, there is a penalty shootout, in which each team will score 5 penalties, in order to find a winner of the match and that team advances in the competition. The competition took place between June 10 and July 10.
The variables analyzed in this study were:
Attacking
Goals Scored;
Total Attempts on Target;
Total Attempts off Target;
Total Attempts Blocked;
Woodwork;
Saves;
Corners;
Offside;
Total Time Played (min);
Discipline
Yellow Cards; Red Cards; Fouls Commited; Fouls Suffered;Passing
Passes Attempted (Short, Medium, Long);
Passes Completed (Short, Medium, Long);
Into the Attacking Third;
Into the Attacking area; Into the Penalty area;
Data Analysis
About 24 variables of the game (official variables from UEFA's website) were analyzed in order to identify the variables that predict or have greater significance in the European Championship. They were analyzed through a discriminant analysis. The structure coefficients that were larger than (0.30), were interpreted as significant contributors.
The classification of variables was done using the Schwarz Similarity Model in-game two-step cluster criteria.
With this in mind, the 5 best and 5 worst teams were chosen regarding their classification in the championship, in order to compare and observe the differences taking into account the clusters' classification.
Results
The variables included in the study were classified according to the Schwarz Similarity in-game two-step cluster criteria, in which the highest value is 5 clusters. In the figure below, one can see the existence of the 5 clusters and their respective use in the teams throughout the championship.
All the variables analyzed in this study were identified using discriminant analysis, in which all variables above (0.30) allow us to construct an equation capable of predicting the cluster in which the match is classified. Thus, we can conclude that in cluster 1 the variable with the most significant values was the Corners 2 half, in cluster 2 it was the Fouls Suffered 1 half and Fouls Committed 1 half, cluster 3 did not have any significant value, and in cluster 4 it was the Long 2 half. And, finally, in cluster 5, the Distance Covered 1 half and Fouls Committed 2 half, as it can be seen in the table below.
Clusters Cluster1 Cluster2 Cluster3 Cluster4 Cluster5 Mean Std. Dev. N Mean Std. Dev. N Mean Std. Dev. N Mean Std. Dev. N Mean Std. Dev. N Ontarget1half 2.23 2.1 31 1.2 1.0 11 1.64 1.3 14 2.0 1.6 43 2.0 1.7 3 Offtarget1half 2.7 1.7 31 2.9 1.9 11 2.4 1.6 14 2.3 1.7 43 2.0 1.0 3 Blocked1half 1.7 1.4 31 1.2 1.3 11 1.5 1.2 14 2.3 1.7 43 2.0 1.6 3 Woodwork1half 0.2 0.5 31 0.3 0.5 11 0.1 0.3 14 0.1 0.4 43 0.0 0.0 3 Saves1half 1.7 1.7 31 1.0 1.3 11 1.6 1.1 14 1.6 1.4 43 1.0 0.0 3 Corners1half 2.4 2.0 31 3.1 2.0 11 2.9 2.1 14 2.4 1.9 43 3.0 1.0 3 BallPossession1 half 1.0 0.1 31 0.5 0.1 11 0.5 0.0 14 0.5 0.1 43 0.5 0.0 3 DistanceCovere d1 half 53706 1034 31 50421 528 11 52080 1038 14 54982 1201 43 60002 548 3
FoulsCommited 1 half 5.3 1.7 31 6.6 3.5 11 5.8 2.6 14 6.1 2.1 43 5.0 2.0 3 FoulsSuffered1 half 5.4 2.6 31 6.0 2.5 11 6.1 2.1 14 5.1 2.1 43 7.0 1.0 3 Short1half 54.7 14.7 31 48.1 21.1 11 51.1 18.4 14 50.9 17.3 43 45.7 8.1 3 Medium1half 137.5 47.2 31 118.2 60.6 11 126.6 50.6 14 130.9 56.2 43 131.7 52.2 3 Long1half 32.8 7.51 31 27.8 5.3 11 33.8 6.5 14 32.5 7.9 43 33.3 7.3 3 Intotheattackin gthird1halfATT 18.4 7.2 31 18.3 8.8 11 17.4 5.9 14 18.8 11.0 43 12.0 1.7 3 Intotheattackin gthird1halfCom p 7.6 3.1 31 7.1 4.8 11 7.4 4.0 14 6.6 3.5 43 5.0 1.7 3 Intothekeyarea 1halfATT 11.6 6.1 31 9.0 5.0 11 8.7 6.1 14 9.4 6.7 43 7.3 2.3 3 Intothekeyarea 1halfComp 4.7 2.3 31 5.5 4.1 11 4.9 2.7 14 4.7 3.4 43 3.0 1.0 3 Intothepenaltya rea1halfATT 4.4 3.0 31 5.6 3.4 11 4.5 2.1 14 4.5 3.6 43 4.7 1.5 3 Intothepenaltya reA1halfComp 1.5 1.5 31 1.1 1.0 11 1.1 1.3 14 1.4 1.1 43 2.0 1.0 3 Ontarget2half 2.3 1.7 31 2.4 1.4 11 1.9 2.0 14 2.4 1.7 43 2.3 1.6 3
Offtarget2half 3.4 1.4 31 3.6 1.9 11 2.7 2.3 14 2.7 1.9 43 1.0 1.7 3 Blocked2half 1.9 1.9 31 2.6 2.5 11 1.7 1.3 14 1.6 1.9 43 1.3 0.6 3 Woodwork2half 0.1 0.3 31 0.2 0.4 11 0.3 0.6 14 0.2 0.4 43 0.0 0.0 3 Saves2half 2.0 1.5 31 1.1 0.7 11 1.9 1.5 14 1.7 1.6 43 2.0 1.7 3 Corners2half 3.1 2.1 31 1.9 1.8 11 1.7 2.0 14 2.7 2.1 43 2.3 1.5 3 BallPossession2 half 0.5 0.1 31 0.5 0.1 11 0.5 0.1 14 0.5 0.1 43 0.4 0.0 3 DistanceCovere d2half 52814 1126 31 53515 1526 11 50713 1214 14 55897 1249 43 58593 580 3 FoulsCommited 2half 5.1 2.1 31 6.9 3.2 11 6.5 2.5 14 6.9 2.5 43 7.7 4.0 3 FoulsSuffered2 half 6.4 2.4 31 6.4 2.9 11 5.6 2.3 14 6.1 2.5 43 4.0 1.0 3 Short2half 54.4 19.6 31 51.1 19.6 11 56.8 22.1 14 49.4 22.2 43 37.0 8.7 3 Medium2half 132.6 49.6 31 122.2 45.7 11 113.7 43.5 14 128.1 60.7 43 111.0 15.4 3 Long2half 28.7 5.6 31 31.0 4.4 11 30.6 5.8 14 32.0 6.3 43 28.0 6.1 3
Table 1. Means, Standart Desviations and Structure Coefficients from the obtain model of clusters. Intotheattackin gthird2halfATT 19.8 9.3 31 20.5 6.6 11 18.0 8.2 14 19.6 10.3 43 14.7 3.5 3 Intotheattackin gthird2halfCom p 7.9 4.7 31 8.0 3.6 11 8.6 3.3 14 7.4 4.2 43 5.3 0.6 3 Intothekeyarea 2halfATT 12.2 7.8 31 13.1 7.5 11 10.3 8.0 14 11.5 7.8 43 10.0 1.0 3 Intothekeyarea 2halfComp 6.4 4.6 31 6.1 3.3 11 5.8 3.0 14 5.1 4.2 43 5.7 0.6 3 Intothepenaltya rea2halfATT 5.7 3.4 31 5.7 4.3 11 4.4 2.3 14 4.6 2.9 43 3.8 2.1 3 Intothepenaltya reA2halfComp 2.4 2.1 31 2.5 2.0 11 1.6 1.6 14 1.8 1.8 43 2.0 1.7 3
Variables Function 1 Function 2 Function 3 Function 4 On Target1half .181 .411 .087 .077 Off Target1half .014 .315 .011 -.059 Blocked1half .399 .276 .221 .247 Woodwork1half -.247 .284 -.053 -.308 Saves1half -.393 .086 -.032 -.110 Corners1half -.106 -.298 -.323 .052 BallPossession1half -.185 -.285 .022 -.705 DistanceCovered1half 1.159 -.171 .018 -.135 Short1half .627 .724 .429 .180 Medium1half .439 -.561 -.784 .940 Long1half .222 .896 -.063 .747 Intotheattackingthrid1halfATT -.961 -.426 1.226 -.233 Intotheattackingthird1halfCOMP -.201 .126 -.096 -.335 Intothekeyarea1halfATT .243 .500 -.283 .066 Intothekeyarea1halfCOMP -.259 -.368 -.329 .028 Intothepenaltyarea1halfATT 0.71 -.423 -.197 .347 Intothepenaltyarea1halfCOMP -.064 -.076 -.172 0.46
Table 2. Standardized coefficients from the discriminant analysis of match statistics for winning, drawing or losing from the whole sample of
mathces played in European Championship France 2016
On Target2half -.032 -.063 .380 .004 Off Target2half -.056 0.86 .310 -.108 Blocked2half -.315 -.299 -.280 -.104 Woodwork2half -.094 -.003 .250 .377 Saves2half 0.33 .350 .208 .227 Corners2half .020 .358 .515 -.155 FoulsCommited2half .048 -.520 .164 .128 FoulsSuffered2half -.145 -.080 .251 -.632 FoulsCommitted1half 0.70 0.53 .047 -.044 FoulsSuffered1half .133 .176 -.636 .098 Short2half -.459 .253 .621 1.052 Medium2half .039 .586 -.068 -1.376 Long2half -.144 -.678 .272 .227 IntotheattackingThird2halfATT -.284 -.266 .176 .163 IntotheattackingThird2halfCOMP .291 -.281 .471 .670 Intothekeyarea2halfATT .116 -.148 -.099 -.624 Intothekeyarea2halfCOMP .021 -.044 -.718 -.277 Intothepenaltyarea2halfATT .218 .044 -.629 .153 Intothepenaltyarea2halfCOMP .044 .124 -.490 -.200
After this identification, the discriminant analysis revealed four p statistically significant functions (p=0,001). However, the first two presented a total of 89.2% of the total variance, with canonical correlations of 0.92 and 0.65 respectively. The structure coefficients (SC) of the functions show emphasis on the Distance Covered 1 half and on the Fouls Committed 2 half. The obtained reclassification was very high and, therefore, asserts the accuracy of the mathematical model. The variables Distance Covered 1 half and Fouls Committed 2 half were identified as key variables, and these are the functions that predict the highest statistical significance in the current study.
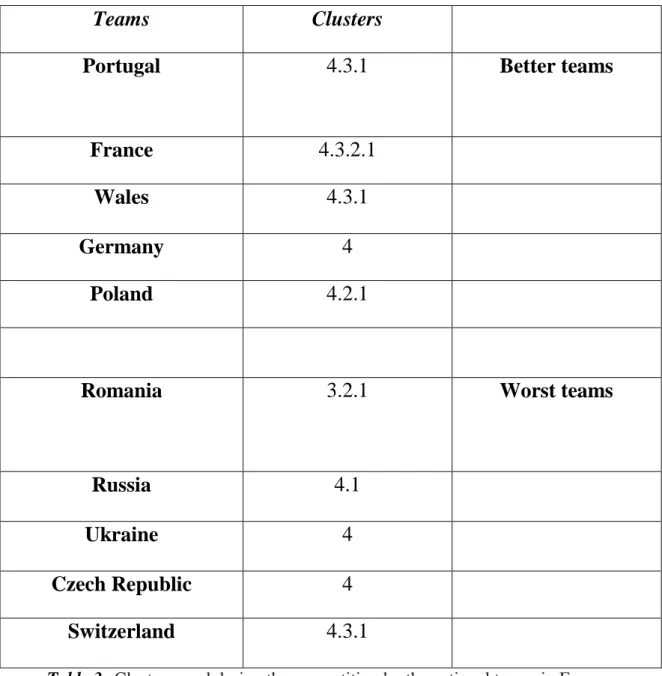
There was a selection of the 5 best teams, in terms of results, and the 5 weaker performance teams in the competition, in order to compare the number of clusters used. Thus the teams that represent the best ranked teams are: Portugal, France, Wales, Germany and Poland. While the chosen teams with weaker performances were: Romania, Russia, Ukraine, Czech Republic and Switzerland.
Table 3. Clusters used during the competition by the national teams in European Championship in France 2016
Teams Clusters
Portugal 4.3.1 Better teams
France 4.3.2.1
Wales 4.3.1
Germany 4
Poland 4.2.1
Romania 3.2.1 Worst teams
Russia 4.1
Ukraine 4
Czech Republic 4
Discussion
The objective of this study was to identify the performance indicators that differentiated between levels of success of the soccer game with the result of the European Championship 2016 and determine if the performance indicators differentiated between success and failure of the tams present in the competition. The results of the discriminant analysis identified 5 possible clusters, that is, 5 different combinations of all games among which cluster 5 was the one that stood out the most and was most significant in this study. The discriminant analysis allowed to identify having as keys variables Distance Covered in first half and as Fouls Commited in second half.
The results reveal differences in the total distance traveled throughout the competition. The teams that were better classified, belonging to cluster 5, have values of distance traveled greater than the teams of other clusters. These results confirm the study of (Rampinini, 2009), in which the most successful teams have higher values of distance traveled, averaging this distance with and without ball. On the other hand, the authors try to study the distance traveled in a more divided way, that is, they divide the analysis by positional sectors. According to (Di Salvo, Baron, R, Tschan, Montero, Bachl, Pigozzi, F, 2007), elite players run on average 10-12km per game. Using this study as a reference and taking into account that we are faced with a competitive level competition and a different form of competition, we can assume that the distance covered by the selections in the total of their games are among the values accepted by the literature. In this study and comparing this performance indicator between the 1 half and 2 half, it can be seen that there is a decrease of the same as the study by (Barros, Misuta, Menezes, Figueroa, Moura , Cunha, SA, Leite, 2007).
Other differences found in the results refer to the Fouls Commited 2 half. It is a variable that is associated with the defensive sector in which it depends a lot on the collective behavior and the strategy that the team prepared or trained for the game. This variable turns out to be related to other variables of the study, such as: yellow cards or red cards, but until today, there are few studies that report if there was a difference in relation to the teams being punished with the cards (Lago, 2010). Thus, it is possible to compare the number of faults committed among clusters, in which cluster 5 stands out, having higher values than other clusters. It is also possible to see (table 1) that there is an increase in the average of faults from the first to the second part, in that this is due in most cases to a decrease in the physical condition of the players or use this feature to hold a result.
Nowadays, national teams study strategies to go as far as possible in the competitions. Since it was possible to perform an effective analysis of the national teams' performance during the competition and based on the factors that distinguished the national teams in this competition, this part addressed the division of the teams by ranking/classification to try to find more factors that characterized the results during the competition. Thus, the teams were divided into two categories: top-ranked teams and worst-ranked teams. This division was made taking into account the lifespan/journey of the national teams in the competition, considering the number of points and the difference between goals scored and goals conceded, to identify the strengths and weaknesses of the teams, which led them to succeed or fail in the competition. The national teams tried to apply the tactical models, and the collective behaviors that they thought were the most suitable to reproduce their performance during the competition, thus presenting some variation of these. By analyzing table 3, we can see that the top-ranked teams presented,
throughout the study, a greater diversity of collective behaviors and tactical models during the competition than the worst-ranked teams. This is because the top-ranked teams have better resources, that is, better players that enable the adjustment of the tactical model or collective behavior during a game. On the other hand, the worst-ranked teams are not capable of changing their playing style, remaining faithful to the same strategy from the beginning to the end of the game. During the competition, the top-ranked teams used a more offensive/attacking playing style, while the worst-ranked teams adopted a more defensive game style to gain an advantage and defend it for as long as possible.
Having said that, the difference that defines this division between the top/worst-ranked teams revolves around the collective behavior and the tactical model used in the competition. By examining table 3, it is clear that the top-ranked teams present greater changes to their tactical model and collective behavior (represented by the clusters' variation) in comparison to the worst-ranked teams (little or no variation). The worst-ranked teams were loyal to their strategy, even if it was not the most appropriate one because they did not have enough resources or the ability to do better.
Conclusion
In summary, this study provided the analysis of the European Championship 2016, in France. It was found that the performance of the teams in this centred competition had five different responses. These responses were broken down into Distance Covered 1P, Suffered Fouls 1P, Corners 2P and Long Pass 2P. These variables may be related to defensive combativeness and physical conditioning. On the other hand, the number of clusters used by the teams in this competition was compared and it became clear that the teams that had variations of their style of play during and throughout the games in the competition obtained better rankings in the competition.
References
Barros RML, Misuta MS, Menezes RP, Figueroa PJ, Moura FA, Cunha SA, Anido R, Leite NJ. Analysis of the distances covered by first division Brazilian soccer players obtained with an automatic tracking method. J Sports Sci Med 2007; 6: 233-242;
Bredemeier, B. J., Shields, D. L., & Shields, D. L. (1986). Moral growth among athletes and nonathletes: A comparative analysis. The Journal of
Genetic Psychology, 147(1), 7-18;
Castellano, J., Casamichana, D., & Lago, C. (2012). The Use of match statistics that discriminate between successful and unsuccessful soccer teams. Journal of Human Kinetics, 31, 139–147. doi:10.2478/v10078-012-0015-7
Di Salvo V, Baron R, Cardinale M. Time motion analysis of elite footballers in European cup competitions. J Sports Sci Med 2007; Suppl. 10:14-15;
Di Salvo V, Baron R, Tschan H, Montero FJ, Bachl N, Pigozzi F. Performance Characteristics According to Playing Position in Elite Soccer. Int J Sports Med 2007; 28(3):222-227;
Gómez, M. Á., DelaSerna, A., Lupo, C., & Sampaio, J. (2014). Effects of situational variables and starting quarter score in the outcome of elite women’s water polo game quarters. International Journal of Performance Analysis in Sport, 14(1), 73–83.
Gómez, M. A., Lago-Peñas, C., & Pollard, R. (2013). Situational variables. In T. McGarry, P. O’Donoghue, & J. Sampaio (Eds.), Handbook of sports performance analysis (pp. 259–269). Oxon: Routledge.
Higham, D. G., Hopkins, W. G., Pyne, D. B., & Anson, J. M. (2014). Performance indicators related to points scoring and winning in international rugby sevens. Journal of Sports Science &Medicine, 13(2), 358–364.
Hughes, M., & Franks, I. (2005). Analysis of passing sequences, shots and goals in soccer. Journal of Sports Sciences, 23(5), 509– 514;
Hughes, M, & Franks, I. M. (Eds.). (2002). Notational analysis of sport: Systems for better coaching and performance in sport. Psychology Press.
Hughes M, Franks IM. Notational Analysis of Sport, London: E & FN Spon, 1997;
Hughes MD, Bartlett RM. The use of performance indicators in performance analysis. J Sport Sci, 2002. 20(10): 739-754;
Lago C. Are winners different from losers? Performance and chance in the FIFA World Cup Germany 2006. Int J Perform Anal Sport 2007; 7: 36–47. Lago-Peñas, C., Lago-Ballesteros, J., Dellal, A., & Gómez., M. (2010). Game-related statistics that discriminated winning, drawing and losing teams from the Spanish soccer league. Journal of Sports Science & Medicine, 9(2), 288– 293.
Liu, H., Gomez, M. Á., Lago-Peñas, C., & Sampaio, J. (2015). Match statistics related to winning in the group stage of 2014 Brazil FIFA World Cup. Journal
of sports sciences, 33(12), 1205-1213;
McGarry, T., Anderson, D. I., Wallace, S. A., Hughes, M. D., & Franks, I. M. (2002). Sport competition as a dynamical self-organizing system. Journal of
sports sciences, 20(10), 771-781;
April). Physical demands in high-level female soccer–application of fitness tests to evaluate match performance. In 11th World Congress on Science and
Football, May, Cardiff, Wales;
Rampinini E, Bishop D, Marcora SM, Bravo D, Sassi R, Impellizzeri FM. Validity of Simple Field Tests as Indicators of Match-Related Physical Performance in Top-Level Professional Soccer Players. Int J Sports Med 2009; 28(3):228-235.