Momentum strategies using
option-implied correlations
Final Assignment in the modality of Dissertation presented to Universidade Católica Portuguesa for obtaining the degree of Master in Finance
by
Vítor Hugo de Andrade e Nogueira
under the supervision of (PhD) Gonçalo Faria
Católica Porto Business School, Universidade Católica Portuguesa March of 2017
iii
Acknowledgements
I would like to thank everyone that supported me along this assignment. To my supervisor, Professor Gonçalo Faria, for collaborating with me along this challenging but very rewarding journey. Your guidance, permanent availability and untiring support, had a fundamental role in helping me beat my expectations.
To my parents, Manuela and Victor, for your unconditional support, for always believing in me and for assuring the conditions I need to pursuit my dreams.
To my family and all my closest friends, for their constant support.
For last but not least, I would like to dedicate this dissertation to my grandmother, Graciosa, that, unfortunately, passed away at the end of my masters’ first year. Rest in peace knowing that I will never forget you and, even though you deserve much more, I hope that honouring you this way will help me perpetuate my thank you for your relentless support.
v
Resumo
Em geral, o perfil risco-retorno da estratégia de momentum é como uma ‘faca’ de dois gumes. Por um lado, a estratégia oferece elevados retornos ajustados ao risco que superam os proporcionados pelas estratégias assentes nos fatores de mercado, value ou size. Mas, por outro lado, este notável desempenho é condicionado por uma elevada exposição ao risco de ‘crash’. i.e., risco de perdas muito elevadas apesar de pouco frequentes. Nesta dissertação pretendemos otimizar a implementação de uma estratégia de momentum no mercado acionista americano (NYSE, NASDAQ e AMEX). Para o efeito utilizamos, pela primeira vez na literatura, informação implícita nos preços de opções sobre um índice acionista de referência (S&P500) acerca da correlação esperada de retornos dos constituintes desse índice. Concluímos que utilizando a média móvel de 2 meses de uma proxy da estrutura temporal dessas expectativas para ajustar a exposição ao fator momentum, é possível melhorar significativamente o desempenho do momentum. Denominamos esta estratégia como Dinâmica. Esta estratégia melhora o potencial de ganho do momentum, mas mantém uma elevada exposição ao risco de ‘crash’ do momentum. Para ultrapassar este facto, propomos uma estratégia alternativa, que denominamos de Híbrida, a qual combina a estratégia Dinâmica com a estratégia ‘Risk-managed’, proposta por Barroso e Santa-Clara (2015). A estratégia Híbrida pode ser implementada em tempo real (i.e., apenas utiliza informação disponível até ao momento presente), apresenta retornos com ‘skewness’ positiva, e um ‘Sharpe ratio’ que mais do que triplica face ao da estratégia simples de momentum.
Palavras-chave: Momentum; Expectativas de Correlação Implícita em preços de opções; Risco de ‘crash’.
vii
Abstract
Generically, the risk-return profile of momentum strategies is a double-edged sword. On one hand, the strategy offers very attractive risk-adjusted returns, frequently outperforming those of strategies based on the market, value, or size factors. However, momentum strategies are highly exposed to the ‘crash’ risk, i.e., severe downside risk in rare occasions. In this dissertation, we aim to improve the implementation of a momentum strategy in the U.S. equity market (NYSE, NASDAQ and AMEX). With that purpose, and for the first time in the literature, we make use of information on the S&P500 index option-implied correlation of the index constituents returns. We conclude that by using the 2-month moving average of a proxy for the term structure of expected correlations across the S&P500 index constituents, implied in their option prices, it is possible to improve significantly the performance of momentum strategies. We denominate this strategy as Dynamic momentum strategy. It optimises the exposure to the upside potential of the momentum factor but continues to be exposed to the momentum’s crash risk. In order to manage this risk exposure, we propose another momentum strategy which we denominate by Hybrid momentum strategy, which combines the Dynamic momentum strategy and the Risk-managed momentum strategy, as proposed by Barroso and Santa-Clara (2015). This Hybrid momentum strategy can be implemented on real-time (i.e. only uses information available to the trader), generating returns with positive skewness and a Sharpe ratio that more than triples versus that of the plain-vanilla momentum strategy.
ix
Contents
Acknowledgements ... iii Resumo ... v Abstract ... vii List of Figures ... xiList of Tables ... xiii
1. Introduction ... 1
2. Literature Review ... 5
3. Data Description and Methodology ... 12
3.1. Data Description ... 12
3.2. Methodology ... 13
3.3. The S&P500 Implied Correlation and its Term Structure: some empirical evidence ... 16
4. Profiling Momentum ... 19
5. Dynamic and Hybrid Momentum Strategies ... 24
5.1. Dynamic Momentum Strategy ... 24
5.2. Hybrid Momentum Strategy ... 29
6. Robustness Check ... 37 6.1. Turbulent Periods ... 37 6.2. Limited Weights ... 39 6.3. Real-time Information ... 41 6.4. Trading Costs ... 44 8. Conclusion ... 48 Bibliography ... 50
xi
List of Figures
Figure 1: 2-month moving average of the S&P500 Implied Correlation (IC) for
30, 60, 91, 182 and 365 days ...17
Figure 2: 2-month moving average of the spread between the S&P500 Implied
Correlation (IC) for 365 days and the IC for 30 days ...17
Figure 3: Momentum (WML) and Market (RMRF) factors performance between
1930:01 and 1939:12 ...20
Figure 4: Momentum (WML) and Market (RMRF) factors performance between
2000:01 and 2009:12 ...21
Figure 5: Weighting on WML of the Dynamic momentum strategy (WML’) and
the relation between its determinants between 1996:04 and 2013:02 ...26
Figure 6: Dynamic momentum strategy (WML’) and plain momentum strategy
(WML) performance between 2000:01 and 2009:12 ...28
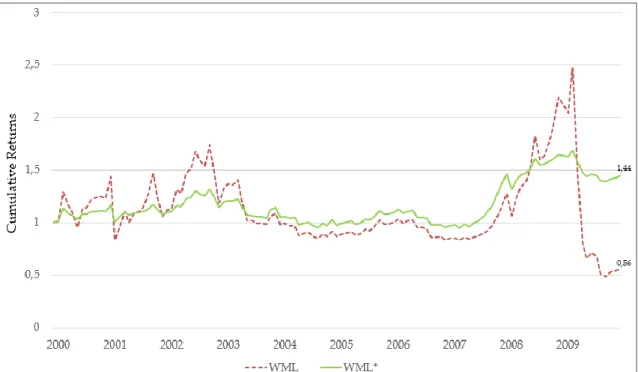
Figure 7: Risk-managed momentum strategy (WML*) and plain momentum
strategy (WML) performance between 2000:01 and 2009:12 ...30
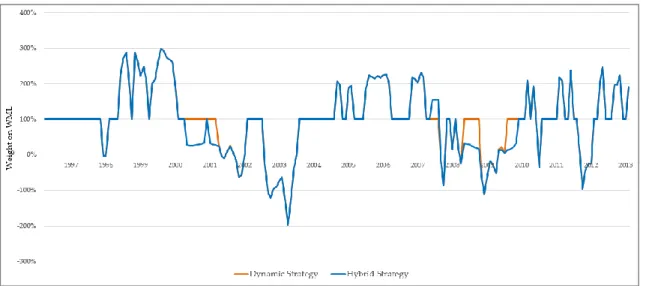
Figure 8: Weights of exposure to the WML factor in the Dynamic (WML’) and
Hybrid (WML’’) momentum strategies between 1996:04 and 2013:02 ...32
Figure 9: Monthly returns of the Dynamic (WML’) and Hybrid (WML’’)
momentum strategies between 1996:04 and 2013:02 ...33
Figure 10: Hybrid momentum strategy (WML’’) and plain momentum strategy
(WML) performance between 2000:01 and 2009:12 ...34
Figure 11: Hybrid momentum strategy (WML’’) and plain momentum strategy
(WML) performance between 1999:01 and 2001:12 ...37
Figure 12: Hybrid momentum strategy (WML’’) and plain momentum strategy
xii
Figure 13: Hybrid momentum strategy (WML’’) and plain momentum strategy
(WML) performance between 2010:01 and 2012:12 ...38
Figure 14: Hybrid momentum strategy (WML’’(T)) and plain momentum
xiii
List of Tables
Table 1: Summary statistics of WML, RMRF, SMB, and HML...19 Table 2: Ordinary Least Squared (OLS) regression of the WML on the Fama and
French factors ...22
Table 3: Mean and Percentiles 25 and 75 of the spread between the S&P500
Implied Correlation (IC) for 365 days and the S&P500 Implied Correlation (IC) for 30 days ...25
Table 4: Dynamic momentum strategy (WML’) and plain momentum strategy
(WML) summary statistics ...28
Table 5: Risk-managed momentum strategy (WML*) and plain momentum
strategy (WML) summary statistics ...30
Table 6: Percentiles 10 and 90 of the momentum’s (WML) returns forecasted
volatility ...31
Table 7: Summary statistics of the returns from the plain momentum (WML),
Risk-managed momentum (WML*), Dynamic momentum (WML’) and Hybrid momentum (WML’’) strategies...34
Table 8: Summary statistics for the different weight limited versions of the
Hybrid momentum strategy ...40
Table 9: Mean and Percentiles 25 and 75 of the spread between the S&P500
Implied Correlation (IC) for 365 days and the S&P500 Implied Correlation (IC) for 30 days ...42
Table 10: Percentiles 10 and 90 of the momentum’s (WML) returns forecasted
xiv
Table 11: Summary statistics for the Hybrid momentum strategy (WML’’),
which uses the full sample to compute its key values, and for the Hybrid
momentum strategy (WML’’(T)), which only uses data until 2015:12 to compute its key values ...43
Table 12: Trading costs of momentum ETFs ...45 Table 13: Summary statistics for the Hybrid momentum strategy in different
1
Introduction
Momentum is a strategy that consists in taking a long position in the winners’ portfolio and a short position in the losers’ portfolio. The underlying expectation is that the top decile portfolio will keep outperforming the lower decile (Jegadeesh & Titman, 1993). The most puzzling thing about this strategy is that, even though there is still no consensus on what explains this anomaly that defies the Efficient Market Hypothesis (e.g., Fama, 1970), it not only is a pervasive phenomenon across various markets and a wide range of asset classes (e.g., Asness, Moskowitz, & Pedersen, 2013) but also, when compared with strategies based on market, value, or size factors, offers the most attractive risk-adjusted returns on long-run series. However, the momentum-based strategy is also accompanied by significant downside risk which, during extreme market conditions, is very high and leads to massive crashes, as it is comprehensively shown by Barroso and Santa Clara (2015) and Daniel and Moskowitz (2016), among others.
Existing literature describes well the momentum strategy. However, there are still very few developments related to performance optimisation tools for the implementation of the momentum strategy.
This dissertation adds to the recent literature on the optimisation of the momentum strategy by trying to answer the following question: Is it possible to design an implementable momentum strategy that enhances the upside potential of the exposure to the momentum factor, while at the same time efficiently managing its downside risk? We believe this topic to be of major interest for institutional and retail investors, who are trading or expect to trade the momentum factor.
2
The fundamental idea is to build a dynamically adjusted exposure to the plain-vanilla momentum factor: be overexposed to that factor in ‘good’ times and underexposed (or even negatively exposed) when navigating in ‘bad’ periods. For the construction of the adjustment factor, we adopt a building block approach. We start to evaluate different indicators, all based on publicly available information, to improve the ‘upside’ potential of the momentum strategy. Then we move to the management of the downside risk.
From all indicators evaluated1, we conclude that using information related
with the term structure of expectations of future correlation in the equity market (S&P500 index) is the most valuable avenue to improve the upside potential of being exposed to the momentum factor. We perform several tests using daily data from January 1996 to January 2013 of option-implied correlation of the returns of the S&P500 index constituents for different maturities (30, 60, 91, 182 and 365 days) as computed in Faria and Kosowski (2016). It is the first time this set of data is being used in momentum related literature.
The first strategy we propose, denominated Dynamic momentum strategy, is based on an adjustment factor that uses the 2-month moving average of the spread between the S&P500 option-implied correlation for 365 days and the S&P500 option-implied correlation for 30 days. This spread is a proxy for the implied correlation term structure. We find that this strategy brings significant performance improvements when compared to the plain-vanilla momentum strategy, with very good timing regarding when to overexpose the portfolio to the momentum factor. However, this strategy is not able to significantly reduce
1 We studied the S&P500 option-implied correlation and its term structure, the S&P500 option-implied
volatility and its term structure, the Short Interest Index (see Rapach, Ringgenberg and Zhou, 2016) and the Economic Policy Uncertainty Index (see Baker, Bloom and Davis, 2015). Results are not presented in this document but are available for consultation.
3
the risk nor mitigate the crash risk exposure versus the plain-vanilla momentum strategy.
This leads us to introduce a risk management dimension into the adjustment factor, making use of the recent contribution from Barroso and Santa-Clara (2015). Concretely, we propose an upgraded strategy that starts from the Dynamic momentum strategy and adds the inputs from the Risk-managed momentum strategy proposed by Barroso and Santa-Clara (2015). We call this strategy the Hybrid momentum strategy. We show that this Hybrid momentum strategy, which is solely based on publicly available information for a trader, considerably outperforms the plain-vanilla momentum strategy: it presents a Sharpe ratio of 1,01 for the period under analysis (more than three times that of the plain-vanilla momentum strategy) and, very important for our analysis, its returns have positive skewness and are well immunized against the momentum crash risk. We test the robustness of the proposed strategy (Hybrid) by considering different weighting possibilities (i.e. different intervals for weights on the momentum factor), by introducing transaction costs, and by considering a different set of information available for the trader regarding option-implied correlations: the outperformance of the Hybrid momentum strategy continues to be remarkable.
5
Chapter 2
Literature Review
The seminal contribution for the dissemination of the momentum-based strategy is from Jegadeesh and Titman (1993), who document that stocks on the top (low) decile of market performance tend to outperform (underperform) the remaining stocks in the following three to twelve months.
Jegadeesh and Titman (1993, 2001) also show that, even though this strategy provides a significant excess return, momentum’s returns are difficult to interpret relying only on standard risk factors. The most puzzling thing about momentum is that, when compared with strategies based on market, value, or size factors (Fama & French, 1993), it offers very attractive risk-adjusted returns on long-run series, but its returns are negatively correlated with the returns of those three risk factors.
There exists a vast literature about the momentum-based strategies. A first group has been focused on the economic explanations of the momentum-based strategies remarkable performance. This has proven to be a great challenge for standard finance theory. Some studies (Jegadeesh & Titman, 1993, 2001; see also Daniel, Hirshleifer, & Subrahmanyam, 1998; Barberis, Shleifer, & Vishny, 1998; Hong & Stein, 1999; Grinblatt & Han, 2005; Hvidkjaer, 2006; Chui, Titman, & Wei, 2010) focus on the hypothesis of behavioural biases explaining momentum, namely the under-reaction of investors to firm-specific information. In this line of research, Hong, Lim and Stein (2000) document that momentum is negatively related to the coverage done by analysts, and Moskowitz, Ooi, and Pedersen (2012) also find evidence consistent with an initial under-reaction and delayed over-reaction of investors towards firm-specific news.
6
Alternative explanations for the momentum strategies performance includes hypothesis related with conventional risk-based models returns (e.g., Fama & French, 1996; Harvey & Siddique, 2000; Jegadeesh & Titman, 2001; Grundy & Martin, 2001; Chordia & Shivakumar, 2002; Johnson, 2002; Griffin & Martin, 2003; Cooper, Gutierrez, & Hameed, 2004; Martens & Oord, 2014), with firm characteristics (e.g., Hong et al., 2000), with credit risk (e.g., Avramov, Chordia, Jostova, & Philipov, 2007), with bankruptcy risk (e.g., Eisdorfer, 2008), with macroeconomic risk (e.g., Liu & Zhang, 2008), with trading costs (e.g., Lesmond, Schill, & Zhou, 2004; Korajczyk & Sadka, 2004) and with limits to arbitrage (e.g., Chabot, Ghysels, & Jagannathan, 2009).
A second stream of literature has been studying the presence of momentum across different time periods, markets and asset classes. There is empirical evidence supporting the existence of momentum has far as since 1801 (e.g., Jegadeesh & Titman, 1993, 2001; Chabot et al., 2009; Israel & Moskowitz, 2013; Geczy & Samonov, 2016).
Additionally, the existence of momentum trading opportunities have also been reported for many other countries beyond the U.S. (Rouwenhorst, 1998, 1999; see also Chan, Hameed, & Tong, 2000; Chui et al., 2010; Fama & French, 2012). It has also been documented that momentum exists in different asset classes, beyond equity markets (Asness et al., 2013), including foreign exchange markets (e.g., Okunev & White, 2003; Menkhoff, Sarno, Schmeling, & Schrimpf, 2012), commodities markets (e.g., Erb & Harvey, 2006), exchange-traded futures markets (e.g., Moskowitz et al., 2012) and bond markets (e.g., Asness et al., 2013).
A third stream of literature has been focused on the momentum crash risk (e.g., Daniel, Jagannathan, & Kim, 2012; Chabot, Ghysels, & Jagannathan, 2014; Barroso & Santa-Clara, 2015; Daniel & Moskowitz, 2016; Min & Kim, 2016). As it is comprehensively shown by Daniel and Moskowitz (2016), momentum
7
strong performance is occasionally interrupted by painful crashes that occur when the market is starting to recover after a considerable downswing accompanied by high volatility, as it happened in 1932 and 2009. Some researchers work point out as the principal culprit for those crashes a momentum’s time-varying beta (Grundy & Martin, 2001; see also Martens & Oord, 2014). As explained by Grundy and Martin (2001), after bull markets the beta is positive, and after bear markets it is negative, due to the method of construction of the momentum portfolio (long position on winners – with high betas – and short position on losers – with low betas). This implicates that, after market crashes, the stocks with lower betas will lose less than the high betas stocks, misleading the momentum portfolio to go long on low beta stocks (that were temporarily the best performers because of the market crash) and sell the high beta stocks (that temporarily underperformed because of the market crash). This implies that the plain-vanilla momentum strategy will have a negative beta after the market crash and when the market rebounds, the negative beta will lead to a (momentum) crash.
The contribution of this dissertation stands at this third stream of momentum literature. Our focus is to optimise the plain-vanilla momentum strategy by, improving its upside potential while, at the same time, managing the strategy’s exposure towards the momentum’s crash risk.
It has been proposed in the literature a relevant large group of alternative versions of the plain-vanilla momentum strategy, namely Grundy and Martin (2001), Blitz, Huij, and Martens (2011), Chuang and Ho (2013), Martens and Oord (2014), and Oord (2015).
Grundy and Martin (2001) show that plain momentum is dynamically exposed to the three risk factors of the Fama and French (1996) model. The authors propose a theoretical strategy (theoretical because it only works ex-post), designed to hedge “these exposures by adding positions in zero-cost
8
hedge portfolios based on ex-post estimates of factor exposures,” as explained by Bliz et al. (2011, p. 507). However, as the authors conclude and is further reinforced by Daniel and Moskowitz (2016), this strategy does not work as intended on an ex-ante basis and even though it provides smoother returns, it fails to avoid momentum crashes in real-time.
Blitz et al. (2011) propose a strategy, denominated residual momentum, which is similar to the plain-vanilla momentum strategy as proposed by Jegadeesh and Titman (1993) but, instead of using each stock gross return, they use the past residuals from the regression of the stocks returns on the Fama and French (1993) risk factors. Blitz et al. (2011) conclude that going long on the winners’ portfolio, which is the top decile portfolio of the ranked residual returns, and shorting the losers’ portfolio, which is the bottom decile portfolio of the ranked residual returns, is a strategy that offers a better and more stable performance than the plain-vanilla momentum. This strategy also delivers good results when applied to other markets beyond the U.S. equity market (Chaves, 2012).
Chuang and Ho (2013) propose the use of the Implied Price Risk (IPR), an index that provides information about the risk of a given stock being overpriced. The authors classify the IPR as the downside risk of a stock and use it to design a momentum-based strategy that incorporates the information from the index to refine the stock selection. The authors conclude that this IPR-momentum strategy outperforms the plain-vanilla IPR-momentum between 1930 and 2000, but that improvement is only marginal between 2000 and 2010.
Martens and Oord (2014) show that by “specifically accounting for the conditional pattern in the time variation of the exposures provides the best hedge” (p. 89) to momentum. The authors find that hedging momentum’s returns for time-varying risk exposures provides effective protection against significant losses during the market rebound when preceded by a market crash,
9
decreases the strategy’s volatility and offers smoother returns along the business cycle.
Oord (2015) creates an optimised momentum strategy, whose improvement is granted by bringing together the standard mean-variance optimisation and the momentum’s top and bottom characteristic that provides a more diversified portfolio selection. This strategy improves momentum’s performance whether regarding returns or risk, especially by providing a reduction in momentum’s returns time-varying exposure to business cycles and an attenuated impact on drawdowns.
Within this third stream of literature, this dissertation is mostly related with two recent works from Barroso and Santa-Clara (2015) and Daniel and Moskowitz (2016), that make use of one or more variables to dynamically weight, in real-time, the portfolio’s exposure to the plain-vanilla momentum factor.
Barroso and Santa-Clara (2015) propose an elegant method to manage the plain-vanilla momentum strategy’s risk. Their proposed strategy lies on the finding that the realised variance of the daily returns of the plain-vanilla momentum factor is highly predictable. Concretely, their scaled momentum strategy dynamically weights the exposure towards the plain-vanilla momentum by taking into account the relation between the expected variance of the momentum returns (forecasted based on the previous six months realized variance of the momentum daily returns) and a variance target level defined ad-hoc by the authors (12%): the strategy will leverage (reduce) the position on standard momentum when the expected variance is below (above) the target. This risk-managed strategy is found to be very effective in managing the downside risk. Overall, Barroso and Santa-Clara (2015) strategy offers higher and steadier returns for much less risk, especially much less exposure to the momentum crash risk.
10
Daniel and Moskowitz (2016) design an optimal dynamic strategy that uses the findings on the predictability of momentum premium and volatility in which the exposure to standard momentum portfolio is adjusted over time depending on the optimal condition that maximises the “unconditional Sharpe ratio of the portfolio” (p. 2). The optimal dynamic momentum strategy not only offers a substantive reduction in volatility, resulting in a smoother ride in the momentum returns wave, but also offers an impressive Sharpe ratio that outperforms the one from the plain momentum strategy and any other similar strategies, as, for example, the momentum strategy proposed by Barroso and Santa-Clara, 2015.
In such context, the major novelty from this dissertation is the consideration, for the first time in the momentum-related literature, of equity option-implied information to scale the exposure of one portfolio to the plain-vanilla momentum factor. Concretely, we propose two momentum strategies where the dynamic exposure to the plain-vanilla momentum factor is driven by the dynamic of the S&P500 index option-implied correlation term structure.
In this way, our work also relates to the emerging literature on the correlation risk, and more specifically to option implied expectations of future correlation in equity markets. This is a promising research avenue as, although volatility risk, its premium and term structure have been widely studied (e.g., Egloff, Leippold, & Wu, 2010; Ait-Sahalia, Karaman, & Mancini, 2015; Gruber, Tebaldi, & Trojani, 2016), the correlation risk has been relatively ignored. This is surprising because, as Driessen, Maenhout and Vilkov (2009), and Buraschi, Trojani and Vedolin (2014) show, the correlation risk premium explains a significant proportion of the variance risk premium.
This has motivated recent theoretical and empirical research on the correlation risk. Economic models from Martin (2013), Buraschi et al. (2014), Piatti (2014) and Ehling and Heyerdahl-Larsen (2016), explain how correlation
11
risk can arise endogenously and why it should carry a risk premium. From an empirical perspective, recent studies that use option data (e.g., Driessen et al., 2009, 2013; Buraschi et al., 2014; Buss, Schoenleber, & Vilkov, 2016) and hedge fund return data (Buraschi et al., 2014) show that stochastic correlation is a priced risk factor and good predictor of market returns. Faria, Kosowski and Wang (2016) additionally show that there exists a global correlation risk factor priced in international option markets. Particularly relevant for this dissertation, Faria and Kosowski (2016) focus on the dynamics of the option-implied correlation risk and its term structure, which reflects market expectations of future correlations at different maturities. This is potentially useful for the design of trading strategies based on early warning indicators and market dependent indicators that anticipate periods of particular stress (and calmness) in financial markets. We make use of Faria and Kosowski (2016) dataset on the option-implied correlation term structure for the design of the proposed momentum strategies in this dissertation. At best of our knowledge, it is the first-time option-implied information related with equity correlation risk is used in the design of momentum-based strategies.
12
Chapter 3
Data Description and Methodology
3.1. Data Description
We use daily and monthly data from January 1927 to September 2016, for ten momentum portfolios, the excess return on the market (RMRF), the Small Minus Big (SMB) and the High Minus Low (HML) factors, and the risk-free rate, which corresponds to the return of the 1-month T-Bill. This set of data is directly obtained from Kenneth R. French’s data library2.
The major novelty of the momentum-based strategies to be proposed in this dissertation is that they consist in dynamically adjusting the exposure to the plain-vanilla momentum factor using S&P500 index options implied information. Concretely, we make use of model-free expectations of future correlation of returns of S&P500 constituents implied in the S&P500 index options for different maturities (30, 60, 91, 182 and 365 days). We use daily and monthly time series of S&P500 index option-implied correlations for those different maturities, from January 1996 to January 2013, constructed by Faria and Kosowski (2016).3 We believe this set of option-implied correlation data to
be particularly interesting for our analysis due to different reasons. First, it is based on tradable options and therefore is information publicly available. Second, the underlying of those options is the equity index S&P500, which is a benchmark for global equity markets. Third, it is a pure forward-looking metric, as it is option-implied. Fourth, it is a model-free metric (to be explained in section 3.2). Fifth, option-implied correlations and their term structure carry
2 http://mba.tuck.dartmouth.edu/pages/faculty/ken.french/data_library.html
13
significant information regarding market timing and general market conditions, as found in Driessen et al. (2009), Buraschi et al. (2014), Faria and Kosowski (2016), and Faria et al. (2016), among others.
3.2. Methodology
The momentum-based strategies to be analysed are rebalanced on a monthly basis, after the last trading day of each month. The holding period of the rebalanced portfolio is the following month t, meaning that the rebalancing is done at the end of month t-1.
The momentum portfolios to be considered incorporate all NYSE, NASDAQ and AMEX shares which are categorised based on their cumulative returns from month t-12 to t-2. Following Fama and French (1996), the month immediately prior to the construction of the portfolios (t-1) is excluded with the objective of averting the short-term reversals evidenced by Jegadeesh (1990) and Lehmann (1990). Shares are then sorted into ranked deciles depending on their position relatively to the NYSE preceding return decile breakpoints4. The
group of shares in the highest decile (Portfolio 10) corresponds to the ‘winner’ portfolio, and those in the lowest one (Portfolio 1) represents the ‘loser’ portfolio. The weight of each company in the portfolio in which it is allocated, depends on the stock’s value relatively to the value of the portfolio, resulting in a value-weighted portfolio for each decile. The plain-vanilla momentum strategy (WML) consists in taking a long position in the winner portfolio (Portfolio 10) and shorting the loser portfolio (Portfolio 1). The proposed momentum strategies in this dissertation (Dynamic and Hybrid) are obtained
4 For more information related to the construction of the momentum portfolios, visit the Kenneth R.
14
by adjusting the exposure to the WML strategy by considering option-implied correlation based adjustment factors described in detail in Chapter 5.
Since data on the S&P500 option-implied correlation is at the core of this research project, and we are using data series constructed by Faria and Kosowski (2016), we briefly review their methodology to estimate the risk-neutral expectation of average pairwise correlation for the time period (t, T),
, using option prices.5
First, it is necessary to estimate the index and index constituents (single stocks) synthetic variance swap rates. Those rates are approximations of the risk-neutral expectations of future variance, represented by and , respectively, and can be synthesised from listed vanilla option prices (e.g., Britten-Jones & Neuberger, 2000; Bakshi, Kapadia & Madan, 2003; Carr & Wu, 2009). Faria and Kosowski (2016) adopt the methodology proposed by Bakshi et al. (2003), which make use of market prices of out-of-the-money (OTM) European calls and puts to extract the synthetic variance swap rates . This is often called a model-free implied variance approach, and is given by:
where and are the market prices of European calls and European puts at time t, with time to maturity of (T-t), and with strike price K. It is also important to refer that, as explained by Faria and Kosowski (2016), as long as prices are continuous and volatility is stochastic, this method delivers the estimate of the risk-neutral, or option-implied, integrated variance up until the option’s maturity. Faria and Kosowski (2016), in order to obtain these
5 An alternative approach to estimate
is to use correlation swap rates, if they are available. Faria
and Kosowski (2016) compare both approaches and conclude that using option prices publicly available to synthetically estimate the replicates accurately the real-world correlation swap rates.
15
option prices, use interpolated implied volatility surfaces for a range of standard maturities and a range of option deltas from IvyBD (Optionmetrics). Once this cross-section of index and individual stock variance swaps is obtained, the risk-neutral expectation of average pairwise correlation for the time period (t, T), , can be approximated through the model-free approach as in Buraschi et al. (2014). This leads to the Implied Correlation rate (ICt,T), which is given by:6
ni
i T t Q t i I T t Q t RV w E RV E 1 , 2 ,
i j j T t Q t i T t Q t j iw E RV E RV w , ,where and are the index and single stock synthetic swap variance rates over the period (t,T), and are the realized variance for the index and individual stock i over the same period (t,T), and is the market capitalization of stock i.
At last, in the forthcoming analysis, we will use a proxy for the term structure of option-implied expectations of correlation. That proxy is computed as the difference (spread) between the expected correlations for larger maturity (365 days) and for shorter maturity (30 days), as given by equation (2).
6 As highlighted by Faria and Kosowski (2016), the IC implied by option prices is not exactly the
correlation swap rate. Driessen, et al. (2013) show that only when individual stock variances are constant, IC is exactly the correlation swap rate. Otherwise, it is an approximation.
16
3.3. The S&P500 Implied Correlation and its Term
Structure: some empirical evidence
The major novelty this dissertation brings to existing literature consists in using data on option-implied correlation expectations to (re)design a simple equity momentum strategy. In this section, we briefly document some empirical evidence about the dynamics of the implied correlation of the S&P500 returns for different maturities and the corresponding term structure (see Faria and Kosowski, 2016 for a detailed analysis). By doing so, we also aim to economically motivate the adjustment factor driving the proposed momentum strategies in this dissertation.
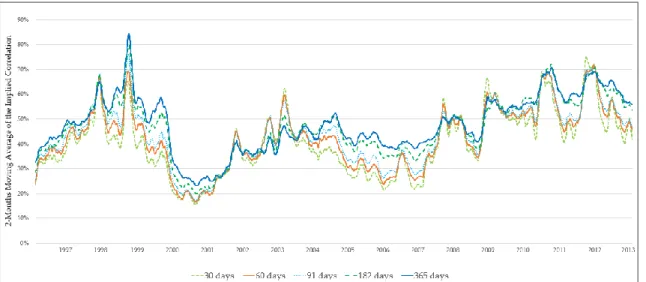
In Figure 1 is plotted the 2-month moving average of the S&P500 Implied Correlation for different maturities (30 days, 60 days, 91 days, 182 days and 365 days), computed as given by equation (2). The first insight from Figure 1 is that for most of the sample period, expected correlation increases with maturity. Moreover, it is also clear that, for all maturities, expected correlations change significantly and around periods of enhanced uncertainty as, for e.g. the 1998 LTCM7 collapse, the 9/11 terrorist attacks, the 2007/2008 beginning of the great
financial crisis and the 2011 sovereign debt crisis in Europe, they spike.
17
However, it is interesting to verify from Figure 1 that during those enhanced uncertainty periods, the risk-neutral expected correlation for shorter maturities increase relatively more than those for longer maturities. This suggests that the term structure of implied correlation also changes significantly throughout time. This is illustrated in Figure 2, which plots the 2-month moving average of the spread between the S&P500 Implied Correlation with the highest available maturity (365 days) relative to the S&P500 Implied Correlation with the shortest maturity (30 days).
Figure 1: 2-month moving average of the S&P500 Implied Correlation (IC) for 30, 60, 91, 182 and 365 days. ICs are
computed as given by equation (2) in the text using daily observations for the period between 1996:01 and 2013:01.
Figure 2: 2-month moving average of the spread between the S&P500 Implied Correlation (IC) for 365 days and the
IC for 30 days. ICs are computed as given by equation (2) in the text using daily observations for the period between 1996:01 and 2013:01.
18
From Figure 2, it is clear that for most of the sample period the slope of the S&P500 Implied Correlation (IC) term structure, proxied by the spread between the IC for 365 days and the IC for 30 days, is positive. However, during some subperiods of increased uncertainty in equity markets the term structure of IC flattens or even becomes negative. Examples of those sub-periods are (i) the Asian financial crisis, which started in July 1997 and lingered through 1998 (year that was also marked by the LTCM collapse); (ii) after the 9/11 terrorist attacks; (iii) during the slowdown of the U.S. economy between 2002 and 2003; (iv) the subprime crisis, which started in July of 2007, and whose effect was amplified by the Lehman Brothers collapse in September of 2008; (v) the European sovereign debt crisis’ peak and the first-ever downgrade of the U.S. sovereign debt by Standard & Poor between June and October 2011. A structural explanation for this empirical evidence on the flattening of the implied correlation term structure is studied in Faria and Kosowski (2016) through a general equilibrium Lucas tree model with heterogeneous agents.
All in all, Figures 1 and 2 highlight a pattern of the S&P500 Implied Correlations dynamics around periods of increased stress in financial markets: (i) increase in expected correlations, regardless of the maturity; (ii) the increase in expected correlations for longer maturities is relatively lower than for shorter maturities, which represents a flattening of the implied correlation term structure.
Motivated by this robust empirical evidence on the dynamics of the IC term structure, our proposed momentum strategies (Dynamic and Hybrid) aim to use the economic insight from the IC term structure evolution to dynamically adjust the exposure to the WML strategy. Ideally, we aim our strategies to be overexposed to the WML factor during good and steady times, while reducing that exposure or even shorting the WML factor during turbulent times in equity markets. In Chapter 5 we elaborate on this with detail.
19
Chapter 4
Profiling Momentum
In this chapter, we present the main empirical features of the plain-vanilla momentum strategy (WML).
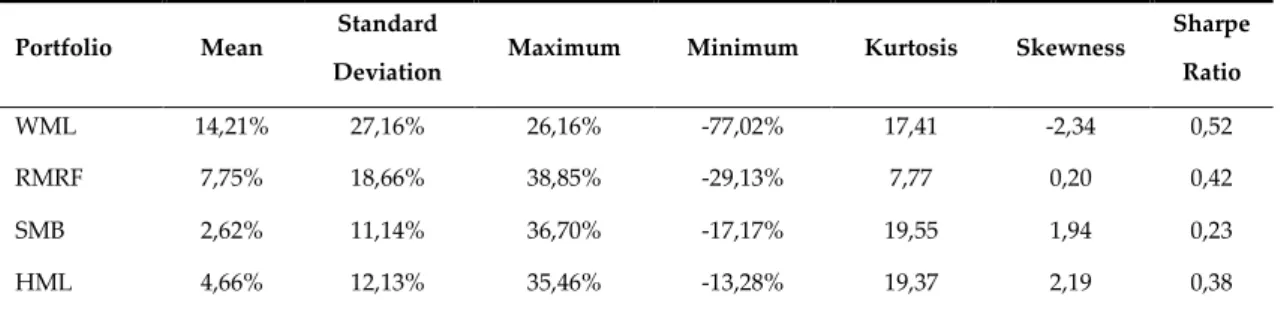
Portfolio Mean Standard
Deviation Maximum Minimum Kurtosis Skewness
Sharpe Ratio WML 14,21% 27,16% 26,16% -77,02% 17,41 -2,34 0,52 RMRF 7,75% 18,66% 38,85% -29,13% 7,77 0,20 0,42 SMB 2,62% 11,14% 36,70% -17,17% 19,55 1,94 0,23 HML 4,66% 12,13% 35,46% -13,28% 19,37 2,19 0,38
In Table 1 are presented the summary statistics of WML and of Fama and French (1993) factors for the period from January 1927 to September 2016, computed using monthly data. It is interesting to observe that WML offers an average yearly return of 14,21% which almost doubles the second best (the market portfolio factor (RMRF), with an average yearly return of 7,75%). Although this higher average yearly return of the WML versus other factors is obtained at the expense of higher standard deviation, the 0,52 average yearly Sharpe ratio of WML tops the ones from the remaining portfolios. However, moving beyond the mean-variance analysis, results in Table 1 show that the WML appears to be haunted by a considerable crash risk: very high kurtosis (17,41) and negative skewness (-2,34) suggest the existence of a very fat left tail, which implies a serious possibility of an investor’s WML portfolio being run over by a relentless avalanche that takes most of the earnings of decades on its
Table 1: Summary Statistics of WML (momentum or winners minus losers’ portfolio), RMRF (market portfolio
minus risk-free), SMB (size factor or small minus big portfolio), and HML (value factor or the high minus low portfolio). The presented statistics are computed using monthly observations from 1927:01 to 2016:09. The mean, standard deviation, and Sharpe ratio are annualised.
20
way down. As Barroso and Santa-Clara (2015) and Daniel and Moskowitz (2016) comprehensively show, these momentum crashes are not only alarming for what a crash can do to an investor’s portfolio but also for the particular severity of the damage it can cause, as it is possible to see by the fact that momentum’s biggest loss is of -77,02% in only one month (August of 1932). This is more than two times the worst crash registered by the market factor (RMRF), which is the second harshest monthly loss from all factors under analysis.
For a better perception of this crash risk, we selected the two largest crashes WML faced since January 1927, while including the market (RMRF) as a reference.
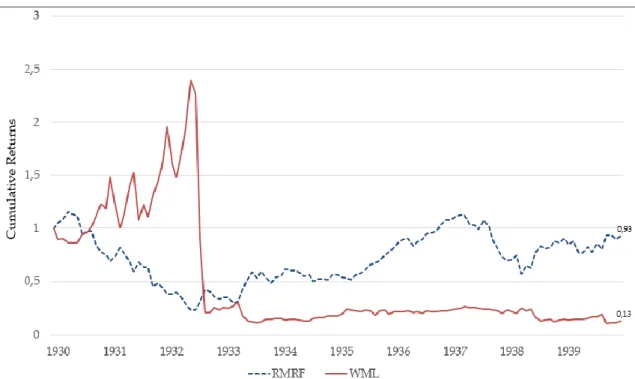
Figure 3 exhibits the turbulence lived during the 1930’s decade, especially during 1932, where a momentum crash occurred. The WML investors suffered a cumulative loss of -91,29% in only three months between the first trading day of June and the last trading day of August of that same year. To put it simply,
21
an investor that invested 1 monetary unit in a WML strategy on the first trading day of January 1930 and was affected by the 1932 crash, not only ended the 1930’s decade with only 0,13 monetary units but would also had to wait until June 1957 (more than 27 years) to receive her initial investment (this without considering the opportunity cost). Doing the same exercise for a WML investor that started the investment on the first trading day of June 1932 (i.e., the beginning of the three-month crash-period), the investor would have to wait until October of 1963 (more than 31 years) to receive her initial investment.
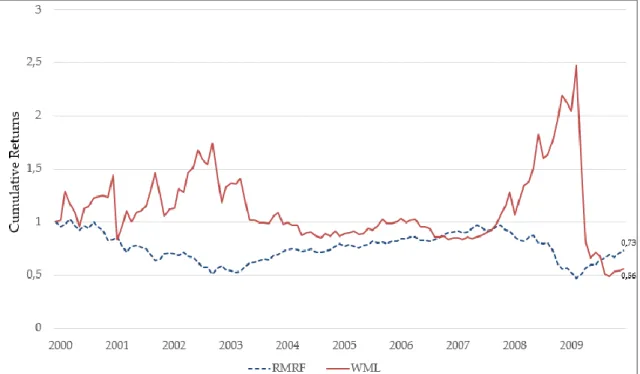
Figure 4 shows the evolution of the cumulative returns for strategies based on the WML and market portfolio factors for the period between January 2001 and December 2009. During this period, another momentum crash burst, this time in 2009, leading the WML investor to face a cumulative loss of -73,38% between the first trading day of March and the last trading day of May of that same year. This means that an investor that invested 1 monetary unit on the
22
first trading day of January 2000 in a WML portfolio and was still invested by the time of the 2009 crash would have to wait until July 2015 (approximately 15,5 years) to receive her initial investment (ignoring the opportunity cost). Doing the same exercise for an investor that hypothetically made the 1 monetary unit investment in the WML portfolio on the first trading day of March 2009 (beginning of the three-month crash period), by the end of September 2016 the investor wouldn’t have recovered her investment and the value of the portfolio would be approximately 33% of the initial investment.
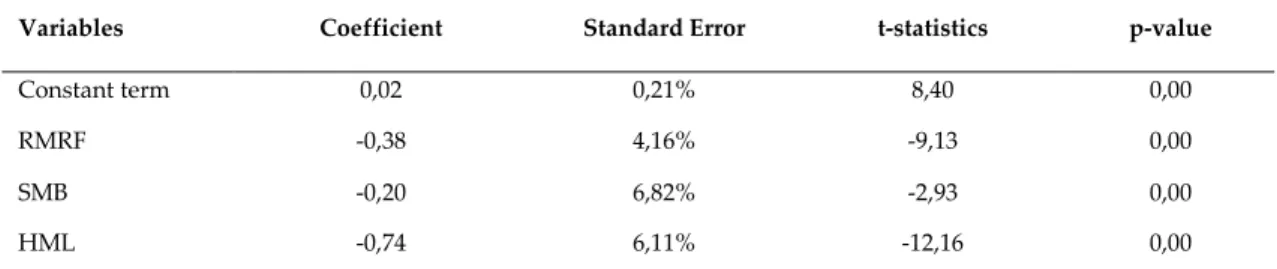
Another interesting angle of analysis is the relationship between the WML strategy and the Fama and French’s (1993) three factors (RMRF, SMB and HML). With that purpose, we regress the WML factor on the three risk factors, through the OLS method and using monthly data between January 1927 and September 2016. Results are presented in Table 2. The WML strategy has a monthly abnormal return of 1,76%, which corresponds to an impressive 21,15% on a yearly basis. Moreover, results from the regression also show that, for the long period under analysis, there is a statistically significant negative relationship between the WML and each of the three Fama and French (1993) risk factors.
Variables Coefficient Standard Error t-statistics p-value
Constant term 0,02 0,21% 8,40 0,00
RMRF -0,38 4,16% -9,13 0,00
SMB -0,20 6,82% -2,93 0,00
HML -0,74 6,11% -12,16 0,00
Table 2: Ordinary Least Squares (OLS) regression of the WML (momentum or winners minus losers’ portfolio)
on the Fama and French factors (RMRF, which represents the market portfolio, SMB which represents the size factor or small minus big portfolio and HML, which represents the value factor or the high minus low portfolio). The presented results are obtained using monthly observations between 1927:01 and 2016:09.
23
Overall, considering this empirical evidence for such a long period, the momentum’s outperformance relatively to the market portfolio, its higher Sharpe Ratio, and its negative relationship with the traditional Fama and French (1993) factors, justifies the popularity and curiosity this strategy generates among investors and researchers. There is a significant upside potential to be explored related with momentum strategies. However, as illustrated above, momentum strategies are particularly exposed to a crash risk. This has motivated recent work from Barroso and Santa-Clara (2015) and Daniel and Moskowitz (2016), who successfully created strategies that allow managing the downside risk of the WML strategy. Concretely, Barroso and Santa-Clara (2015) propose a Risk-managed momentum strategy based on the realised volatility of the WML returns while Daniel and Moskowitz (2016) suggest an optimal dynamic momentum strategy that uses, not only the predictable variance of WML returns but also WML’s forecastable returns.
In this dissertation, we build on this recent literature and try to optimise the exposure to the WML strategy, making use of S&P500 index option-implied correlation information instead of using data extracted from momentum itself, while trying to simultaneously manage the downside risk exposure. This leads us to the proposed momentum strategies, explained in the next chapter.
24
Chapter 5
Dynamic and Hybrid Momentum Strategies
5.1. Dynamic Momentum Strategy
Assume WML’s monthly returns to be represented by , that corresponds to the last trading day of the month prior to month t and that represents the time series of the last trading days of all months included in the sample.
Using daily data from January 1996 to January 2013, for the S&P500 Implied Correlation (IC) for different maturities, computed as given in equation (2), we start to compute the 2-month moving average (MA) of the spread between the S&P500 Implied Correlation for 365 days (IC(365d)) and the S&P500 Implied Correlation for 30 days (IC(30d)) for each trading day. This is our proxy, as explained in Chapter 3, to the S&P500 index implied correlation term structure. So, for the last trading day of each month prior to month t, that spread is represented by:
-
. (3)
Note that each month is assumed to have 21 trading days, and therefore in equation (3) we consider 42 days corresponding to two months.
Afterwards, we obtain the mean, percentile 75 and percentile 25 of the spread between the S&P500 IC(365d) and the S&P500 IC(30d), which are reported in Table 3 (for the remaining chapters, every time there is a reference to ‘Spread Mean’, ‘Spread Percentile 25’, and ‘Spread Percentile 75’ we will be referring to
25
the mean, percentile 75 and percentile 25 of the spread between the S&P500 IC(365d) and the S&P500 IC(30d), respectively).
Indicator Mean Percentile 25 Percentile 75
S&P500 IC Spread 7,63% 2,38% 13,98%
The proposed Dynamic momentum strategy (WML´) consists in adjusting the exposure to the WML strategy using information about the S&P500 option-implied correlation term structure. Concretely, the return of the WML´ for the month t, , is given by
where is the return granted by the WML strategy in month t, and is the weight given by the WML’ strategy to the WML factor for month t. This weight is determined in the following way:
From (5) results that when the 2-month moving average of the spread between the S&P500 Implied Correlation for 365 days and the S&P500 Implied Correlation for 30 days in the last trading day of the prior month to month t is equal or higher than the Spread Percentile 75, the portfolio will be overexposed to the WML strategy; when the 2-Month Moving Average of the spread between the S&P500 Implied Correlation for 365 days and the S&P500 Implied
Table 3: Mean and Percentiles 25 and 75 of the spread between the S&P500 Implied Correlation (IC) for 365 days
and the S&P500 Implied Correlation (IC) for 30 days. IC is computed as given by equation (2) in the text. The presented values are based on daily data from 1996:01 to 2013:01.
26
Correlation for 30 days in the last trading day of the prior month to month t is equal or lower than the Spread Percentile 25, the portfolio will be underexposed or even shorting the WML portfolio; and when the 2-month moving average of the spread between the S&P500 Implied Correlation for 365 days and the S&P500 Implied Correlation for 30 days in the last trading day of the prior month to month t is higher than the Spread Percentile 25 but lower than the Spread Percentile 75, the WML’ strategy will replicate 100% the WML strategy.
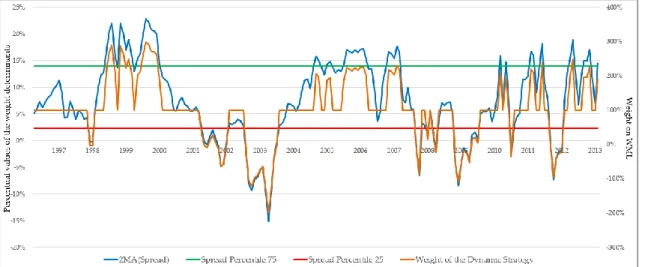
In Figure 5 it is plotted the dynamic of the weight on the WML factor of the WML’ strategy, as defined in (5), as well as the behaviour of its determinants during the sample period. In line with the empirical evidence presented in Chapter 3, during more stable periods, implied correlations for shorter maturities are lower than those for longer maturities, consequently leading to an increase in the spread, while in periods of increased turbulence, implied correlations for shorter maturities increase more than the implied correlations for longer maturities, leading to a decrease in the spread (flattening of the IC term structure) that, sometimes, can even become negative. Consequently, as illustrated in Figure 5, the level of exposure to the WML strategy by the WML’
Figure 5: Weighting on WML of the Dynamic momentum strategy (WML’), as described in equation (5) in the text,
27
strategy, increases during more favourable periods (for example, in 1999 and 2006) and is reduced, or even assumes short positions, during enhanced uncertainty times (for example, in 2001 and 2008). However, by looking at Figure 5, it seems to exist a certain inertia in some critical moments, leading to the suspicion of an inefficient hedging of the downside risk by the WML’ strategy.
With this in mind, we focus the analysis on the most recent decade that faced the second most destructive momentum crash since 1927. The cumulative returns of 1 monetary unit invested in WML and WML’ strategies at the beginning of January 2000 are plotted in Figure 6. There is no doubt that, in general, the WML’ strategy is a high-performing momentum-based strategy, but, looking at the 2009 crash, even though it offers a considerable gain to its investors while WML is crashing, immediately after, it also crashes, proving that the crash risk is still very present. The inertia, or lag-effect between the WML and WML’ dynamics, may be due not only to the fact that the weight in equation (5) is computed based on moving averages but also to the intrinsic persistency properties of option-implied correlation metrics (as explored in Faria and Kosowski, 2016).
28
In Table 4 we present the summary statistics of the WML’ strategy for the time period between April 1996 and February 2013. Summary statistics of the WML strategy for the same period are also presented in Table 4, working as the benchmark.
Portfolio Mean Standard
Deviation Maximum Minimum Kurtosis Skewness
Sharpe Ratio
WML 9,75% 33,06% 26,16% -45,79% 5,50 -1,39 0,30
WML’ 33,69% 35,92% 57,81% -41,97% 5,47 0,76 0,94
Results in Table 4 show the superiority, in terms of performance, of the WML’ strategy versus the WML strategy: it is translated in an impressive increase in the Sharpe ratio from 0,30 to 0,94. Moreover, for slightly the same level of kurtosis, the WML’ presents returns with positive skewness, which is very encouraging. However, looking at the minimum level of returns (-41,97%
Table 4: Dynamic momentum strategy (WML’) and plain momentum strategy (WML) summary statistics. The
presented statistics are computed using monthly observations between 1996:04 and 2013:02. The mean, standard deviation, and Sharpe ratio are annualised.
Figure 6: Dynamic momentum strategy (WML’) and plain momentum strategy (WML) performance between
29
vs. -45,79% for WML), it seems that the WML’ strategy is not able to significantly reduce the exposure to the momentum crash risk.
Considering the entire period of analysis (April 1996 to February 2013), an investor that invested 1 monetary unit on the first trading day of April 1996 in the WML strategy and kept invested until February 2013, would have received approximately 1,84 monetary units at the end of the holding period. Alternatively, if the investor allocated that 1 monetary unit in the WML’ strategy, she would have received approximately 100,00 monetary units at the end of February 2013. This is more than 54 times what would have been received from the WML strategy.
5.2. Hybrid Momentum Strategy
The WML’ strategy delivers a very strong performance and a great timing regarding when to overexpose the portfolio to the WML factor. However, continues to be exposed to the same crash risk as the WML strategy. This motivates the proposed Hybrid momentum strategy (WML’’).
The WML’’ strategy combines the WML’ strategy with the Risk-managed momentum strategy (WML*) proposed by Barroso and Santa-Clara (2015). The driving force of this combination is to mitigate the exposure to the momentum crash risk, trying to correct occasional lagging errors in the WML’ strategy.
Barroso and Santa-Clara (2015) propose a Risk-managed momentum strategy in which the exposure to the momentum factor (WML) is inversely proportional to the variance of past WML returns. To construct the WML* strategy, Barroso and Santa-Clara (2015) start by using daily returns from the previous 126 trading days in order to obtain the WML return volatility forecast for the next month t ( ). This is used to weight the WML* strategy exposure to the WML
30
factor. Concretely, given a constant volatility target that was chosen by Barroso and Santa-Clara (2015) to be 12%, the WML* strategy return, represented by , is:
where, is the WML strategy return in month t, and is the weight driving the exposure in month t of the WML* strategy towards the WML factor.
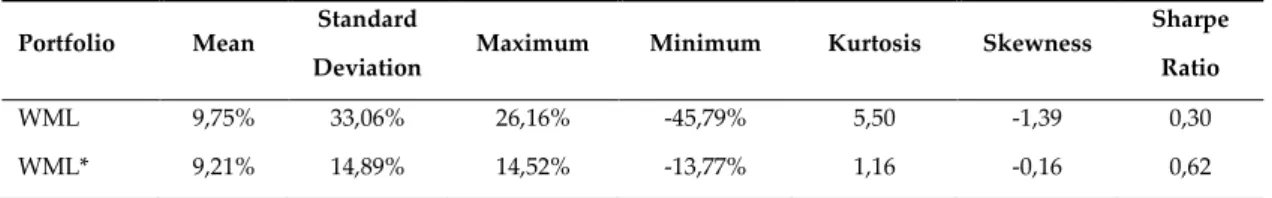
In Table 5 are presented the summary statistics of the returns of Barroso and Santa-Clara’s (2015) WML* strategy during our sample period (from April 1996 to February 2013). Summary statistics for WML for the same period are also presented.
Portfolio Mean Standard Deviation
Maximum Minimum Kurtosis Skewness Sharpe Ratio
WML 9,75% 33,06% 26,16% -45,79% 5,50 -1,39 0,30
WML* 9,21% 14,89% 14,52% -13,77% 1,16 -0,16 0,62
Results in Table 5 illustrate well the fact that, compared with the WML strategy, Barroso and Santa-Clara’s (2015) WML* strategy returns have a significant reduction of extreme negative values (from -45,79% to -13,77%), its standard deviation more than halved (from 33,06% to 14,89%), translating into a Sharpe ratio of 0,62, and there is also a relevant reduction in its kurtosis and an increase in its skewness.
Table 5: Risk-managed momentum strategy (WML*) and plain momentum strategy (WML) summary statistics. The
presented statistics are obtained from monthly observations between 1996:04 and 2013:02. The mean, standard deviation, and Sharpe ratio are annualised.
31
Figure 7 illustrates how well the WML* strategy efficiently manages the most devastating momentum crash since the 1930’s, the 2009 crash. For an investor that invested 1 monetary unit in the first trading day of January 2000 in the WML* strategy, ended the decade almost untouched by the crash and with 1,44 monetary units. Conversely, an investor that adopted the WML strategy not only would have suffered an enormous loss from the crash but also would have ended the decade with fewer monetary units than the 1 unit invested at the very beginning of the period under analysis (0,56).
Evidence in Table 5 and Figure 7 shows how efficiently Barroso and Santa-Clara (2015) strategy manages the downside risk (in particular, crash risk) of momentum strategies. It is this property of the WML* strategy that we want to bring to the Dynamic momentum strategy (WML’), leading us to propose the Hybrid momentum strategy (WML´´) to be explained in the following paragraphs.
Figure 7: Risk-managed momentum strategy (WML*) and plain momentum strategy (WML) performance between
32
We start to compute the percentiles 10 and 90 from the daily data of the forecasted volatility calculated using the same method used by Barroso and Santa-Clara (2015). Results are presented in Table 6 (for the remaining chapters, every time there is a reference to ‘ Percentile 10’, and ‘ Percentile 90’ we will be referring to the percentiles 10 and 90 of the momentum returns forecasted volatility using Barroso and Santa-Clara (2015) method).
Indicator Percentile 10 Percentile 90
WML returns forecasted volatility 8,23% 35,02%
Under the WML’’ strategy, the weight allocated to the WML portfolio is obtained by filtering the WML’ strategy’s weight , as given in equation (5). Concretely, the weight of the WML’’ strategy for month t, , is given by:
where represents the weight of the WML* strategy in month t, as given in equation (6), and represents the WML return volatility forecast for month t based on the WML returns from the previous 126 days (as in Barroso and Santa-Clara, 2015).
The effect of this filtering is evident in Figure 8 where the weights of the WML’’ strategy ( ) and of WML’ strategy ( ) are plotted, for the sample period between April 1996 and February 2013.
Table 6: Percentiles 10 and 90 of the momentum’s (WML) returns forecasted volatility. The presented values are
33
This implies that the return generated by the WML’’ strategy in month t, , is given by:
(8)
where represents the weighting on the WML factor of the WML’’ strategy in month t, from equation (7), and is the return offered by the WML strategy in month t.
Figure 9 plots the dynamics of monthly returns from the WML’’ and WML’ strategies: it is clear that the purpose of reducing the WML’ exposure towards eventual momentum crashes is successfully accomplished.
Figure 8: Weights of exposure to the WML factor in the Dynamic (WML’) and Hybrid (WML’’) momentum
34
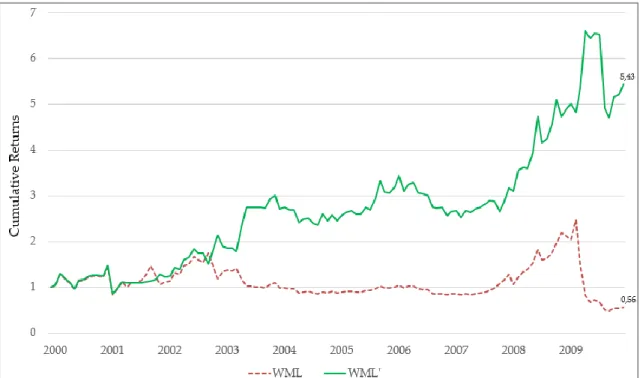
This is further highlighted in Figure 10, where cumulative returns are plotted. It is clear that the WML’’ strategy suffers a minor loss around the 2009 momentum (WML) crash, completely avoiding the crash’s devastating effect, while keeping the upside potential of the WML’ strategy.
Figure 9: Monthly returns of the Dynamic (WML’) and Hybrid (WML’’) momentum strategies between 1996:04 and
2013:02.
Figure 10: Hybrid momentum strategy (WML’’) and plain momentum strategy (WML) performance between
35
Table 7 reports the summary statistics of the returns from the Hybrid momentum strategy (WML’’), the Dynamic momentum strategy (WML’), the Barroso and Santa-Clara’s (2015) Risk-managed momentum strategy (WML*) and the plain momentum strategy (WML).
Portfolio Mean
Standard
Deviation Maximum Minimum Kurtosis Skewness
Sharpe Ratio WML 9,75% 33,06% 26,16% -45,79% 5,50 -1,39 0,30 WML* 9,21% 14,89% 14,52% -13,77% 1,16 -0,16 0,62 WML’ 33,69% 35,92% 57,81% -41,97% 5,47 0,76 0,94 WML’’ 32,88% 32,55% 57,81% -20,48% 6,46 1,64 1,01
Results in Table 7 confirm the risk-adjusted performance superiority of the WML’’ strategy relatively to the remaining momentum strategies. The WML’’ strategy delivers a slightly lower average yearly return than the WML’ strategy, which is more than compensated by the reduction in its returns’ standard deviation, leading to the highest Sharpe ratio of all four strategies (1,01) under analysis. Only the strategy proposed by Barroso and Santa-Clara (2015), WML*, provides a lower exposure to the momentum crash risk than the WML’’ strategy. This is expected since the WML* strategy is focused in managing the downside risk. Another improvement from the WML’’ strategy worth mentioning is the dimension of the reduction of the largest monthly loss when compared to the WML’ and WML strategies (-20,48% versus - 41,97% and – 45,79%, respectively), without having to sacrifice almost none of the upside. This improvement in managing the downside risk, especially in mitigating momentum’s crash risk, is a fundamental characteristic of the WML’’ strategy to have under consideration. At last, it is also relevant to highlight that the
Table 7: Summary statistics of the returns from the plain momentum (WML), Risk-managed momentum
(WML*), Dynamic momentum (WML’) and Hybrid momentum (WML’’) strategies. The statistics presented for each portfolio are computed using monthly observations from 1996:04 to 2013:02. The mean, standard deviation and Sharpe ratio are annualised.
36
WML’’ strategy returns show an increased level of positive skewness versus that from the WML’ strategy.
At last, for further illustration of the performance of the WML’’ strategy, it is interesting to have a dynamic perspective of how well the strategy does when compared with the WML’, WML* and the WML strategies for the full period under analysis (from April 1996 to February 2013).
Assume that three investors invested each 1 monetary unit on the first trading day of April 1996: (i) the first one in the WML strategy, (ii) the second one in the WML’ strategy and (iii) the third one in the WML* strategy. They would have received, approximately (i) 1,84, (ii) 100,00 and (iii) 3,92 monetary units, respectively, at the closing of the last trading day of February 2013. Doing the same exercise for an investor that allocated 1 monetary unity to the WML’’ strategy, she would have received approximately 110,13 currency units, almost 60 times what would have been received from the WML strategy. Comparing with the payoff from the WML’ strategy, this investor would have obtained a higher cumulative return while being much less exposed to an eventual momentum crash.
37
Chapter 6
Robustness Checks
6.1. Turbulent Periods
In this subsection, we test the cumulative return performance of the WML’’ strategy using the WML strategy as the benchmark during the most turbulent times in financial markets since January 1996. We decided to focus in subsamples of only three years so that past performance does not excessively bias the analysis.
Figure 11 plots the cumulative returns performance of the WML’’ and WML strategies around the burst of the ‘Tech Bubble’ (2000).
Figure 11: Hybrid momentum strategy (WML’’) and plain momentum strategy (WML) performance
38
Figure 12 plots the performance of the WML’’ and WML strategies around the Subprime crisis and the Lehman Brothers collapse (2007/08).
Figure 13 plots the performance of the WML’’ and WML strategies around the peak of the European Sovereign Debt crisis (2011).
Figure 12: Hybrid momentum strategy (WML’’) and plain momentum strategy (WML) performance
between 2007:01 and 2009:12.
Figure 13: Hybrid momentum strategy (WML’’) and plain momentum strategy (WML) performance