Arq. Bras. Med. Vet. Zootec., v.68, n.4, p.894-900, 2016
Morgan line and its relationship with distraction index, angle of inclination and degenerative joint disease in the diagnosis of canine hip dysplasia
[Linha Morgan e sua relação com índice de distração, ângulo de inclinação e doença articular degenerativa no diagnóstico da displasia coxofemoral canina]
F.G. Miranda¹, C.M.F. Rezende², E.F. Silva1, B.D. Rocha1, M.M. Melo², R.C.S. Tôrres²
¹Aluno de pós-graduação Escola de Veterinária UFMG Belo Horizonte, MG ²Escola de Veterinária UFMG Belo Horizonte, MG
ABSTRACT
We evaluated 160 hip joint radiographs of 40 dogs of different large breeds (25 females and 15 males) from the metropolitan area of Belo Horizonte, Minas Gerais, Brazil. The radiographs of each dog were obtained at two different stages: stage 1 (mean 7.23 months) and stage 2 (mean 14.25). The conventional radiographic method (CRM) and the radiographic distraction method (RDM) were used, carried out in both stages. CRM measured the Norberg angle (NA), the angle of inclination (AI) and evaluated the presence of degenerative joint disease (DJD). The MRD was performed to establish the distraction index (DI). The aims were to evaluate the presence of the Morgan line and other signs of DJD and correlate them with the degree of canine hip dysplasia (CHD) and also check if the DI greater than 0.3 (first stage) was associated with the presence of ML (second stage). It was found that DI, AI and changes of femoral neck and the formation of osteophytes were associated with the presence of ML. It was observed that if the DI is greater than 0.3 at the first stage, the chance of a positive outcome of ML in the second stage increases by 7.2 times. Thus, 49 joints showed DI > 0.3 at the first stage, in which 31 (63.3 %) presented ML at the second stage. Of the 31 animals that showed DI ≤ 0.3 at first, six (19.4%) had LM at the second stage. There has been a significant association between the presence of ML and the degree of CHD. The more severe the CHD, the higher the percentage of positive ML results. Thus, among the 24 (60 %) animals that showed ML, 11 (45.83 %) were classified as severe dysplastics, 5 (20.83%) as moderate and 8 (33.33 %) as mild. None of the animals classified as normal or borderline presented ML. Among the 8 animals classified as mild dysplastics, 5 showed only ML as DJD.
Keywords: dogs, morgan line, hip dysplasia, distraction index, degenerative joint disease
RESUMO
Avaliaram-se 160 radiografias das articulações coxofemorais de 40 cães de diferentes raças de grande porte, provenientes de Belo Horizonte, Brasil. As radiografias de cada animal foram obtidas em dois momentos: um (média de 7,23 meses de idade) e dois (média de 14,25 meses). Utilizaram-se o método radiográfico convencional (MRC) e o método radiográfico em distração (MRD), ambos realizados nos dois momentos. No MRC, mensurou-se o ângulo de Norberg (AN), o ângulo de inclinação (AI) e avaliou-se a preavaliou-sença de doença articular degenerativa (DAD). O MRD foi realizado para avaliou-se estabelecer o índice de distração (ID). Os objetivos foram avaliar a presença da linha Morgan (LM) e de outros sinais de DAD, correlacionando-os com o grau de displasia coxofemoral (DCF); além de se verificar se o ID maior que 0,3 (primeiro momento) possui associação com a presença de LM (segundo momento). Verificou-se que ID, AI e encurtamento e/ou espessamento do colo femoral e formação de osteófitos foram associados à presença da LM. Observou-se que, quando o ID era maior que 0,3 no primeiro momento, a chance de um resultado positivo da LM no segundo momento aumentava em 7,2 vezes. No primeiro momento, 49 articulações apresentaram ID > 0,3. Destas, 31 (63,3%) apresentaram LM no segundo momento. Dos 31 animais que apresentaram ID ≤ 0,3 no primeiro momento, seis (19,4%)
desenvolveram LM no segundo momento. Houve associação significativa entre presença de LM com o grau de DCF, e quanto mais grave a DCF, maior foi o percentual de resultados positivos da LM. Dos 24 (60%) animais que apresentaram LM, 11 (45,83%) foram classificados como displásicos graves, cinco (20,83%) como médios e oito (33,33%) como leves. Nenhum dos animais considerados suspeitos ou normais apresentou LM. Dos oito animais classificados como displásicos leves, cinco apresentaram apenas LM como sinal de DAD.
Palavras-chave: cães, linha Morgan, displasia coxofemoral, índice de distração, doença articular degenerativa
INTRODUCTION
The canine hip dysplasia (CHD), though extensively studied, is still considered a disease difficult to control due to its complex genetic origin. Breeding programs based on the selection of dogs with normal phenotype had limited success and prevalence of disease remains high, exceeding 70% in some breeds (Smith et al.
1995, Tôrres et al. 2005, Ginja et al. 2010). The
disease remains a concern for breeders, veterinarians and owners, and it may severely limit the physical performance of dogs (Kapatkin
et al. 2002).
The conventional radiographic method (CRM) is used as a definitive diagnosis, and it is based on evidence of joint laxity, degenerative joint disease (DJD) or both (Smith, 1997; Kapatkin et al., 2002). This method allows to obtain the
Norberg angle (NA), which quantifies the relationship between the femoral head and the acetabulum, measuring the joint laxity (McLaughlin Jr. and Tomlinson 1996). It also allows the measurement of the angle of inclination (AI), formed by the junction of the head and neck in the proximal femur, being biomechanically important to the transfer of forces from the femur to the acetabulum. (Arnoczky & Torzilli, 1981; Hauptman et al.,
1985; Vieira et al., 2010).
The early radiographic diagnosis enables the treatment of the disease, reducing the progression of DJD (Risler et al., 2009). Efforts
have been made in an attempt to find reliable methods for diagnosis in young animals. Thus, the most discreet radiographic signs have been evaluated and gained prominence in some studies (Mayhew et al., 2002, Powers et al., 2004).
The Morgan Line (ML) is a bone formation in the caudolateral region of the femoral neck
indicative of joint instability, being considered as the first radiographic sign of DJD. There was association between ML and other signs of bone remodeling (Morgan, 1987).
ML presence, while in the absence of subluxation or other signs of DJD has promoted questioning about its importance in the diagnosis of CHD (Riser, 1975; Ackerman, 1982; Morgan, 1987; Klimt et al., 1992; Adams et al., 1998;
Tôrres et al., 1999; Adams et al., 2000; Mayhew et al., 2002; Powers et al., 2004; Risler et al.,
2009; Kishimoto et al., 2010).
The radiographic method in distraction (RDM) is performed in animals which are four months old, and it is a direct measure of joint laxity via the distraction index (DI) (Smith et al., 1990; Smith et al., 1993). The DI was considered a risk factor
for the development of ML in two studies (Mayhew et al., 2002; Risler et al., 2009).
However, the use of ML methods of classification remains controversial. Some radiologists consider it as an incidental radiographic finding, making evaluation of the presence of DJD even more subjective.
MATERIAL AND METHODS
In a retrospective study, 160 radiographs (four from each animal) of the hip joints of 40 dogs of different large breeds from the metropolitan region of Belo Horizonte, Minas Gerais, Brazil were evaluated. Radiographs were obtained between the years 2001 and 2002, the sample of dogs comprised 25 males and 15 females from eight different breeds. The animals were referred specifically for radiographic examination of the hip joints.
Each animal was assessed radiographically at two different stages: one (mean of 7.23 months of age) and two (mean of 14.25 months of age). CRM and RDM were used in both stages. In CRM, there was a relationship between the femoral head and the acetabulum (congruence or incongruence) and this relationship was quantified by means of NA. AI was measured and evaluated for the presence of the following signs of DJD: ML, shortening and / or thickening of the neck, flattening of the acetabulum, the presence of osteophytes (femoral head and acetabulum), acetabular subchondral ossification and flattening of the femoral head. RDM was performed to establish the DI. All radiographic evaluations were executed by the same observer.
In order to verify the factors that influence the appearance of the ML system, Marginal Logistic Regression was used, and for selection of variables, stepwise was applied (Fitzmaurice et al., 2011).
In order to investigate whether the DI at the first moment - greater than 0.3 - has some association with the positive outcome of the ML at the second moment, the Generalized Cochran-Mantel-Haenszel was performed considering both sides and moments of measurement as strata. And the chi-square (Agresti, 2012) test was applied to verify the association in each side.
To ascertain whether the overall rating of CHD has any association with the results of the ML, the Generalized Cochran-Mantel-Haenszel, considering both sides and moments of measurement, was performed as strata. And a test was applied to verify the association in each side and moments of measurement Fisher Exact (Agresti, 2012). The level of significance in the study was 5% and the software used in the
analysis was the R version 2.15.3 (www.r-project.org).
RESULTS AND DISCUSSION
From the 40 animals studied in the second stage, 14 (35%) were considered severe dysplastic, six (15%) moderate, 13 (32.5%) mild, two (5%) borderline and five (12.5%) did not present DCF.
From the dogs studied at the second stage, 24 (60%) had ML (Fig. 1). From these, 11 (45.83%) were considered severe, five (20.83%) moderate, eight (33.33%) mild and none of them borderline or normal. From eight animals considered mild, five of them had ML as the only radiographic changes, emphasizing the importance of bone formation in the proper classification of individuals with CHD. If ML was not considered a significant radiographic change, in the absence of subluxation or other signs of DJD, the five animals would be classified as borderline or normal, i.e. as false negatives and may perpetuate the CHD.
It is known that dogs with radiographically normal hip joints may carry and transmit genes to their offspring by CHD (Ginja et al., 2010).
An adequate control of CHD involves not only radiographic examinations, but also genetic aspects. However, the use of the ML classification schemes could reduce the high prevalence of CHD.
The associated factors - in a multivariate way to the presence of ML are shown in Table. 1. The age was significant within each month that increases in the age of the dog, the chance appearance of ML increases by 1.30 (1.09, 1.54) times. Mayhew et al. (2002) also considered age
as a risk factor for the emergence of ML. With increasing age, the radiographic signs intensify DJD (Tôrres et al., 2005).
Table 1. Multivariate Logistic Regression Outsiders for the Morgan line, in 40 dogs x-rayed between the years 2001 and 2002 for evaluation of hip joints in relation to age, the distraction index (DI), angle of inclination (AI), shortening and / or thickening of the neck and formation of osteophytes
Marginal logistic regression β S.E.(β) p-value O.R. C.I - 95%
Intercept 13.490 4.893 0.006 1 -
Age 0.260 0.088 0.003 1.30 [1.09 - 1.54]
Distraction index 3.051 1.284 0.017 21.14 [1.71 -261.7] Angle of inclination -0.135 0.035 0.000 0.87 [0.82 - 0.94] Shortening and/of thickening of the neck= yes 1.672 0.650 0.010 5.32 [1.49 - 19.03]
Osteophytes = Yes 1.361 0.559 0.015 3.90 [1.30 - 11.66]
β = regression coefficient, SE (β) = standard error of β, p-value = <0.05, OR = odds ratio, CI = confidence interval Correlation Matrix of Work used: Composed Symmetry.
In this study, it was observed that each degree that the AI increases, the chance of a positive result for ML decreases by 0.87 (0.82 to 0.94) times. This result contradicts the idea that an increase in AI alters the biomechanical forces responsible for the movement of the animal with concentration of forces on the femoral head, thus enhancing joint laxity and appearance of DJD (Arnoczky and Torzilli, 1981). However, the decrease in AI can be a burden on her lap which favors the emergence of new bone formation. As a result, the ML may represent an attempt of the body to previously reinforce the area of greatest vulnerability. Further studies should be conducted to prove the validity of this association.
The literature is controversial in relation to AI. Despite an increase in this angle enhancing the appearance of signs of DJD, AI does not interfere in the development of CHD (Vieira et al., 2010).
Two signs of DJD have been associated to the appearance of ML, with ML chance of being visualized in dogs showed that shortening and/or thickening of the neck and formation of osteophytes was 5.32 (1.49, 19.03) and 3,90 (1.30, 11.66) times, respectively, higher than in dogs that did not show these changes.
There is no scientific evidence to support the specific relationship between shortening and /or thickening of the neck and ML. However, as changes occur in the femoral neck, the association between them is possible and should be investigated in further studies.
Risler et al. (2009) concluded that all animals
with ML and circumferential femoral head osteophytes in combination, at 6 months of age, developed other signs of DJD when they reached the age between one and two years, supporting the association found in this study between ML and training osteophytes.
Furthermore, ML is a bone formation. When it develops in a sufficient size, it acquires density that can be visualized radiographically (Morgan,1987; Klimt et al., 1992; Tôrres et al.,
1999). Likewise, other configurations of osteophytes also need to acquire sufficient density to be visualized. That is expected to occur at approximately the same time, thus justifying the relationship between ML and osteophytes.
chance of a positive result for ML increases by 1.35 (1.05 to 1.74) times. Mayhew et al. (2002)
found similar results, with each increase of 0.1 in DI, the risk of development of ML increased by 1.4 times. Risler et al. (2009) also found an
association between high levels of DI and appearance of ML.
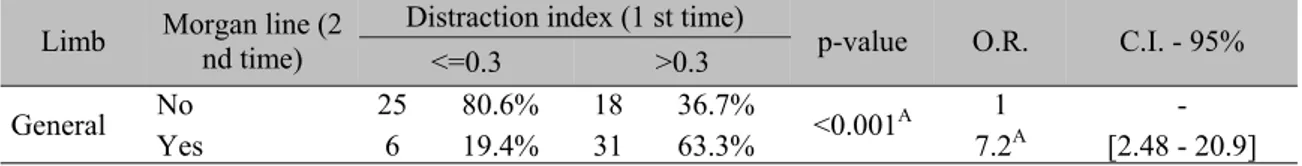
There was also a significant association between positive ML results for the second moment with DI values in the first moment. Regardless of the
limb, if the DI is greater than 0.3 in the first time, the chance of a positive outcome for ML the second time was 7.2 (2.48 to 20.9) times greater than the chance of the dogs that had DI ≤ to 0.3 (Table 2).
Smith et al. (1993) established the value of 0.3 as
the threshold that separates biological dysplastic from normal animals. Tôrres et al. (2005),
considered the DI of 0.35 as a cutoff point. In this study, the value of 0.3 was used as reference.
Table 2. Contingency Table for Morgan Line (ML) in the 2nd time with the distraction index (DI); 1st moment, in 40 dogs x-rayed between the years 2001 and 2002
Limb Morgan line (2 nd time) Distraction index (1 st time) <=0.3 >0.3 p-value O.R. C.I. - 95%
General No 25 80.6% 18 36.7% <0.001A 1 -
Yes 6 19.4% 31 63.3% 7.2A [2.48 - 20.9]
The p-value calculated by the Cochran-Mantel-Haenszel test. Significant when p-value <0.05. OR = odds ratio, CI = confidence interval.
The association between DI and ML is clear and supports the theory that ML originates secondarily from joint instability. However, some factors must be considered. In this study, six (19.4%) of the joints that were classified with DI ≤ 0.3 at first had ML in the second evaluation. It is clear that these animals showed no risk of developing signs of bone remodeling, even though they developed ML. In contrast, 18 (36.7%) of the joints that showed DI > 0.3 at first, did not develop ML, exactly when the likelihood of developing this new bone formation was high.
The RDM, as any diagnostic method, is not fully reliable and can give a false negative result (Adams, 2000). That would explain why some animals with DI≤ 0.3 LM developed it.
The explanation for the fact that animals with joint laxity have not developed ML consists of possible errors in positioning, such as a femoral external rotation which may obscure the visualization of ML. Another possibility is that, as the radiographic examinations were performed using conventional equipment, the technical quality achieved may not have been sufficient for visualization of bone formation. Moreover, the radiographic density of ML is variable and may often occur discretely.
These observations make the clinical importance of ML questionable. If animals with ML are not considered dysplastic, the perpetuation of phenotypes misclassified as normal may occur, thus increasing the frequency of CHD. According to Mayhew et al. (2002), and Powers et al. (2004), since the frequency of CHD
remains high, it would be wise to consider ML as a radiographic sign of illness until further studies are conducted. In addition, dogs with ML may be accompanied by x-ray for diagnosis.
It was also observed that regardless of when and which limb, there was a significant association between positive results for ML with the value of the overall rating, and the higher the degree of CHD, the higher the percentage of positive results for ML. Smith et al. (1993) and Tôrres et al (2005) found that the lower the NA (greater
severity), the greater the likelihood of developing DJD.
This result seems to contradict the idea that, in animals with severe subluxation, the visualization of ML can be difficult due to the large bone remodeling (Kishimoto et al., 2010).
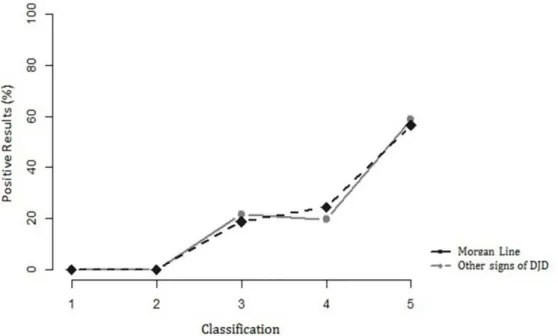
Likewise, there was a significant association between ML and other signs of DJD (flattening of the femoral head, shortening and/or thickening of the neck, subchondral ossification of the acetabulum, osteophytes and flattening of the acetabulum) with the value of the general
classification (Fig.2), demonstrating that ML behaves in the same way as other signs of DJD. Thus, the greater the degree of CHD is, the greater the percentage of ML and other radiographic signs of DJD are.
Classification: 1 = Normal, 2 = Suspect; 3 = Lightweight, 4 = Medium; 5 = Severe (Significant values according to the generalized Cochran-Mantel-Haenszel, p-value: <0.001). Other radiographic signs of DJD (degenerative joint disease) include: flattening of the femoral head, shortening and/or thickening of the neck, flattening of the acetabulum, osteophytes and subchondral ossification.
Figure 2. Line graph with the percentage of positive joints to Morgan line (ML) and other radiographic signs of degenerative joint disease (DJD), according to the degree of hip dysplasia (HD) in 40 dogs x-rayed between the years 2001 and 2002.
CONCLUSIONS
In the conditions in which the experiment was conducted, it is concluded that the ML was associated with the presence of other DJD signals, so that its frequency increased with the severity of the condition, as likewise observed for other osteoarthritic changes. Also, ML was associated with the DI and AI increases. Thus ML is a sign of DJD, so only its presence makes the dog be regarded as the bearer of mild CHD, at least. However, not all dysplastic animals will show ML as a radiographic sign of CHD.
REFERENCES
ACKERMAN, N. Hip dysplasia in the Afghan hound. Vet. Radiol.,v.23, p.88-97, 1982.
ADAMS, W.M.; DUELAND, R.T.; DANIELS, R. et al. Comparison of two palpation, four
radiographic and three ultrasound methods for early detection of mild to moderate canine hip dysplasia. Vet. Radiol. Ultrasound, v.41,
p.484-490, 2000.
ADAMS, W.M.; DUELAND, R.T.; MEINEN, J.
et al. Early detection of canine hip dysplasia:
comparison of two palpation and five radiographic methods. J.Am. Anim. Hosp. Assoc.,
v.34, p.339-347, 1998.
AGRESTI, A. Categorical data analysis. 2.ed.
ARNOCZKY, S.P.; TORZILLI, P.A. Biomechanical analysis of forces acting about the canine hip. Am. J. Vet. Res., v.42,
p.1581-1585, 1981
FITZMAURICE, G.M.; LAIRD, N.M.; WARE, J.H. Applied longitudinal analysis. 2.ed. New
Jersey: John Wiley e Sons, 2011. p.474-486. GINJA, M.M.D.; SILVESTRE, A.M.; GONZALO-ORDEN, J.M.; FERREIRA, A.J.A. Diagnosis, genetic control and preventive management of canine hip dysplasia: a review.
Vet. J., v.184, p.269-276, 2010.
HAUPTMAN, J.; CARDINET, G.H.; MORGAN, J.P. et al. Angles of inclination and
anteversion in hip dysplasia in the dog. Am. J. Vet. Res., v.46, p.2033-2036, 1985.
KAPATKIN, A.S.; FORDYCE, H.H.; MAYHEW, P.D.; SMITH, G.K. Canine hip dysplasia: the disease and its diagnosis.
Compend. Cont. Educ. Pract. Vet., v.24,
p.526-537, 2002.
KISHIMOTO, M.; PAE, SA-HUN.; MUROYA, N. et al. The relationship between the size of
caudolateral curvilinear osteophyte of the canine femoral neck and the radiographic view. J. Vet. Sci., v.11, p.89-91, 2010.
KLIMT, U.; TELLHELM, B.; FRITSCH, R. Die bedeutung der “Morgan line” fur die untersuchung auf HD beim hund.
Kleinteirpraxis, v.37, p.211-214, 1992.
MAYHEW, P.D.; MCKELVIE, P.J.; BIERY, D.N. et al. Evaluation of a radiographic
caudolateral curvilinear osteophyte on the femoral neck and its relationship to degenerative joint disease and distraction index in dogs. J. Am. Vet. Med. Assoc., v.220, p.472-476, 2002.
McLAUGHLIN Jr., R.; TOMLINSON, J. Radiographic diagnosis of canine hip dysplasia.
Vet. Med., v.91, p.36-47, 1996.
MORGAN, J.P. Canine hip dysplasia: significance of early bony spurring. Vet. Radiol.,
v.28, p.2-5, 1987.
POWERS, M.Y.; BIERY, D.N.; LAWLER, D.F.
et al. Use of the caudolateral curvilinear
osteophyte as an early marker for future development of osteoarthritis associated with hip dysplasia in dogs. J. Am. Vet. Med. Assoc.,
v.225, p.233-237, 2004.
RISER, W.H. The dysplastic hip joint: radiologic and histologic development. Vet. Pathol., v.12,
p.279-305, 1975.
RISLER, A.; KLAUER, J.M.; KEULER, N.S.; ADAMS, W.M. Puppy line, metaphyseal sclerosis, and caudolateral curvilinear and circumferential femoral head osteophytes in early detection of canine hip dysplasia. Vet. Radiol. Ultrasound, v.50, p.157-166, 2009.
SMITH, G. K. Advances in diagnosing canine hip dysplasia. J. Am. Vet. Med. Assoc., v.210,
p.1451-1457, 1997.
SMITH, G. K.; POPOVITCH, C.A.; GREGOR, T. P.; SHOFER, F. S. Evaluation of risk factors for degenerative joint disease associated with hip dysplasia in dogs. J. Am. Vet. Med. Assoc.,
v.206, p.642- 647, 1995.
SMITH, G.K.; BIERY, D.N.; GREGOR, T.P. New concepts of coxofemoral joint stability and the development of a clinical stress-radiographic method for quantitating hip joint laxity in the dog. J. Am. Vet. Med. Assoc., v.196, p.59-70,
1990.
SMITH, G.K.; GREGOR, T.P.; RHODES, W.H.; BIERY, D.N. Coxofemoral joint laxity from distraction radiography and its contemporaneous and prospective correlation with laxity, subjective score, and evidence of degenerative joint disease from conventional hip-extended radiography in dogs. Am. J. Vet. Res., v.54,
p.1021-1042, 1993.
TÔRRES, R.C.S.; ARAÚJO, R.B.; REZENDE, C.M.F. Distrator articular no diagnóstico radiográfico precoce da displasia coxofemoral em cães. Arq. Bras. Med. Vet. Zootec., v.57,
p.27-34, 2005.
TÔRRES, R.C.S.; FERREIRA, P.M.; ARAÚJO, R.B.; MARTINS, A.S. Presença de “Linha morgan” como indicador de displasia coxofemoral em cães da raça Pastor alemão. Arq. Bras. Med. Vet. Zootec., v.51, p.157-158, 1999.
VIEIRA, G.L.T.; TÔRRES, R.C.S.; BARROS, G.S.; REZENDE, C.M.F. Associação entre o ângulo de Norberg, o percentual de cobertura da cabeça femoral, o índice cortical e ângulo de inclinação em cães com displasia coxofemoral.
Arq. Bras. Med. Vet. Zootec., v.62, p.1094-1101,