AbstrAct:Introduction: This article presents the results of a research whose objective was to verify the prevalence of the perception reports regarding quality of life of library attendees in the public libraries in the Brazilian capital Federal District (FD) and the surrounding region and to analyse the factors related to dissatisfaction. Methods: An epidemiological transversal study was conducted in 592 individuals aged above 12 years old through the application of the WHOQOL-BREF/WHO questionnaire. Results: Higher frequencies of dissatisfaction were observed among women with ages above 25, with lower personal income and lower educational level. Dissatisfaction regarding the physical domain was more prevalent in the surrounding region than in the FD. Under the psychological domain, dissatisfaction predominated in people in the FD. Negative feelings, concentration diiculties and dissatisfaction regarding personal safety were referred by more than 25% of participants in both regions. Regarding the environment domain, lack of money and of leisure opportunities were the main complaints. In spite of these indings, interviewees referred being very satisied with their health and quality of life. Conclusions: The results can be a sign that the quality of life in the study region is in alert level. A careful look at these data is needed to identify alternatives to change this situation, with efective actions for Health Promotion and development strategies for the study area. A planning and an intervention in the area of health education in public libraries is recommended, since these are very important social loci, that can be engaged in health promotion and disease prevention actions in the communities.
Keywords: Quality of life. Health promotion. Library services. Power. City planning. Health education.
Application of the WHOQOL-BREF in a
community segment as a subsidy
for health promotion actions
Aplicação do WHOQOL-BREF em segmento
da comunidade como subsídio para ações de promoção da saúde
Jacqueline Ramos de Andrade Antunes GomesI, Edgar Merchan HamannI,
Maria Margarita Urdaneta GutierrezI
ISchool of Health Sciences, Universidade de Brasília – Brasília (DF), Brasil.
Corresponding author: Jacqueline Ramos de Andrade Antunes Gomes. Caixa Postal 58, Altiplano Leste/Lago Sul, CEP: 71617-991, Brasília, DF, Brasil. E-mail: [email protected]
IntroductIon
Quality of life (QoL) is a complex concept that has received increasing attention from the scientific literature, receiving many meanings and approaches that permeate various knowledge fields, such as sociology, education, medicine, nursing, psychology, among others.
As Minayo et al.1 said, the minimum and universal level, speaking about QoL, is linked to
the satisfaction of the most basic needs of human life: “food, access to clean water, housing, work, education, health and leisure; essential elements that are referenced as relative notions of comfort well-being and individual and collective fulillment”.
The concern with QoL strengthens with the increment of the frequency of chronic diseases and the technological advances that increase patient survival without necessarily lead them to healing. More recently, can be seen the importance of the perception of population segments’s QoL, such as the elderly, adolescents, alcoholics and people with spinal cord injury to discover what are the felt needs, with the goal of guiding interventions, especially in the context of health promotion2-6.
According to Campos Rodrigues and Neto7, the measurement of QoL has been held
in care practices, public policy, prevention and health promotion. Thus, QoL and health promotion are directly related.
resumO:Introdução: Este artigo apresenta os resultados de uma pesquisa cujo objetivo foi veriicar a prevalência de relatos de percepções quanto à qualidade de vida dos usuários das bibliotecas públicas do Distrito Federal e Entorno e analisar os fatores associados à insatisfação. Métodos: Foi realizado estudo epidemiológico transversal em 592 indivíduos acima de 12 anos, por meio da aplicação do questionário WHOQOL-BREF/OMS. Resultados: Foi veriicado que as mulheres com idade acima de 25 anos, com menor renda pessoal mensal e menor escolaridade apresentaram insatisfações com maior frequência. Além disso, foi veriicada maior insatisfação quanto ao aspecto físico na região do Entorno do Distrito Federal. Sob o aspecto psicológico, predominaram insatisfações em pessoas do DF. Sentimentos negativos, diiculdades para se concentrar e insatisfações relativas à segurança foram referidos por mais de 25% dos participantes nas duas regiões. Com relação ao meio ambiente, destacaram-se insatisfações relativas à falta de dinheiro e de oportunidades de lazer. Apesar desses dados, as pessoas relataram muita satisfação com a própria saúde e com a qualidade de vida. Conclusões: Os resultados podem ser um sinal de que a qualidade de vida no DF e Entorno está em grau de alerta, ou seja, é preciso um olhar atento a esses dados para buscar alternativas que revertam esse quadro, com ações efetivas de promoção da saúde e estratégias de desenvolvimento dessas regiões. Foram sugeridos um planejamento e uma intervenção na área de educação em saúde nas bibliotecas públicas, por serem nichos sociais importantíssimos, que devem ser preenchidos e ocupados com ações que auxiliem na promoção da saúde e prevenção de doenças nas comunidades.
Buss8 states that, globally, stand out the Canadian, North American and European
studies, which are equanimous in demonstrating the relationship between health and quality/living conditions. The author reports that this debate is also traditional in Brazil and Latin America, having been established that “the bad distribution of income, illiteracy and low educational level, as well as poor housing conditions and environment play a signiicant role in conditions of life and health”8.
Diferent instruments for measuring QoL were analyzed by Carr et al.9, among which
the Quality of Well-being Scale, the European Quality of Life (EUROQoL), the Sickness Impact Proile, the Nottingham Health Proile, the Rosser Index, the McMaster Health Index, the Functional Limitations Proile, the Medical Outcomes Study 36 – Item Short Form Health Survey (SF-36) and the Schedule for the Evaluation of Individualized Quality of Life (SEIQoL). The authors also made reference to an instrument that was being developed by the World Health Organization (WHO), which was later called World Health Organization Quality of Life – 100 (WHOQOL-100), and its abbreviated version, WHOQOL-BREF10.
Regarding the advantages and disadvantages of the analyzed instruments, Carr et al.9
observed that most instruments incorporated aspects of all levels of impact related to pathological conditions, a factor that made it diicult to see what these instruments were actually measuring. In the same article, the authors reiterated the view that QoL should be deined individually and not from health professionals, because the authors veriied that these professionals were not successful when trying to identify aspects of the diseases and treatments that were important in the patients’ point of view. The biggest criticism detailed that the instruments for measuring QoL generally would cover areas that are not commonly discussed in medical interventions, such as personal relationships and social activities. Thus, these instruments omit aspects of QoL of great importance at the individual level9.
The most important observation in the Carr et al.9 article is the one about all
instruments for measuring QoL addressing only the negative aspects of health, except for the “new” instrument of WHO (WHOQOL), whereas is consensus that QoL is an analysis or a balance between positive and negative aspects. Thus, these instruments were not measuring the QoL itself, but the patients’ health through the lens of a negative impact on their QoL.
Coons et al.11 also refer to these instruments for measuring QoL as generic or speciic.
According to Coons et al.11, there are no “better or worse” instruments for measuring
QoL, and the decision to use one or the other, or a combination of any two or more, shall be taken in accordance with the purpose of the research to be developed. The choice will depend on a number of factors, including population characteristics and the context in which individuals are inserted, and elements under various circumstances. Moreover, the selection of these instruments should be based on decisions that consider which are the most relevant characteristics of individuals in the face of measurement needs.
Among the ive central areas of action proposed in the Ottawa Charter for Health Promotion12, three draw attention to the fact that they allow actions for health promotion
in new environments and contexts, creating supportive environments, strengthening community action and the development of skills and attitudes. Regarding the creation of supportive environments, it identiies “the conquest of environments that facilitates and promotes health as work, leisure, home, school and the cities themselves”, which we would add public libraries, that are existing community spaces in almost all Brazilian cities.
Regarding the strengthening of community action or community empowerment, we believe that the possibilities to access of information and learning opportunities for people’s health also ind fertile ground in libraries. I would add that those in most municipalities already have the physical space as well as the potential to conigure in community spaces of great use in the constant quest for information and knowledge in all areas, including health. Thus, there are many areas where health promotion activities can be developed, and it is possible to expand the physical universe available for the implementation of health education strategies in this universe to include public libraries.
There are several areas of health promotion, and second Gomes13, there is a consensus
on the fact that the same extrapolate the “health sector” and it should be practiced in the community from other channels and other institutions such as schools, community associations, religious organizations, health clinics, libraries, among others. Among these places, as mentioned by Antunes et al.14, the library “is the most common cultural
institution, in other words, that is present in most counties. The library serves as a place for the community to meet, talk, exchange information, discuss problems, satisfy their information needs, expand knowledge, read freely, create and recreate. The public library is public and should be freely attended by everyone”. Therefore, the library can be a privileged and potential locus not only to diagnose the proile of users who attend, but especially to check the health knowledge and perception of QoL, and could constitute a community core for learning, intervening and promoting health13.
Analyzing the above considerations, it appears that the WHO‘s instrument for measuring QoL, WHOQOL, would be consonant with the population characteristics among users of public libraries, because these are individuals who apparently are not carriers of diseases, in other words, represent a portion of the general population.
This article presents some results from a larger study13, in which was identiied perceptions
of study participants about self-care with the body and physical and mental health from the perspective of health promotion in public libraries of the Federal District, Brazil’s capital, and the Surrounding municipalities that compose a region characterized by signiicant social inequalities and violence. The purpose of this article was to present the prevalence of reported perceptions of users of these libraries for the QoL and analyze the factors associated with dissatisfaction.
MEtHodoLoGY
Study type and participantS Selection
An epidemiological cross-sectional study in a sample of individuals using the public libraries of the administrative regions of the Federal District (DF) and the Surrounding municipalities that compose the Região Integrada de Desenvolvimento do Distrito Federal e Entorno (RIDE-DF) was held. The DF, with 2.8 million inhabitants, includes Brasilia and 19 administrative regions, and RIDE-DF, with 900,000 inhabitants, is composed of 22 municipalities, 19 from Goias and three from Minas Gerais, besides the DF15.
The RIDE-DF has 46 public libraries. A library was selected for each administrative region or municipality of RIDE-DF. Four libraries were under renovation at the time of the collection period and were excluded from the study. Altogether, the study covered 85% of the existing libraries (39 libraries).
In the DF, two public libraries were selected in Brasilia and in each administrative region. Frequenters and users individuals of public libraries over the age of 12 and living in selected communities were included in the study once agreed to participate after the objectives and procedures (interview) were explained and they signed the Statement of Informed and Free Consent, which characterized a convenient sample.
The sample size was calculated for other purposes, through analytical study to detect diferences of 10% in the presence of a variable whose frequency in the least exposed group is 15% and in the treatment group is 25%16. The probability of Error Type I (α)
<0.05, and the probability of Error Type II (β) <0.20 [power (1-β)> 0.80] were deined. Under these conditions, the estimated size was 250 individuals in two exposure groups, totaling 500 individuals, adding 100 individuals, or 20%, for replacement of possible losses16. For the purpose of operationalization, a minimum quota of 15 individuals per
inStrument and data collection procedure
We obtained information about the QoL of users through the application of the evaluation instrument WHOQOL-BREF10. This tool gathers information in four areas
or domains:
• physical domain – pain, discomfort, energy, fatigue, sleep, rest, activities of daily life, dependence on medication or treatments, mobility, ability to work;
• psychological domain – positive feelings, thought, learning, memory, concentration, self-esteem, body image, appearance, negative feelings, spirituality, religion, personal beliefs;
• social relations – personal relations, support/social support, sexual activity;
• environmental domain – physical security, protection, home environment, inancial resources, care with health and social/availability and quality, opportunities for acquiring new information and skills, participation in recreation and leisure opportunities, physical environment (regarding pollution, noise, traic, weather) and transportation.
Altogether, the WHOQOL-BREF10 includes 26 questions. The answers to these questions
generate scores ranging from 1 to 5 according to the degree of satisfaction, ranging from “not at all satisied” to “very satisied”. The instrument for data collection also included the following variables: socioeconomic and demographic (gender, age, personal income, family income, education, adequacy of schooling to the age group considering individuals of 20 years old having completed high school, place of residence, social participation). On initial contact with the libraries, was asked a reserved space for the conduct of the interviews to respect the privacy of each volunteer.
The collection period was from March to June 2008, in the daytime and in the nighttime periods. Those responsible for implementing the instruments were health professionals trained for this purpose. The questionnaires were examined for completeness and consistency of the data collected.
data analySiS
To analyze the Quality of Life through the WHOQOL-BREF, a Gross Score (EB) was initially calculated by summing the scores for each question and then generating a 4-20 Transformed Score (ET 4-20), whose values range from 4 to 20. Further, we calculated the 0-100 Transformed Score (ET 0-100), where the values range from 0 to 100. To analyze the data of the four QoL domains studied, we used an adapted scale17. This scale is
as the cutof value below 70 and equal to or greater than 70, where levels below 70 are considered as dissatisfaction with QoL and levels above that as satisfaction. There was also calculated the absolute and relative frequencies for each variable. Epi-Info 6.0 and the Statistical Package for the Social Sciences (SPSS) 10.0 were used for creating the database and their analysis.
The prevalence of dissatisfaction with QoL among the various categories dichotomized of the related variables were calculated, being possible to calculate prevalence ratios and conidence intervals. Subsequently, they were tested by the Mantel-Haenszel χ2, being
considered the signiicance level p < 0.05. Once obtained these results, the variables were entered into a multivariate Poisson Regression Model with Robust Variance to analyze the association between independent variables, and poor QoL.
Logistic regression has been widely used to perform the multivariate analysis of cross-sectional studies, however, in the analysis of common outcomes, ends up strongly underestimating the prevalence ratios. Thus, as an alternative, we sought the Poisson Regression Model with Robust Variance to analyze the factors associated with dissatisfaction18.
ethical conSiderationS
The project was approved by the Ethics in Research Committee of the Faculdade de Ciências da Saúde of the Universidade de Brasilia, under the number 133/2007, on March 11, 2008. Participation in the study was voluntary, and individuals agreed to participate by signing the Statement of Informed and Free Consent, and when they were under eighteen, upon parental consent. It is noteworthy that this study did not receive funding for its implementation.
rEsuLts
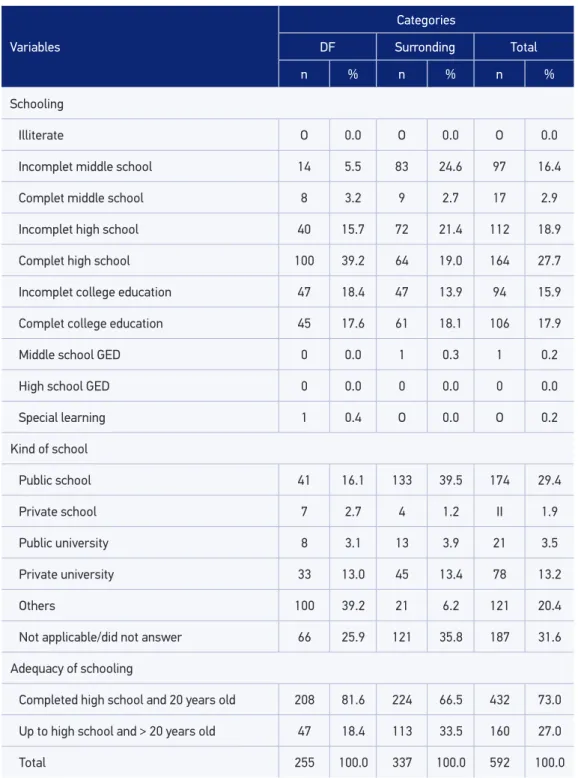
Were interviewed 592 individuals, both men and women. The proportion of women was higher in the Surrounding region (71.2%), and in DF, men predominated (56.5%). The age in Federal District varied between 18 and 64 years. In the Surroundings, ages ranged between 12 and 68 years old. The proportion of individuals older than 24 years was higher in both the DF and the Surrounding region (~60%). Only 25 participants were under 18 years (Table 1).
Table 1. Distribution of socio-economic and demographic variables among users of public libraries in the Federal District and Surrounding Region, 2008.
Variables
Categories
DF Surronding Total
n % n % n %
Sex
Male 144 56.5 97 28.8 241 40.7
Female 111 43.5 240 71.2 351 59.3
Age group (years old)
≤ 24 105 41.2 133 39.5 238 40.2
> 25 150 58.8 204 60.5 354 59.8
Employment situation
Employed (steady) 94 37.0 189 56.1 283 47.8
Unemployed 46 18.0 17 5.0 63 10.6
Self-employment lO 3.9 22 6.5 32 5.4
Informal employment 12 4.7 8 2.4 20 3.4
Bolsa Familia# 7 2.7 8 2.4 15 2.5
Unemployment insurance/other/housewife 9 3.5 17 5.0 26 4.4
Student 70 27.5 72 21.4 142 24.0
Retired 7 2.7 4 1.2 11 1.9
Personal income&
Up to 1.5 MW 46 18.0 137 40.6 183 30.9
Above 1.5 MW 82 32.2 99 29.4 181 30.6
Not applicable/did not answer 127 49.8 lO1 30.0 228 38.5
Monthly family income&
Up to 3.5 minimum wages 72 28.3 175 51.9 247 41.7
Above 3.5 minimum wages 135 52.9 96 28.5 231 39.0
Not applicable/did not answer 48 18.8 66 9.6 114 19.3
Still studding
Yes 190 74.5 216 64.1 406 68.6
No 65 25.5 121 35.9 186 31.4
Variables
Categories
DF Surronding Total
n % n % n %
Schooling
Illiterate O 0.0 O 0.0 O 0.0
Incomplet middle school 14 5.5 83 24.6 97 16.4
Complet middle school 8 3.2 9 2.7 17 2.9
Incomplet high school 40 15.7 72 21.4 112 18.9
Complet high school 100 39.2 64 19.0 164 27.7
Incomplet college education 47 18.4 47 13.9 94 15.9
Complet college education 45 17.6 61 18.1 106 17.9
Middle school GED 0 0.0 1 0.3 1 0.2
High school GED 0 0.0 0 0.0 0 0.0
Special learning 1 0.4 O 0.0 O 0.2
Kind of school
Public school 41 16.1 133 39.5 174 29.4
Private school 7 2.7 4 1.2 II 1.9
Public university 8 3.1 13 3.9 21 3.5
Private university 33 13.0 45 13.4 78 13.2
Others 100 39.2 21 6.2 121 20.4
Not applicable/did not answer 66 25.9 121 35.8 187 31.6
Adequacy of schooling
Completed high school and 20 years old 208 81.6 224 66.5 432 73.0
Up to high school and > 20 years old 47 18.4 113 33.5 160 27.0
Total 255 100.0 337 100.0 592 100.0
&Minumum Wage (MW) amount in Brazil at the time of data collection: R$ 415.00; in Dollars: US$ 355.00. In 2008: US$ 1.00 = R$ 1.168.
#Bolsa Família: Government Assistance Program. DF: Federal District; GED: xxxxx.
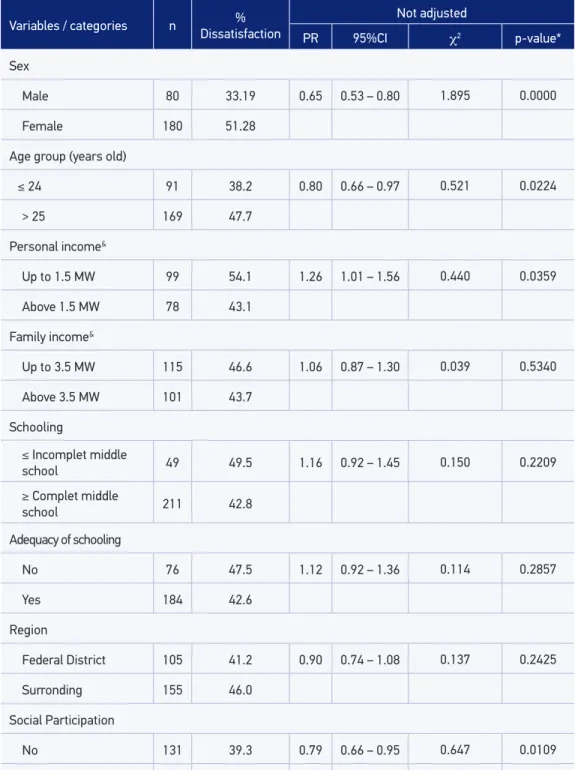
Table 2. Association between predictive variables and dissatisfaction with the quality of life in the physical aspect among users of public libraries in the Federal District and Surrounding region, 2008.
Variables / categories n Dissatisfaction% Not adjusted
PR 95%CI χ2 p-value*
Sex
Male 80 33.19 0.65 0.53 – 0.80 1.895 0.0000
Female 180 51.28
Age group (years old)
≤ 24 91 38.2 0.80 0.66 – 0.97 0.521 0.0224
> 25 169 47.7
Personal income&
Up to 1.5 MW 99 54.1 1.26 1.01 – 1.56 0.440 0.0359
Above 1.5 MW 78 43.1
Family income&
Up to 3.5 MW 115 46.6 1.06 0.87 – 1.30 0.039 0.5340
Above 3.5 MW 101 43.7
Schooling
≤ Incomplet middle
school 49 49.5 1.16 0.92 – 1.45 0.150 0.2209
≥ Complet middle
school 211 42.8
Adequacy of schooling
No 76 47.5 1.12 0.92 – 1.36 0.114 0.2857
Yes 184 42.6
Region
Federal District 105 41.2 0.90 0.74 – 1.08 0.137 0.2425
Surronding 155 46.0
Social Participation
No 131 39.3 0.79 0.66 – 0.95 0.647 0.0109
Yes 129 49.8
Variables / categories n Dissatisfaction% Adjusted
#
PR 95%CI χ2 p-value*
Sex
Male 80 33.19 0.96 0.86 – 1.08 0.029 0.5873
Female 180 51.28
Age group (years old)
≤ 24 91 38.2 1.02 0.90 – 1.15 0.010 0.7556
> 25 169 47.7
Personal income&
Up to 1.5 MW 99 54.1 1.09 0.95 – 1.26 0.181 0.1780
Above 1.5 MW 78 43.1
Family income&
Up to 3.5 MW 115 46.6 0.95 0.82 – 1.10 0.041 0.5241
Above 3.5 MW 101 43.7
Schooling
≤ Incomplet middle
school 49 49.5 1.06 0.88 – 1.27 0.039 0.5340
≥ Complet middle
school 211 42.8
Adequacy of schooling
No 76 47.5 1.01 0.87 – 1.17 0.004 0.8438
Yes 184 42.6
Region
Federal District 105 41.2 1.20 1.07 – 1.36 0.965 0.0019
Surronding 155 46.0
Social Participation
No 131 39.3 0.97 0.86 – 1.09 0.019 0.6627
Yes 129 49.8
Domain 1 - Physics - Dissatisfaction rate is equal to transformed score 0-100 below 70; Satisfaction rate is equal to transformed score 0-100 equal or greater than 70.
*Mantel-Hänszel/Exact Fisher test when recommended. #Poisson Regression model with robust variance.
&Minumum Wage (MW) amount in Brazil at the time of data collection: R$ 415.00; in Dollars: US$ 355.00. In 2008: US$ 1.00 = R$ 1.168.
dissatisfaction in QoL in physical aspect. In the multivariate model, is associated with the outcome variable region only, that is, individuals who live in the Surrounding areas showed higher dissatisfaction in physical aspect in relation to DF residents.
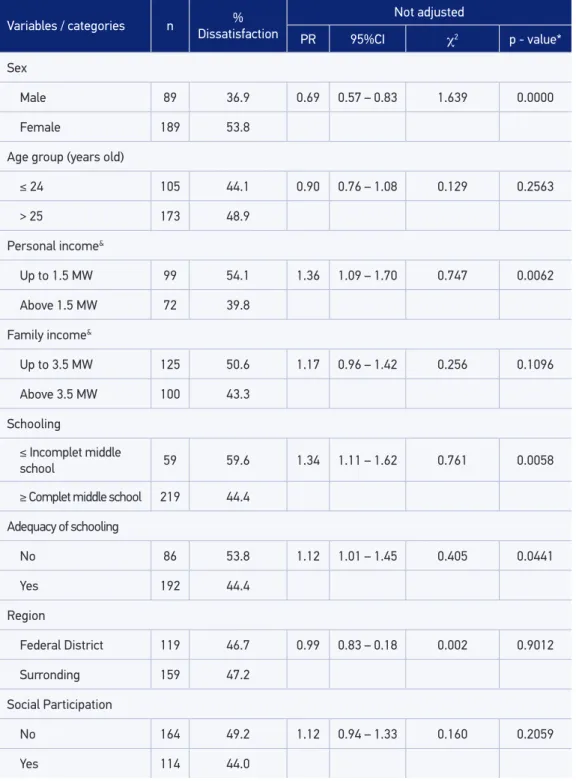
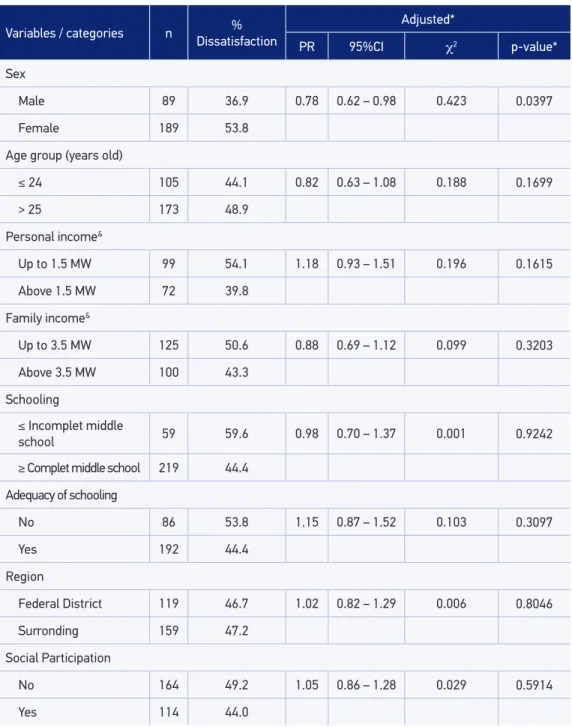
In the aspect of the psychological domain of the WHOQOL-BREF (Table 3), about 48% of the interviewees declared that they quite enjoy life, that life has a lot of sense and is able to concentrate enough. With regard to the frequency of negative feelings, 61.5% of users of public libraries in the DF and Surrounding stated they feel bad mood, despair, anxiety and depression sometimes. Among the signiicant variables in the multivariate analysis for p > 0.05, dissatisfactions associated with QoL in the psychological aspect, met only the gender variable, in other words, female subjects showed higher dissatisfaction in the psychological aspect in relation to males.
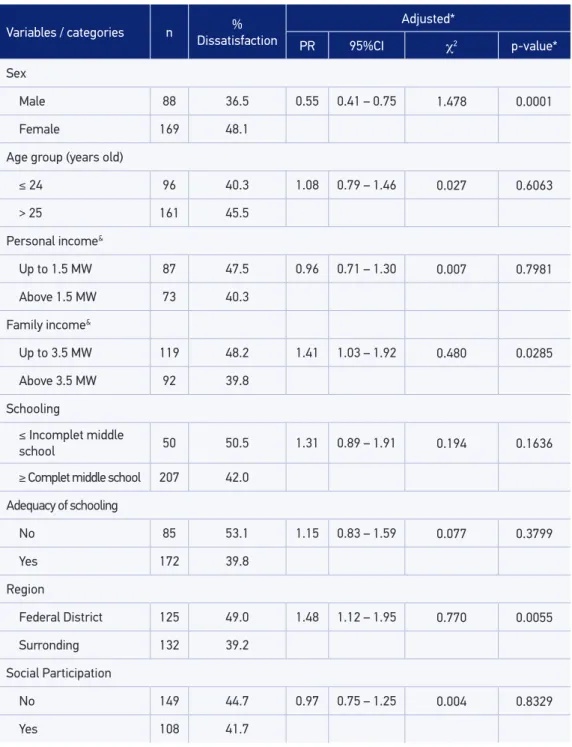
Regarding Social Relations - Domain 3 of the WHOQOL-BREF (Table 4), about 48% of the interviewees said that they were satisied with their personal relations. In multivariate analysis for p > 0.05, signiicant variables associated with dissatisfaction in QoL in the aspect of social relations variables were gender, family income, and region. That is, female subjects with lower income families and living in the surrounding areas showed higher dissatisfaction concerning social relations.
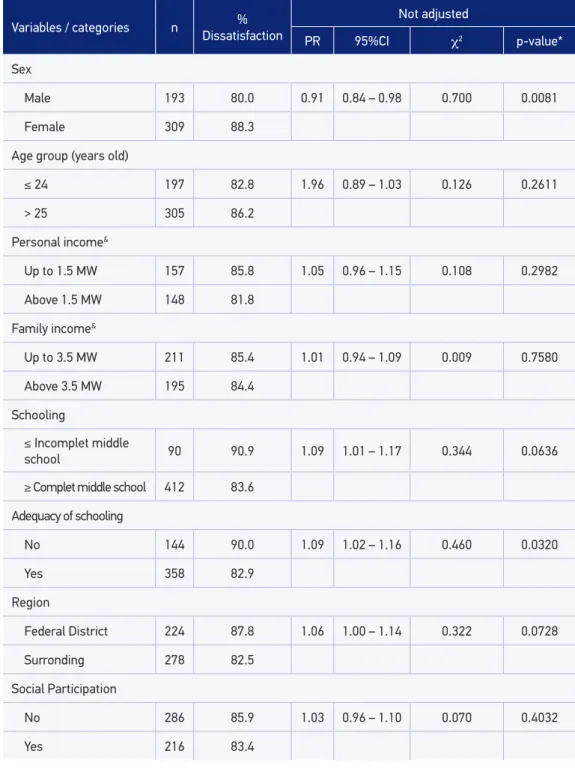
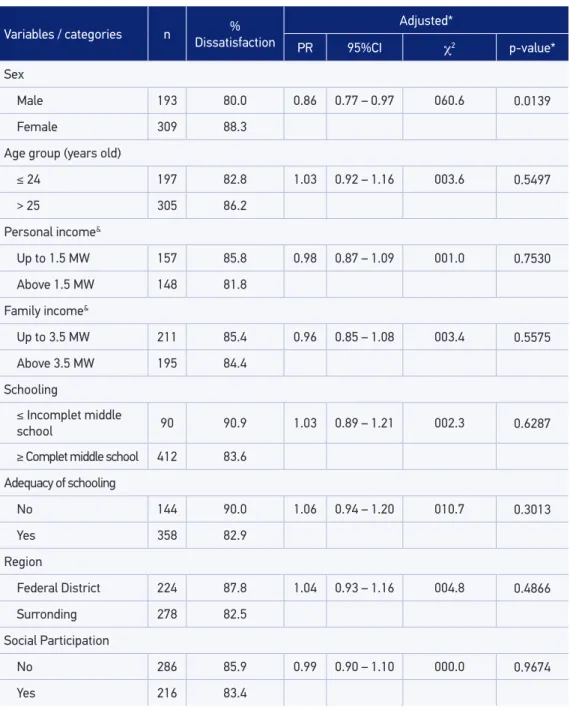
Regarding the Environment - Domain 4 of the WHOQOL-BREF (Table 5), the majority of responses were at the level of somewhere in between dissatisfaction and satisfaction, and the proportions were evaluated for size and between the DF and the surrounding areas. In multivariate analysis for p > 0.05, the signiicant variable associated with dissatisfaction in QoL in the aspect of the environment was the gender variable, so that female subjects showed higher dissatisfaction as to the environment.
dIscussIon
The QoL goes through complex processes of mediation and determination which make several variables being probably associated with their perception. According to WHO10, QoL
has two important aspects, which are subjectivity and multidimensionality, where on the irst sphere is considered the individual’s perception of how you evaluate your personal situation in several dimensions. In addition, QoL can be assessed only by that person, and not through the vision of scientists and healthcare professionals. When it comes to multidimensionality, QoL has an intrinsic relationship with the many facets of human life, contextualized in each environment, situation, value system, culture, expectations, standards and concerns where individuals are inserted.
Frequenters and users individuals of libraries belong to the general population. Therefore, according to a quote from Minayo et al.1 as the application area, it would be appropriate
Table 3. Association between predictive variables and dissatisfaction with the quality of life in the psychological aspect among users of public libraries in the Federal District and Surrounding region, 2008.
Variables / categories n Dissatisfaction%
Not adjusted
PR 95%CI χ2 p - value*
Sex
Male 89 36.9 0.69 0.57 – 0.83 1.639 0.0000
Female 189 53.8
Age group (years old)
≤ 24 105 44.1 0.90 0.76 – 1.08 0.129 0.2563
> 25 173 48.9
Personal income&
Up to 1.5 MW 99 54.1 1.36 1.09 – 1.70 0.747 0.0062
Above 1.5 MW 72 39.8
Family income&
Up to 3.5 MW 125 50.6 1.17 0.96 – 1.42 0.256 0.1096
Above 3.5 MW 100 43.3
Schooling
≤ Incomplet middle
school 59 59.6 1.34 1.11 – 1.62 0.761 0.0058
≥ Complet middle school 219 44.4
Adequacy of schooling
No 86 53.8 1.12 1.01 – 1.45 0.405 0.0441
Yes 192 44.4
Region
Federal District 119 46.7 0.99 0.83 – 0.18 0.002 0.9012
Surronding 159 47.2
Social Participation
No 164 49.2 1.12 0.94 – 1.33 0.160 0.2059
Yes 114 44.0
Variables / categories n Dissatisfaction%
Adjusted*
PR 95%CI χ2 p-value*
Sex
Male 89 36.9 0.78 0.62 – 0.98 0.423 0.0397
Female 189 53.8
Age group (years old)
≤ 24 105 44.1 0.82 0.63 – 1.08 0.188 0.1699
> 25 173 48.9
Personal income&
Up to 1.5 MW 99 54.1 1.18 0.93 – 1.51 0.196 0.1615
Above 1.5 MW 72 39.8
Family income&
Up to 3.5 MW 125 50.6 0.88 0.69 – 1.12 0.099 0.3203
Above 3.5 MW 100 43.3
Schooling
≤ Incomplet middle
school 59 59.6 0.98 0.70 – 1.37 0.001 0.9242
≥ Complet middle school 219 44.4
Adequacy of schooling
No 86 53.8 1.15 0.87 – 1.52 0.103 0.3097
Yes 192 44.4
Region
Federal District 119 46.7 1.02 0.82 – 1.29 0.006 0.8046
Surronding 159 47.2
Social Participation
No 164 49.2 1.05 0.86 – 1.28 0.029 0.5914
Yes 114 44.0
Domain 2 - Psychological - Dissatisfaction rate is equal to transformed score 0-100 below 70; Satisfaction rate is equal to transformed score 0-100 equal or greater than 70.
*Mantel-Hänszel/Exact Fisher test when recommended. #Poisson Regression model with robust variance.
&Minumum Wage (MW) amount in Brazil at the time of data collection: R$ 415.00; in Dollars: US$ 355.00. In 2008: US$ 1.00 = R$ 1.168.
Table 4. Association between predictive variables and dissatisfaction with the quality of life in the aspect of the social relations among users of public libraries in the Federal District and Surrounding region, 2008.
Variables / categories n %
Dissatisfaction
Not adjusted
PR 95%CI χ2 p-value*
Sex
Male 88 36.5 0.76 0.62 – 0.93 0.786 0.0050
Female 169 48.1
Age group (years old)
≤ 24 96 40.3 0.89 0.73 – 1.07 0.153 0.2160
> 25 161 45.5
Personal income&
Up to 1.5 MW 87 47.5 1.18 0.93 – 1.49 0.191 0.1664
Above 1.5 MW 73 40.3
Family income&
Up to 3.5 MW 119 48.2 1.21 0.99 – 1.48 0.337 0.0664
Above 3.5 MW 92 39.8
Schooling
≤ Incomplet middle
school 50 50.5 1.20 0.96 – 0.50 0.243 0.1189
≥ Complet middle school 207 42.0
Adequacy of schooling
No 85 53.1 1.33 1.11 – 1.61 0.841 0.0037
Yes 172 39.8
Region
Federal District 125 49.0 1.25 1.04 – 1.50 0.572 0.0167
Surronding 132 39.2
Social Participation
No 149 44.7 1.07 0.89 – 1.29 0.055 0.4586
Yes 108 41.7
Tabela 4. Continuation.
Variables / categories n Dissatisfaction% Adjusted*
PR 95%CI χ2 p-value*
Sex
Male 88 36.5 0.55 0.41 – 0.75 1.478 0.0001
Female 169 48.1
Age group (years old)
≤ 24 96 40.3 1.08 0.79 – 1.46 0.027 0.6063
> 25 161 45.5
Personal income&
Up to 1.5 MW 87 47.5 0.96 0.71 – 1.30 0.007 0.7981
Above 1.5 MW 73 40.3
Family income&
Up to 3.5 MW 119 48.2 1.41 1.03 – 1.92 0.480 0.0285
Above 3.5 MW 92 39.8
Schooling
≤ Incomplet middle
school 50 50.5 1.31 0.89 – 1.91 0.194 0.1636
≥ Complet middle school 207 42.0
Adequacy of schooling
No 85 53.1 1.15 0.83 – 1.59 0.077 0.3799
Yes 172 39.8
Region
Federal District 125 49.0 1.48 1.12 – 1.95 0.770 0.0055
Surronding 132 39.2
Social Participation
No 149 44.7 0.97 0.75 – 1.25 0.004 0.8329
Yes 108 41.7
Domain 3 - Social relations - Dissatisfaction rate is equal to transformed score 0-100 below 70; Satisfaction rate is equal to transformed score 0-100 equal or greater than 70.
*Mantel-Hänszel/Exact Fisher test when recommended. #Poisson Regression model with robust variance.
Variables / categories n Dissatisfaction%
Not adjusted
PR 95%CI χ2 p-value*
Sex
Male 193 80.0 0.91 0.84 – 0.98 0.700 0.0081
Female 309 88.3
Age group (years old)
≤ 24 197 82.8 1.96 0.89 – 1.03 0.126 0.2611
> 25 305 86.2
Personal income&
Up to 1.5 MW 157 85.8 1.05 0.96 – 1.15 0.108 0.2982
Above 1.5 MW 148 81.8
Family income&
Up to 3.5 MW 211 85.4 1.01 0.94 – 1.09 0.009 0.7580
Above 3.5 MW 195 84.4
Schooling
≤ Incomplet middle
school 90 90.9 1.09 1.01 – 1.17 0.344 0.0636
≥ Complet middle school 412 83.6
Adequacy of schooling
No 144 90.0 1.09 1.02 – 1.16 0.460 0.0320
Yes 358 82.9
Region
Federal District 224 87.8 1.06 1.00 – 1.14 0.322 0.0728
Surronding 278 82.5
Social Participation
No 286 85.9 1.03 0.96 – 1.10 0.070 0.4032
Yes 216 83.4
Continue...
Tabela 5. Continuation.
Variables / categories n Dissatisfaction%
Adjusted*
PR 95%CI χ2 p-value*
Sex
Male 193 80.0 0.86 0.77 – 0.97 060.6 0.0139
Female 309 88.3
Age group (years old)
≤ 24 197 82.8 1.03 0.92 – 1.16 003.6 0.5497
> 25 305 86.2
Personal income&
Up to 1.5 MW 157 85.8 0.98 0.87 – 1.09 001.0 0.7530
Above 1.5 MW 148 81.8
Family income&
Up to 3.5 MW 211 85.4 0.96 0.85 – 1.08 003.4 0.5575
Above 3.5 MW 195 84.4
Schooling
≤ Incomplet middle
school 90 90.9 1.03 0.89 – 1.21 002.3 0.6287
≥ Complet middle school 412 83.6
Adequacy of schooling
No 144 90.0 1.06 0.94 – 1.20 010.7 0.3013
Yes 358 82.9
Region
Federal District 224 87.8 1.04 0.93 – 1.16 004.8 0.4866
Surronding 278 82.5
Social Participation
No 286 85.9 0.99 0.90 – 1.10 000.0 0.9674
Yes 216 83.4
Domain 4 - Environment - Dissatisfaction rate is equal to transformed score 0-100 below 70; Satisfaction rate is equal to transformed score 0-100 equal or greater than 70.
*Mantel-Hänszel/Exact Fisher test when recommended. #Poisson Regression model with robust variance.
population. Therefore, it was deemed important to choose a suitable sample, which was already validated in our country, the WHOQOL-BREF.
The evaluation of Quality of Life with the WHO instruments WHOQOL-100 and WHOQOL-BREF have been applied in our country in people with depression2, elderly3,
adolescents4, alcohol-dependent individuals5 and in patients with spinal cord injury6. However,
previous studies where these instruments have been applied in the general population, speciically in the Federal District and Surrounding Region, were not found and thus the possibility of comparisons is limited.
Find information from the general population in diferent places enrich the knowledge about Brazilian people. While determining aspects of QoL in hospitals or health centers, certainly we faced with the bias of the disease. Search the QoL in places related to a spontaneous social interaction, such as in libraries, can enrich the analysis and broaden horizons of action to promote health.
Fields of action proposed in the Ottawa Charter12 include other social environments
such as workplaces, schools, clubs, associations, churches, who, like libraries, are also places frequented by individuals. One of the main features of the libraries is the fact that they exist in almost all municipalities and hardly fail to be frequented by people. Thus, research on QoL among users can also help us to know important aspects of communities, enabling the planning of public policies in a more contextualized manner more in line with the real needs of each place.
The survey showed the highest percentages of dissatisfaction among individuals of the Surroundings, which may indicate that regional inequalities have not yet been dealt with in the RIDE-DF. The country is full of good proposals, but a good proposal should be reviewed constantly in order to be in tune with the real needs of individuals in context.
The results of this study showed signiicant degrees of satisfaction in several areas that the WHOQOL-BREF10 covers. However, it is important to read the varying degrees of
dissatisfaction and satisfaction evidenced in this study, therefore, though often do not add most of the percentages, they should be considered to serve as a framework for planning of public policies that focus on promoting health, reducing inequalities and improving sanitation, leisure, culture and education, among others.
In most cases, governments propose and execute improvements in cities, communities or regions. However, to know at what level this is relected in the QoL of people may mean that, before doing any work, people will be able to be heard. In other words, the communities themselves, in a democratic and participatory manner, could give their opinion and choose what they want to improve their QoL.
Carr et al.9 showed that QoL instruments have many uses, among which serve as tools in
Coons et al.11 reported that there are no “better or worse” instruments for measuring
QoL, and that your choice should be according to the purpose of the research. This work covered individuals in the general population and aimed to analyze factors associated with dissatisfaction reported by individuals. There was a large proportion of women aged over 25 years old with personal and family monthly lower incomes, less schooling, without adequacy of schooling age who had dissatisfaction in the Quality of Life in all areas. In matters related to their health and Quality of Life were those that showed more dissatisfaction.
Factors related to the uneven distribution of income, low education and lack of equity in gender issues are reported almost daily in newscasts and news as well as population censuses carried out already in our country. It is observed that the greatest dissatisfaction reported in this study also include these factors and, despite many public policies in progress, many complaints persist. Search on QoL in general populations may demonstrate more efectively the aspects that should be prioritized, so that we have satisied individuals in full exercise of their citizenship.
Buss8 places strong inluence of the quality and living conditions on health. Therefore,
measuring the QoL is an important parameter in the design of policies that include the participation of the population in the planning of health promotion and promoting improvements in QoL of the communities, with a view to the solution of real problems that have long remained unresolved in our country.
The sample population was of convenience, that is, not all individuals attending libraries. So, due to the fact that have not been chosen by probabilistic procedure, under any circumstances would be representative of the population, which constitutes a limitation. However, the study was comprehensive because the sample has been collected in most public libraries in the area surveyed.
The results of this study show signiicant diferences among individuals residing in the Federal District and in the Surroundings, high levels of dissatisfaction among women on issues of income distribution and levels of satisfaction and dissatisfaction that indicate an important diagnosis of Quality of Life of these people. In this context, the library can contribute as a community hub for learning, interventions and health promotion, where goers individuals and users can even serve as multipliers for promotion of information about health in communities, because libraries, as cited by Gomes13 and by Antunes
et al.14 , are meeting places for the communities, where everyone can participate and
grow together.
concLusIon
evaluation of intersectoral interventions, as well as to verify the magnitude of the impact of public policies on health conditions of communities.
The results of this study points to signiicant gaps in the matters related QoL of users of public libraries in the regions studied, constituting a contribution to the diagnosis of the needs of this speciic population.
This study has limitations, which have been linked, contributing particularly to alert on gender issues and can assist in the planning of actions in the libraries areas, where women have greater opportunities for growth and improvement in their life conditions.
The vast majority of the complaints veriied punctuate economic, social, environmental and psychological aspects that relate to the lack of evidence relating to basic sanitation, health resources, culture, education, leisure, among others, which directly afect the people’s QoL.
The planning and the implementation of interventions that include the direct participation of individuals at all stages of the process is a priority and demonstrates how the libraries spaces are very important social niches, which can and should be illed with actions that could help to promote health and preventive actions in communities, aiming to improve the QoL of the collective population.
1. Minayo MCS, Hartz ZMA, Buss PM. Qualidade de vida e saúde: um debate necessário. Ciên Saúde Colet 2000; 5(1): 7-18.
2. Fleck MPA et al. Associação entre sintomas depressivos e funcionamento social em cuidados primários de saúde. Rev Saúde Pública 2002; 36(4): 431-8.
3. Pereira RJ et al. Contribuição dos domínios físico, social, psicológico e ambiental para a qualidade de vida global de idosos. Rev Psiq 2006; 28(1): 27-38.
4. Gordia AP, Quadros TMB, Campos W, Petroski EL. Domínio físico da qualidade de vida entre adolescentes: associação com atividade física e sexo. Rev Salud Pub 2009; 11(1): 50-61.
5. Lima AFBS. Qualidade de vida em pacientes do sexo masculino dependentes de álcool. [dissertação de mestrado] Porto Alegre: Universidade Federal do Rio Grande do Sul; 2001.
6. Bampi LNS, Guilhem D, Lima DD. Qualidade de vida em pessoas com lesão medular traumática: um estudo com o WHOQOL-BRIEF. Rev Bras Epidemiol 2008; 11(1): 67-77.
7. Campos MO, Rodrigues Neto JF. Qualidade de vida: um instrumento para promoção de saúde. Rev Baiana Saúde Pública 2008; 32(2): 232-40.
8. Buss PM. Promoção da saúde e qualidade de vida. Ciênc Saúde Colet 2000; 5(1): 163-77.
9. Carr AJ, Thompson PW, Kirwan JR. Quality of life measures. Br J Rheumatol 1996; 35(3): 275-81.
10. The WHOQOL Group. The World Health Organization quality of life assessment: position paper from the World Health Organization. Soc Sci Med 1995; 41: 1403-9.
11. Coons SJ, Rao S, Keininger DL, Hays RD. A comparative review of generic quality-of-life instruments. Pharmacoeconomics 2000; 17(1): 13-35.
12. Brasil. Ministério da Saúde/FIOCRUZ. Promoção da saúde: Cartas de Ottawa, Adelaide, Sundsvall e Santa Fé de Bogotá. Brasília: Ministério da Saúde/ IEC; 1992.
13. Gomes JRAA. Percepção de autocuidado, saúde e qualidade de vida em usuários das bibliotecas públicas do Distrito Federal e região do Entorno em 2008: estudo transversal. [dissertação de mestrado] Brasília: Universidade de Brasília; 2008.
14. Antunes W, Cavalcante GA, Gomes JRAA, Carneiro MA. Curso de capacitação para dinamização e uso da biblioteca pública. São Paulo: Global; 2012.
15. Instituto Brasileiro de Geograia e Estatística. Dados sobre cidades. Disponível em: http://www.ibge.gov. br/cidades. (Acessado em 07 de julho de 2011).
16. Hulley SB, Cummings SR. Designing clinical research. Baltimore: Willians & Wilkins; 1988.
17. Saupe R, Nietche EA, Cestari ME, Giorgi MDM, Krahl M. Qualidade de vida dos acadêmicos de enfermagem. Rev Latinoam Enferm 2004; 12(4): 636-42.
18. Von Elm E, Altman DG, Egger M, Pocock SJ, Gøtzscheef PC, Vandenbroucke JP. The Strengthening the Reporting of Observational Studies in Epidemiology (STROBE) statement. Guidelines for reporting observational studies. J Clin Epidemiol 2008; 61(4): 344-9.
Received on: 11/18/2011