Could Low Birth Weight be Associated with
Cardiovascular Disease in Adolescence?
Poderia o baixo peso ao nascimento ser associado com
risco cardiovascular na adolescência?
Priscila de Jesus dos Santos Alves
1Edward Araujo Júnior
2Ana Ciléia Pinto Teixeira Henriques
1Francisco Herlânio Costa Carvalho
31Department of Community Health, Escola de Medicina, Universidade Federal do Ceará, Fortaleza, CE, Brazil
2Department of Obstetrics, Escola Paulista de Medicina, Universidade Federal de São Paulo, São Paulo, SP, Brazil
3Department of Maternal and Child Health, Escola de Medicina, Universidade Federal do Ceará, Fortaleza, CE, Brazil
Rev Bras Ginecol Obstet 2016;38:189–195.
Address for correspondence Edward Araujo Júnior, MD, PhD, Rua Napoleão de Barros, 875, Vila Clementino, São Paulo, SP, Brazil 04024-002 (e-mail: [email protected]).
Keywords
►
low birth weight
►
cardiovascular
disease risk factors
►
anthropometry
►
low socioeconomic
status
►
adolescence
Abstract
Purpose
Previous studies have shown that low birth weight (LBW) is associated with
cardiovascular risk in late adulthood. Recent studies in adolescents suggest that
modi
fi
able factors may have greater in
fl
uence on increased cardiovascular risk. This
study aims to investigate the association between LBW and changes in anthropometric
and biochemical risk factors during adolescence in a population with low average
socioeconomic status.
Methods
In a retrospective double cohort, data of birth weight were extracted from
hospital records of children born on the same day between 1992 and 2002. According
to the World Health Organization, we classi
fi
ed the children as having LBW or normal
birth weight. A total of 172 subjects among children, adolescents and adults were
researched. We measured anthropometric and clinical data, lipid pro
fi
le and glucose
after an overnight fasting. The low and normal weight groups were compared using
Mann-Whitney U, Fischer exact, Chi-square (
2) and Student
’
s t tests.
Results
Pregnant women with preeclampsia delivered more newborns with LBW
(
p
<
0.001). Anthropometric and clinical parameters were similar between groups. No
differences were found in the family history of cardiovascular diseases (
p
¼
0.1), family
incomes (
p
¼
0.8) and maternal school education (
p
¼
0.8) between groups.
Conclusion
In this study, LBW did not increase cardiovascular disease risk factors in
adolescents. We observed absence of association between low birth weight and poor
health outcomes among adolescents with low socioeconomic status from an urban city
in the Brazilian northeast.
received
October 27, 2015
accepted
January 8, 2016
DOIhttp://dx.doi.org/ 10.1055/s-0036-1583171.
ISSN 0100-7203.
Copyright © 2016 by Thieme Publicações Ltda, Rio de Janeiro, Brazil
Introduction
Over the past two decades, an extensive and growing litera-ture has investigated the associations between low birth weight (LBW) and chronic diseases. Several clinical studies demonstrate that LBW is an important risk factor for athero-sclerosis, type 2 diabetes, hypertension, metabolic syndrome and endothelial dysfunction.1–8Many of those studies were conducted in countries with high average socioeconomic status and the majority demonstrated a strong association between LBW and increased risk of cardiovascular disease.
Nevertheless, many other studies have only found a posi-tive or a non-association between LBW and cardiovascular disease risk factors in young men and women or in children and adolescents. Moreover, there is convincing evidence that postnatal weight gain may have a greater influence on blood pressure than birth weight.4,9–11
There are not many studies of cardiovascular risk factors for LBW pediatric populations in the Brazilian northeast.12,13 This region has the lowest average socioeconomic status and the highest under-five mortality rates when compared with the other regions of the country.14 In recent years, the Brazilian government has invested heavily in programs in the northeast to ensure better child nutrition. However, these increases in the population’s income have not been reflected in health indicators, and the prevalence of over-weightness and obesity (important predictors for several cardiovascular disease risk factors) is rising.15
The hypothesis of this study is that LBW adolescents in low average socioeconomic status regions have the poorest
health status. Thus, the research was conducted to investi-gate whether LBW is associated with changes during adoles-cence in anthropometric and biochemical risk factors, in a low average socioeconomic status population in the Brazilian northeast.
Methods
We conducted a retrospective cohort study with male and female participants with ages varying from 10 to 20 years, born from 1992 to 2002, with LBW (less than 2,500 g at birth) or normal birth weight (NBW) (2,500 g) and who
were born and lived in Fortaleza, Brazil. This study was approved by The Research Ethics Committee of the Assis Chateaubriand Maternity Teaching Hospital and conducted between February and August 2013. A similar sample size was applied in previous studies which assessed the endo-thelial and metabolic disorders and fetal growth restriction in adolescents.16,17
Hospital birth records were used to check perinatal conditions and select potential subjects. Eligibility criteria included being healthy at the moment of the evaluation and having no cardiovascular and/or endocrine conditions or relevant cardiovascular disease risk factors. Participants were contacted through personal visits, phone calls and letters.
A total of 101 LBW adolescents were located; however, the mothers of 15 of these adolescents refused to sign the consent for the adolescent’s participation in the study. As for the NBW group, 102 adolescents were located,
Resumo
Objetivo
Estudos mostram que o baixo peso ao nascer está associado ao risco
cardiovascular na idade adulta. Estudos recentes em adolescentes sugerem que fatores
modi
fi
cáveis podem ter grande in
fl
uência no aumento do risco cardiovascular. Este
estudo busca investigar a associação entre baixo peso ao nascer com mudanças nos
fatores de risco antropométricos e bioquímicos durante a adolescência em uma
população com baixo nível socioeconômico.
Métodos
Em um estudo retrospectivo de coorte, dados de peso ao nascimento foram
extraídos de registros de hospitais, de crianças que nasceram no mesmo dia, entre
1992 e 2002. De acordo com a Organização Mundial da Saúde, classi
fi
camos as crianças
como baixo peso e peso normal. Um total de 172 pessoas, com idades entre 10 e 20
anos, foram pesquisadas. Avaliamos dados clínicos e antropométricos, per
fi
l lipídico e
glicemia de jejum. Os grupos de baixo peso e de peso normal foram comparados pelos
testes de Mann-Whitney, Exato de Fisher, Qui-quadrado e t-Student.
Resultados
Gestantes com pré-eclâmpsia tiveram mais partos de recém-nascidos
com baixo peso (
p
<
0,001). Parâmetros clínicos e antropométricos foram similares em
ambos os grupos. Não houve diferença na história familiar de doença cardiovascular
(
p
¼
0,1), renda familiar (
p
¼
0,8) e nível educacional materno (
p
¼
0,8) entre os
grupos.
Conclusão
Neste estudo, o baixo peso ao nascimento não aumentou o risco de
doença cardiovascular na adolescência. Observou-se ausência de associação entre o
baixo peso ao nascer e adversos resultados de saúde entre os adolescentes com baixo
nível socioeconômico de um centro urbano no Nordeste brasileiro.
Palavras-chave
►
baixo peso ao
nascimento
►
risco cardiovascular
►
antropometria
►
baixo nível
socioeconômico
with the mothers of 16 of them refusing to sign the consent.
The evaluation consisted of an interview to investigate medical history and familial occurrence of cardiovascular disease risk factors, and to conduct laboratorial exams and anthropometric and clinical measurements.
Weight and total body fat percentage, with the participants wearing light clothes and no shoes, were measured to the nearest 0.1 kg / 0.1% using a calibrated model W835 body analyzer (Wanchai-Ho, China). A wall-mounted stadiometer Seca (model 206, Hamburg, Germany) to the nearest 0.1 cm was used to measure standing height. With these measure-ments the body mass index (BMI) was calculated (in kilograms per square meters) and evaluated according to age and gender, based on World Health Organization (WHO) references.18
An anthropometric tape measure Wiso (model T872) was used to measure the circumference of the waist, abdomen and hips. The measurements were taken at the end of a gentle expiration, with the reference point halfway between the lower rib and the top of the iliac crest; the umbilical scar and the largest point of the outer hip, respectively. Other two measurements were waist/hip ratio and biceps skinfold were also measured.
To measure blood pressure, a Microlife calibrated semi-automatic sphygmomanometer (model BP 3BTO-H, Dunedin, USA) was used, after a 30-minute rest, and giving a 1-minute interval between the two measurements. If the difference between the first and second measurements was20 mm Hg, a new one would be taken, and the
average of the two closest measurements was used as the final result. The Fourth Report on the Diagnosis, Evaluation, and Treatment of High Blood Pressure in Children and
Adolescents was used as a reference for blood pressure according to age and gender.19
For laboratorial evaluation, fasting blood sugar test samples were collected, as well as samples to measure total cholesterol, high-density lipoprotein cholesterol and triglycerides. Low density lipoprotein cholesterol was calculated when triglycerides<400 mg/dL.20 The I
Guideline for Prevention of Atherosclerosis in Childhood and Adolescence was adopted as reference value.10Each participant received their laboratory results and a cardio-vascular report.
Statistical Analysis
Mean and standard deviations were calculated to all nor-mality variables using Student’s t test, and proportions were compared by Chi-square (2) or Fisher exact tests.
Kruskall–Wallis and Mann–Whitney U tests were used for non-normal distribution variables and described as quar-tiles: first quartile (Q1), median (M) and third quartiles (Q3). Some variables were converted to Z-score by using the formula: (x mean)/standard deviation. Analysis were per-formed using Stata program (College Station, TX, USA) version 12.0 for Mac and statistically significant if
p<0.05. An alpha error of 5% and a beta error of 20%
were adopted to calculate the sample size according to a relative risk of 2.3 to hypertension in preterm and low birth weight subjects.21
Results
Evaluations were obtained from 86 LBW and 86 NBW par-ticipants. The sample consisted of 56 females (65.1%) in the
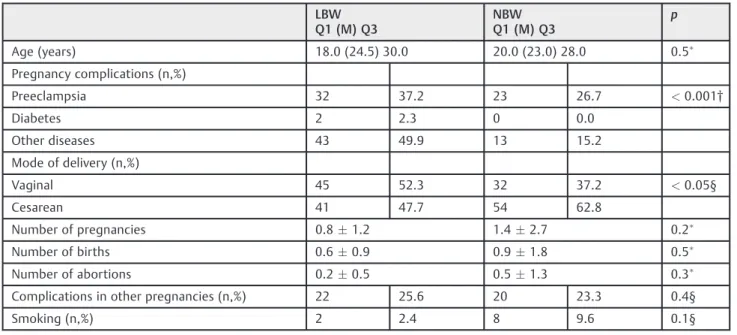
Table 1 Maternal characteristics during childbirth according offspring’s birth weight
LBW Q1 (M) Q3
NBW Q1 (M) Q3
p
Age (years) 18.0 (24.5) 30.0 20.0 (23.0) 28.0 0.5
Pregnancy complications (n,%)
Preeclampsia 32 37.2 23 26.7 <0.001†
Diabetes 2 2.3 0 0.0
Other diseases 43 49.9 13 15.2
Mode of delivery (n,%)
Vaginal 45 52.3 32 37.2 <0.05§
Cesarean 41 47.7 54 62.8
Number of pregnancies 0.81.2 1.42.7 0.2
Number of births 0.60.9 0.91.8 0.5
Number of abortions 0.20.5 0.51.3 0.3
Complications in other pregnancies (n,%) 22 25.6 20 23.3 0.4§
Smoking (n,%) 2 2.4 8 9.6 0.1§
Abbreviations: LBW, low birth weight; M, median; NBW, normal birth weight; Q1,first quartile; Q3, third quartile.
Note: Values are median and interquartile range for continuous variables; number of participants and percentages are presented for categorical variables however.
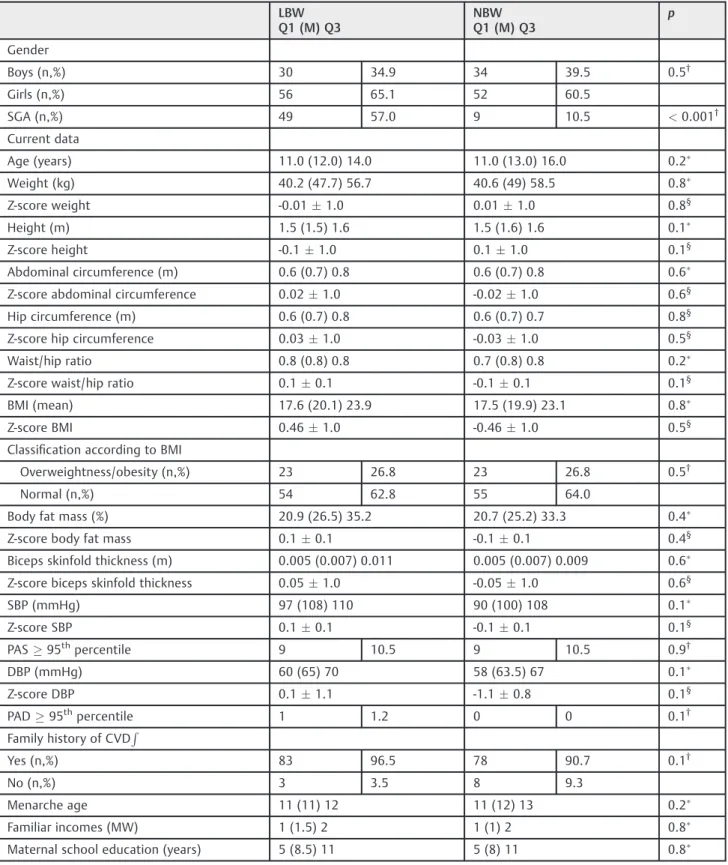
Table 2 Perinatal, anthropometric, and clinical current data according to birth weight groups
LBW Q1 (M) Q3
NBW Q1 (M) Q3
p
Gender
Boys (n,%) 30 34.9 34 39.5 0.5†
Girls (n,%) 56 65.1 52 60.5
SGA (n,%) 49 57.0 9 10.5 <0.001†
Current data
Age (years) 11.0 (12.0) 14.0 11.0 (13.0) 16.0 0.2
Weight (kg) 40.2 (47.7) 56.7 40.6 (49) 58.5 0.8
Z-score weight -0.011.0 0.011.0 0.8§
Height (m) 1.5 (1.5) 1.6 1.5 (1.6) 1.6 0.1
Z-score height -0.11.0 0.11.0 0.1§
Abdominal circumference (m) 0.6 (0.7) 0.8 0.6 (0.7) 0.8 0.6
Z-score abdominal circumference 0.021.0 -0.021.0 0.6§
Hip circumference (m) 0.6 (0.7) 0.8 0.6 (0.7) 0.7 0.8§
Z-score hip circumference 0.031.0 -0.031.0 0.5§
Waist/hip ratio 0.8 (0.8) 0.8 0.7 (0.8) 0.8 0.2
Z-score waist/hip ratio 0.10.1 -0.10.1 0.1§
BMI (mean) 17.6 (20.1) 23.9 17.5 (19.9) 23.1 0.8
Z-score BMI 0.461.0 -0.461.0 0.5§
Classification according to BMI
Overweightness/obesity (n,%) 23 26.8 23 26.8 0.5†
Normal (n,%) 54 62.8 55 64.0
Body fat mass (%) 20.9 (26.5) 35.2 20.7 (25.2) 33.3 0.4
Z-score body fat mass 0.10.1 -0.10.1 0.4§
Biceps skinfold thickness (m) 0.005 (0.007) 0.011 0.005 (0.007) 0.009 0.6
Z-score biceps skinfold thickness 0.051.0 -0.051.0 0.6§
SBP (mmHg) 97 (108) 110 90 (100) 108 0.1
Z-score SBP 0.10.1 -0.10.1 0.1§
PAS95thpercentile 9 10.5 9 10.5 0.9†
DBP (mmHg) 60 (65) 70 58 (63.5) 67 0.1
Z-score DBP 0.11.1 -1.10.8 0.1§
PAD95thpercentile 1 1.2 0 0 0.1†
Family history of CVDR
Yes (n,%) 83 96.5 78 90.7 0.1†
No (n,%) 3 3.5 8 9.3
Menarche age 11 (11) 12 11 (12) 13 0.2
Familiar incomes (MW) 1 (1.5) 2 1 (1) 2 0.8
Maternal school education (years) 5 (8.5) 11 5 (8) 11 0.8
Abbreviations: BMI, body mass index (in kilograms per square meters); CVD, cardiovascular disease; DBP, diastolic blood pressure; LBW, low birth weight; M, median; MW, minimum wage; NBW, normal birth weight; Q1,first quartile; Q3, third quartile; SBP, systolic blood pressure; SGA, small for gestation age.
Note: Values are median and interquartile range for continuous variables; number of participants and percentages are presented for categorical variables however.
LBW group and 52 females (60.5%) in the NBW group (p¼0.5), with an average age of 12.8 years for LBW
(SD¼2.2) and 13.6 years for NBW (SD¼2.9) (p¼0.2). Of
the total of 58 adolescents born small for gestational age, 49 (57.0%) were also LBW (p<0.05).
The maternal characteristics were similar, except for the mode of delivery (p<0.05) (►Table 1). No significant
differ-ences were identified regarding age, gender distribution, or current anthropometric data (weight, height, abdominal circumference, BMI, classification according to BMI, body fat mass and biceps skinfold thickness) (►Table 2). The
clinical parameters were similar between the groups. Systol-ic blood pressure and diastolSystol-ic blood pressure levels were also similar in the LBW group (systolic blood pressure¼2.6
mm Hg; diastolic blood pressure¼1.5 mm Hg). Subjects in
the LBW group tended to have lower height (p¼0.1). No
differences were found in the family history of cardiovascular diseases (p¼0.1), family incomes (p¼0.7) or maternal
schooling (p¼0.8). We also expressed anthropometric
var-iables as mean Z-scores. No significant differences were found. All the values were expressed as mean and standard deviations (►Table 2).
The data from the biochemical evaluation showed very similar results between LBW and NBW participants. Al-though low-density lipoprotein cholesterol, very low-densi-ty lipoprotein cholesterol and triglycerides levels were higher in the LBW group, there was no significant difference. Similarly, even though total cholesterol, high-density lipo-protein cholesterol and glucose levels were higher in the NBW group, no significant differences were observed (►Table 3).
Because more than 50% of the eligible patients were lost, we performed some statistical tests between participants and non-participants. LBW participants and non-participants had similar performances regarding perinatal characteristics such as ma-ternal age (p¼0.4), number of maternal gestations and
abor-tions (p¼0.5; p¼0.8 respectively), maternal preeclampsia
and diabetes (p¼0.5;p¼0.2 respectively), age (the average
age of participants was 13, and the average age of non-partic-ipants was 12; p<0.05), gender (p¼0.7), prematurity
(p¼0.1), small size for gestational age (higher frequency of
adolescents born small for gestational age in the participant’s group,p<0.05).
Discussion
Thefindings presented suggest that low birth weight was not associated with poor health outcomes among adolescents in the Brazilian northeast. The differences were non-significant for all risk factors except for blood pressure, where a border-line significant difference was observed. The adolescents in the LBW group had higher blood pressures (2.6 mm Hg for systolic blood pressure and 1.5 mm Hg for diastolic blood pressure), and they tended to have lower height than ado-lescents in the NBW group. These three variables showed the highest difference in the anthropometric data and tended to be higher in the LBW group, but were not significant. Although we selected subjects born on the same day, from 1992 to 2002, the groups had a different quartile of age. This occurred because we couldn’t localize the adolescents born exactly on the same day. However, this didn’t affect the results.
One of the strongest predictors of hypertension in adult-hood is a high level of blood pressure in childadult-hood.22 Another important risk factor is gender, which may infl u-ence the probability of elevated blood pressure during adulthood.23 Among women, the risk ratio ranged from 2.6 to 5.7, while among men it ranged from 2.3 to 4.3. However, some studies have found opposite results. A longitudinal prospective study with 250 subjects with ages between 11 and 14 years found no correlation between birth weight and blood pressure, weight or BMI. The authors suggested there are risk factors more important than LBW or gestational age that are related to increased blood pressure in childhood, such as high maternal BMI and a high birth weight (HBW).24
In Iceland, a study25investigated 857 children with ages between 9 and 10 years, 51.9% of which were girls. They found higher blood pressure levels among the boys, but no correlation was found between birth weight and absolute blood pressure values. Gestational age also did not correlate with blood pressure. Studies with other populations had
Table 3 Blood lipids and insulin profile according to birth weight groups
LBW NBW p
Glucose (mg/dL) 79.7 (9.6) 82.3 (9.5) 0.2
TC (mg/dL) 143.0 (24.4) 143.4 (26.2) 0.9
HDL-C (mg/dL) 43.4 (10.2) 44.3 (10.1) 0.5
LDL-C (mg/dL) 84.6 (21.1) 84.4 (23.6) 0.7
VLDL (mg/dL) 14.6 (6.5) 13.9 (7.1) 0.4
TG (mg/dL) 73.0 (32.6) 70.9 (30.0) 0.5
Abbreviations: HDL-C, high-density lipoprotein cholesterol; LBW, low birth weight; LDL-C, low-density lipoprotein cholesterol; NBW, normal birth weight; TC, total cholesterol; TG, triglycerides; VLDL-C, very low-density lipoprotein cholesterol.
Note: Values are mean and standard variation.
similar results in the US,26 China,9 England,4 Italy27 and Brazil.28
Despite socioeconomic factors such as family incomes and maternal education being comparable, the LBW group did not have an increased risk of cardiovascular disease. Studies show that women who deliver LBW infants take meticulous care of them and pay closer attention to medical advices.29 This could be the reason for less cardiovascular disease risk factors associated with catch-up growth,3 a determinant factor for cardiovascular diseases in LBW newborns. On the other hand, Fortaleza currently ranks as the ninth worst Brazilian capital on the Municipal Human Development Index.30 This index encompasses longevity, education and income. Thus, in this study NBW newborns were also ex-posed to poor conditions, which may explain why their results were similar to those of LBW newborns, even though the groups had a similar family history of cardiovascular diseases.
Countries have some peculiarities regarding socioeco-nomic status. It has been estimated that in regions in the world with low average socioeconomic status more than 200 million children less than 5 years old are not fulfilling their development potential. This fact can be the result of poverty, nutritional deficiencies and inadequate learning opportuni-ties.31In Brazil specifically, there have been fast changes in major social health determinants and in the organization of health services over the past three decades. The main changes during this period were economic growth, reduction in income inequality, urbanization, improvements in the education of women, decreased fertility rates, a government cash transfer program and improvements in the provision of water and sanitation.32
Furthermore, since the 1970’s a nutritional transition is occurring in Brazil, involving a decline in malnutrition in children and an increase in obesity and overweightness in adults. It is an apparent paradox that the highest frequencies of normal anthropometric measurements in Brazilian adults were found in the poorer northern and northeastern regions of Brazil.33However, a recent study showed that cardiovas-cular disease increased in these regions.34
The results contribute toward testing the validity of the Barker hypothesis in countries with low average socioeco-nomic status, especially in the poorest region of Brazil. An important feature in this study is that socioeconomic status and the same day of birth were accounted for and the groups were similar in average chronological age, gender and time frame for the menarche. We used international parameters to facilitate future comparisons with our data.
Some study limitations need to be addressed. Firstly, the neonatal data obtained from the hospital records had only been collected prior to the present study for other pur-poses and a long time ago. For that reason, some data was missing. Secondly, adolescents with birth weight between 2,500 and 3,000 g (n¼25) were included in the NBW
group; however, this group could include some subjects who did not reach their potential for intrauterine growth, which lead to confusing results. Although some authors
categorized birth weight in a manner similar to this research, they had different results.35Thirdly, complete information regarding pubertal status was not available, so bias may have been introduced by giving all participants the same pubertal status. Fourthly, we can’t increase our sample. As we have described, there were some difficulties in obtaining the hospital records that have maternal and neonatal data. Despite this, we got more than one thousand records. Unfortunately, we were unable find most of the patients. However, as we have shown, partic-ipants and non-particpartic-ipants had similar characteristics, and non-participants were not the reason behind the few differences between the groups that we found. Fifthly, we based our sample size calculation on hypertension; how-ever a few number of subjects had high levels of blood pressure. This could be the reason why no other differences were found.
Summarizing, LBW did not increase cardiovascular dis-ease risk factors in young adults in the second decade of life. The absence of an association between LBW and poor health outcomes among adolescents in a low average socioeconomic status population from a capital in the Brazilian northeast corroborates previousfindings in other countries with low average socioeconomic status. We suggest future prospective studies with more subjects to investigate this association.
References
1 Barker DJ. The fetal origins of coronary heart disease. Acta
Paediatr Suppl 1997;422:78–82
2 Kark M, Tynelius P, Rasmussen F. Associations between birth
weight and weight change during infancy and later childhood, and systolic blood pressure at age 15 years: the COMPASS study. Paediatr Perinat Epidemiol 2009;23(3):245–253
3 Morrison JL, Duffield JA, Muhlhausler BS, Gentili S, McMillen IC. Fetal growth restriction, catch-up growth and the early origins of insulin resistance and visceral obesity. Pediatr Nephrol 2010; 25(4):669–677
4 Primatesta P, Falaschetti E, Poulter NR. Birth weight and blood
pressure in childhood: results from the Health Survey for Eng-land. Hypertension 2005;45(1):75–79
5 Xiao X, Zhang ZX, Li WH, et al. Low birth weight is associated with
components of the metabolic syndrome. Metabolism 2010;59(9): 1282–1286
6 Cosmi E, Visentin S, Fanelli T, Mautone AJ, Zanardo V. Aortic
intima media thickness in fetuses and children with intrauterine growth restriction. Obstet Gynecol 2009;114(5):1109–1114
7 Zanardo V, Visentin S, Trevisanuto D, Bertin M, Cavallin F, Cosmi E.
Fetal aortic wall thickness: a marker of hypertension in IUGR children? Hypertens Res 2013;36(5):440–443
8 Zanardo V, Fanelli T, Weiner G, et al. Intrauterine growth
restric-tion is associated with persistent aortic wall thickening and glomerular proteinuria during infancy. Kidney Int 2011;80(1): 119–123
9 Bowers K, Liu G, Wang P, et al. Birth weight, postnatal weight
change, and risk for high blood pressure among Chinese children. Pediatrics 2011;127(5):e1272–e1279
10 Back Giuliano IdeC, Caramelli B, Pellanda L, Duncan B, Mattos S,
11 Visentin S, Grumolato F, Nardelli GB, Di Camillo B, Grisan E, Cosmi
E. Early origins of adult disease: low birth weight and vascular remodeling. Atherosclerosis 2014;237(2):391–399
12 Salgado CM, Jardim PC, Teles FB, Nunes MC. Low birth weight as a
marker of changes in ambulatory blood pressure monitoring. Arq Bras Cardiol 2009;92(2):107–121
13 Sousa MA, Guimarães IC, Daltro C, Guimarães AC. Association
between birth weight and cardiovascular risk factors in adoles-cents. Arq Bras Cardiol 2013;101(1):9–17
14 Instituto Brasileiro de Geografia e Estatística (IBGE) [Internet]. Tábuas abreviadas de mortalidade por sexo e idade: Brasil, Grandes Regiões e Unidades da Federação 2010. Rio de Janeiro: IBGE; 2013 [citado 2013 Set 22]. Disponível em: http://biblioteca. ibge.gov.br/visualizacao/livros/liv65137.pdf
15 Batista Filho M, Rissin A. [Nutritional transition in Brazil:
geo-graphic and temporal trends]. Cad Saude Publica 2003;19 (Suppl 1):S181–S191 Portuguese
16 dos Santos Alves PdeJ, P. T Henriques AC, Pinto LRM, et al.
Endothelial and metabolic disorders in adolescence: low birth weight is not an isolated risk factor. J Pediatr Endocrinol Metab 2015;28(3–4):407–413
17 Alves PJ, Henriques AC, Silva KF, et al. The influence of fetal growth restriction on cardiovascular health among adolescents in Brazil: a retrospective cohort study. Indian Pediatr 2015;52(2):109–114
18 de Onis M, Onyango AW, Borghi E, Siyam A, Nishida C, Siekmann
J. Development of a WHO growth reference for school-aged children and adolescents. Bull World Health Organ 2007;85(9): 660–667
19 National High Blood Pressure Education Program Working Group
on High Blood Pressure in Children and Adolescents. The fourth report on the diagnosis, evaluation, and treatment of high blood pressure in children and adolescents. Pediatrics 2004;114(2, Suppl 4th Report)555–576
20 Friedewald WT, Levy RI, Fredrickson DS. Estimation of the
con-centration of low-density lipoprotein cholesterol in plasma, without use of the preparative ultracentrifuge. Clin Chem 1972; 18(6):499–502
21 de Jong F, Monuteaux MC, van Elburg RM, Gillman MW, Belfort
MB. Systematic review and meta-analysis of preterm birth and later systolic blood pressure. Hypertension 2012;59(2):226–234
22 Cook NR, Gillman MW, Rosner BA, Taylor JO, Hennekens CH.
Prediction of young adult blood pressure from childhood blood pressure, height, and weight. J Clin Epidemiol 1997;50(5): 571–579
23 Carrico RJ, Sun SS, Sima AP, Rosner B. The predictive value of
childhood blood pressure values for adult elevated blood pres-sure. Open J Pediatr 2013;3(2):116–126
24 Filler G, Yasin A, Kesarwani P, Garg AX, Lindsay R, Sharma AP. Big
mother or small baby: which predicts hypertension? J Clin Hypertens (Greenwich) 2011;13(1):35–41
25 Steinthorsdottir SD, Eliasdottir SB, Indridason OS, Palsson R,
Edvardsson VO. The relationship between birth weight and blood pressure in childhood: a population-based study. Am J Hypertens 2013;26(1):76–82
26 Falkner B, Hulman S, Kushner H. Effect of birth weight on blood
pressure and body size in early adolescence. Hypertension 2004; 43(2):203–207
27 Salvi P, Meriem C, Temmar M, et al. Association of current weight
and birth weight with blood pressure levels in Saharan and Euro-pean teenager populations. Am J Hypertens 2010;23(4):379–386
28 Menezes AM, Hallal PC, Horta BL, et al. Size at birth and blood
pressure in early adolescence: a prospective birth cohort study. Am J Epidemiol 2007;165(6):611–616
29 Freitas Md, Kernkraut AM, Guerrero SM, et al. Followup of
premature children with high risk for growth and development delay: a multiprofessional assessment. Einstein (Sao Paulo) 2010; 8(2):180–186
30 Programa das Nações Unidas para o Desenvolvimento. Instituto
de Pesquisa Econômica Aplicada. Fundação João Pinheiro [Inter-net]. Índice de Desenvolvimento Humano Municipal: ranking–
todo o Brasil 2010. 2013 [citado 2013 Oct 15]. Disponível em: http://www.atlasbrasil.org.br/2013/pt/ranking/
31 Walker SP, Wachs TD, Grantham-McGregor S, et al. Inequality in
early childhood: risk and protective factors for early child devel-opment. Lancet 2011;378(9799):1325–1338
32 Victora CG, Aquino EM, do Carmo Leal M, Monteiro CA, Barros FC,
Szwarcwald CL. Maternal and child health in Brazil: progress and challenges. Lancet 2011;377(9780):1863–1876
33 Batista Filho M, Miglioli TC, Santos MC. Anthropometric
normali-ty in adults: the geographical and socio-economic paradox of the nutritional transition in Brazil. Rev Bras Saude Mater Infant 2007; 7(4):487–493
34 Baena CP, Chowdhury R, Schio NA, et al. Ischaemic heart disease
deaths in Brazil: current trends, regional disparities and future projections. Heart 2013;99(18):1359–1364
35 Monteiro PO, Victora CG, Barros FC, Monteiro LM. Birth size, early