Leukocyte, red blood cell and morphological adaptation to moderate physical training in
rats undernourished in the neonatal period
Introduction
Lack of protein results in several physiological and metabolic alterations, which have been linked to depression of the immune system(1). Thus, an adequate supply of nutrients is essential for the growth of all body systems. Studies on protein malnutrition in the intrauterine, neonatal and development stages have attempted, using animal models, to investigate the effect of exercise on nutritional recovery (NR)(2). As restoration of metabolic variables is slow, exercise may improve NR(1).
Moderate physical exercise (MPE) can trigger various biochemical, metabolic, hormonal and immune responses(3). For example, performing MPE can induce physiological changes such as the release of inlammatory mediators, cytokines and the activation of leukocytes(4). It may also favor aerobiosis, improving the kinetics of oxygen uptake by promoting better pulmonary absorption, oxygen transportation and its transference to cells(5). Aerobic exercise training also promotes an increase in the basal metabolic rate or energy expenditure thus inducing weight loss(6).
Few studies using physical training protocols have analyzed weekly responses to physical exercise on NR in patients who were submitted to malnutrition in the neonatal period.
Thus, the aim of this study was to analyze changes in leukocyte and red blood cell (RBC) parameters and on the body weight related to MPE in rats submitted initially to malnourishment during the neonatal period and subsequently NR.
Methods
Thirty-six male Wistar rats, bred in the Department of Nutrition of the Universidade Federal de Pernambuco, were used in this study. The Central Animal House is maintained at a temperature of 21 ± 2°C with a reversed 12-hour light cycle (light - 9:01 p.m. to 9:00 a.m. and dark - 9:01 a.m. to 9:00 p.m.). In this vivarium, animals are bred in polypropylene cages with food and water ad libitum.
For this study, adult animals were irst kept in the animal house for a period of 15 days to adapt to the reversed light cycle environment before being bred. A ratio of one male to two females was used during breeding. On pregnancy, deined by an increase in size, female rats were placed in individual cages until partum. The irst day postpartum was deined as the beginning of lactation at which time six male pups were placed with each mother. These groups were allocated to malnourishment (a low-protein diet - 8% casein) and normal nourishment (normal protein diet - Marcelo Tavares Viana1
Manuella Cavalcanti Perez2 Valdenilson Ribeiro Ribas1 Gilberto de Freire Martins3
Célia Maria Machado Barbosa de Castro1
Conlict-of-interest disclosure:
The authors declare no competing inancial interest
Submitted: 1/23/2012 Accepted: 5/21/2012
Corresponding author:
Marcelo Tavares Viana
Universidade Federal de Pernambuco, Laboratório de Fisiologia da Nutrição/ Departamento de Nutrição
Rua Prof. Morais Rego, Cidade Universitária 50670-901 Recife, PE, Brazil
www.rbhh.org or www.scielo.br/rbhh
DOI: 10.5581/1516-8484.20120073
Objective: To analyze the impact of moderate physical exercise on the total and differential leukocyte counts and red blood cell count of 36 sixty-day-old adult male Wistar rats subjected to early malnourishment.
Methods: The rats were divided in nourished (N - casein 17%) and malnourished groups (M - casein 8%) and these groups were then subdivided in trained (T) untrained (U) creating four groups NT, NU, MT and MU. The NT and MT groups were submitted to moderate physical exercise using a treadmill (60 min/day, 5 days/week for 8 weeks). On the 1st day, before the training started T0 and 24 hours after the last training day of the week (T1 until T8), a 1 mL aliquot of blood was collected from the animals’ tails for analysis. The total leukocyte count was evaluated in a cell counter with an electronic microscope. The cyanmethemoglobin technique was used to measure the hemoglobin level. The hematocrit values were determined as a percentage using the micro-hematocrit technique with a microcapillary reader and a cell counter was used to determine the red blood cell count. The t-test was used for statistical analysis
and a p-value < 0.05 was considered signiicant. Data are expressed as means ± standard deviation.
Results: There was a signiicant difference in the total leukocyte count between the NT (9.1 ± 0.1) and MT
groups (8.0 ± 0.1) from T1 and in neutrophils between the NT (22.1 ± 0.6) and MT groups (24.6 ± 1.8) from T7 (p < 0.05). There was no statistical signiicance in the hemoglobin, hematocrit and red blood cell count from T1.
Conclusions: According to the results of this study, moderate physical exercise seems to have induced physiologic adaptation in adult rats from T1.
Keywords: Exercise; Leukocytes; Malnutrition; Physical exertion; Animals; Rats
1 Universidade Federal de Pernambuco – UFPE, Recife, PE, Brazil
2 Instituto Materno Infantil de Pernambuco – IMIP, Recife, PE, Brazil
17% casein) regimens. The pups were fed the diet via the mother’s milk.
From the twenty-second day of life (weaning) groups of three pups were placed in cages, respecting the diet of the neonatal period. The animals were then fed commercial Labina rat feed which is used as a standard diet in the animal house because it contains 23% mixed protein. This diet was administered until the end of the experiment (Day 120).
The total body weight (TBW) of the animals was measured from the irst day of life until the end of the experiment using digital weighing scales with an accuracy of 0.1 g and a maximum capacity of 4 kg (Marte, model S-2000). The experimental period was divided into lactation (the irst 21 days), weaning (22nd to 59th day) and training (60th to 120th day).
At sixty days, the initial groups (nourished and malnourished) were subdivided for physical exercise creating four groups: trained and nourished (TN; n = 6), trained and malnourished (TM; n = 6), untrained and nourished (UN; n = 6) and untrained and malnourished (UM; n = 6).
The training groups (TN and TM) were submitted to a MPE protocol on a treadmill (60 mins daily, 5 days/week for 8 weeks(7)), while the other two groups remained in their cages, which were placed near to the treadmill at the time of the exercise period.
Analysis of red blood cell and leukocyte parameters
Before the start of training (T0) and 24 hours after the last session of each training week (T1 to T8), a small blood sample (1 mL) was collected from the tail of animals under anesthesia. A volume of 0.5 mL was used to measure RBC indices, such as the RBC count, hemoglobin and hematocrit and 0.5 mL was used for the total and differential leukocyte counts. The drawn blood was placed in a 5 mL tube containing one drop (20 μL) of 3% ethylenediaminetetraacetic Acid (EDTA) as anticoagulant.
The cyanmethemoglobin technique was used to measure the hemoglobin level with 10 mL of blood being diluted in 5 mL of hypotonic solution. Extrusion of hemoglobin is obtained by erythrocyte lysis with the formation of cyanmethemoglobin, the product resulting from a reaction between hemoglobin and cyanide. The concentration was inferred by spectrophotometry (Beckman DU-62) using a 540 nm ilter and calculated in mg/dL using the formula: Hb = OD of the sample x CF, where: Hb = hemoglobin concentration, OD = optical density and CF = conversion factor.
The hematocrit values were determined as a percentage using the micro-hematocrit technique with a microcapillary reader. A 0.1 M sodium phosphate buffer solution (PBS) at a ratio of 1:200 and pH = 7.4 was used for the RBC count in a hemocytometer. For the total leukocyte count, blood samples were diluted in Turk’s solution (3% acetic acid) at a ratio of 1:200(8) and counted using a hemocytometer. The differential leukocyte count employed the blood smear technique stained with Panótico Fast LB kit (Laborclin Ltd, Brazil).
This study was approved by the Research Ethics Committee on Animal Experimentation of the Center for Biological Sciences, Universidade Federal de Pernambuco (No. 76/07 Case No. 008226/2007-55) and followed the guidelines recommended by the Brazilian Committee of Animal Experimentation (COBEA).
Statistical analysis
The Normal distribution of the data was checked using the Shapiro-Wilk and Bartlet tests. The Student’s t-test was used to analyze variables within and between groups with the data being expressed as means ± standard deviation. Signiicance was set for a p-value < 0.05.
Results
Animals within each group were compared and no signiicant differences in the variables were identiied.
Body weight
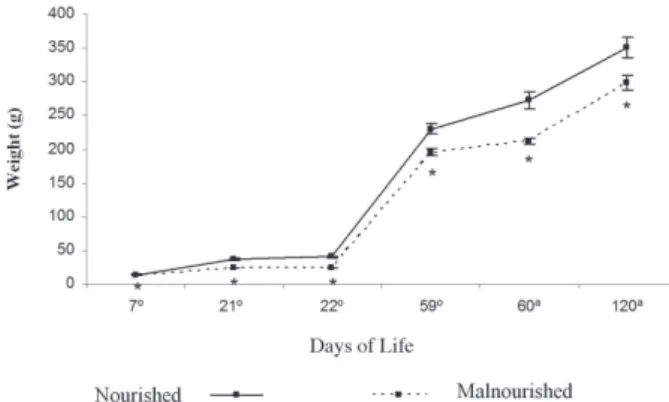
Malnourished animals gained less weight than the nourished animals from the 7th to the 120th day of life (p-value < 0.05) (Figure 1).
No signiicant differences were identiied on comparing the body weights between the animals of the TN and UN Groups and between those of the TM and UM Groups. Thus, for this variable the TN and UN Groups and the TM and UM Groups were combined to form just two groups: Nourished and Malnourished. On comparing these groups, the Malnourished Group gained signiicantly less TBW (211.03 ± 10.71 g) compared to the Nourished Group (272.16 ± 31.70 g) (p-value < 0.05) from the irst week of training (T1 - Figure 2).
Figure 1 - Lower total body weight gain in malnourished animals compared to nourished animals from the 7th to the 120th day of life. Mean ± standard deviation - Student t test, with p-value<0.05 *
Total leukocyte count
Table 1 shows the total leukocyte counts (TLC) of the four groups of rats over the 8 weeks of MPE. There was a significant difference between the malnourished and nourished animals at T0 (effect of malnutrition) and between the TM and TN groups at T1, T4 - T8 (effect of training - p-value < 0.05). Moreover, the TLC was significantly higher in the TM compared to the UM Group from the first week of training T1 (p-value < 0.05). However, a significant increase in the TLC of the TN Group compared to the UN Group was only observed from T4 (p-value < 0.05).
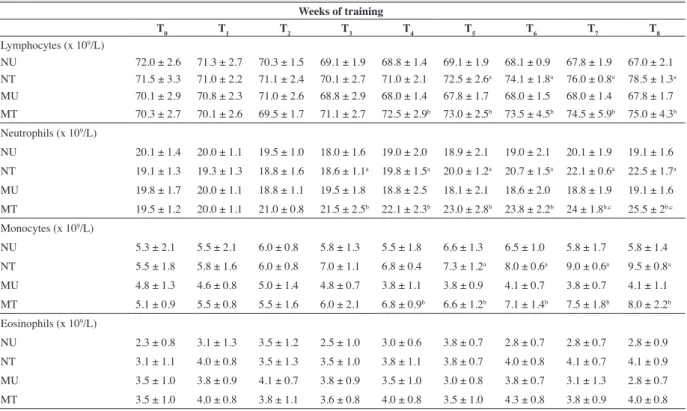
Differential leukocyte counts
Table 2 shows the differential leukocyte counts for the different groups over the 8 weeks of MPE. No signiicant difference was observed in the lymphocytes of malnourishment compared to nourished animals at T0 (effect of NR) and between the TM and TN groups from T1. However, a signiicant increase was observed on comparing the TM with the UM Group (effect of training) from T4 (p < 0.05), and between the TN and UN Groups (effect of training) from T5 (p < 0.05).
For neutrophils, there were no signiicant differences between the malnourished and nourished animals at T0 (effect of the NR) or between the TM and TN Groups up to T6. However there was a signiicant difference between the TM and TN Groups at T7 and T8 (p < 0.05).
Table 1 - Analysis of total leukocyte count (x 103/μL) in peripheral blood of adult rats within and between nourished and malnourished groups
during the eight weeks of moderate physical exercise
Weeks of training
T0 T1 T2 T3 T4 T5 T6 T7 T8
NU 7.9 ± 0.2 7.8 ± 0.2 7.1 ± 0.2 7.6 ± 0.4 7.3 ± 0.4 7.6 ± 0.3 8.0 ± 0.4 7.9 ± 0.2 7.3 ± 0.4
NT 8.0 ± 0.2 9.1 ± 0.1 7.5 ± 0.3 7.4 ± 0.3 9.0 ± 0.4a 9.7 ± 0.1a 10.4 ± 0.2a 10.7 ± 0.2a 10.9 ± 0.1a
MU 6.6 ± 0.4d 6.3 ± 0.4 6.4 ± 0.5 6.7 ± 0.5 6.7 ± 0.4 6.8 ± 0.2 6.8 ± 0.1 6.9 ± 0.1 6.8 ± 0.1
MT 6.7 ± 0.1d 8.0 ± 0.1b,c 7.7 ± 0.6b,c 7.5 ± 0.4b,c 7.9 ± 0.5b,c 7.8 ± 0.4b,c 8.1 ± 0.3b,c 8.0 ± 0.2b,c 7.7 ± 0.3b,c
T0 to T8 - Before the start of training to the eighth week of training; NU - Nourished untrained; NT - Nourished trained; MU - Malnourished untrained; MT -
malnourished trained; Mean ± standard deviation. Student’s t test (p-value < 0.05); a - Signiicant difference between nourished groups (NT and NU) b - Signiicant difference between malnourished groups (MT and MU); c - Signiicant difference between trained groups (MT and NT)
Table 2 - Analysis of differential leukocyte counts in peripheral blood of adult rats within and between nourished and malnourished groups during 8 weeks of MPE
Weeks of training
T0 T1 T2 T3 T4 T5 T6 T7 T8
Lymphocytes (x 109/L)
NU 72.0 ± 2.6 71.3 ± 2.7 70.3 ± 1.5 69.1 ± 1.9 68.8 ± 1.4 69.1 ± 1.9 68.1 ± 0.9 67.8 ± 1.9 67.0 ± 2.1
NT 71.5 ± 3.3 71.0 ± 2.2 71.1 ± 2.4 70.1 ± 2.7 71.0 ± 2.1 72.5 ± 2.6a 74.1 ± 1.8a 76.0 ± 0.8a 78.5 ± 1.3a
MU 70.1 ± 2.9 70.8 ± 2.3 71.0 ± 2.6 68.8 ± 2.9 68.0 ± 1.4 67.8 ± 1.7 68.0 ± 1.5 68.0 ± 1.4 67.8 ± 1.7
MT 70.3 ± 2.7 70.1 ± 2.6 69.5 ± 1.7 71.1 ± 2.7 72.5 ± 2.9b 73.0 ± 2.5b 73.5 ± 4.5b 74.5 ± 5.9b 75.0 ± 4.3b
Neutrophils (x 109/L)
NU 20.1 ± 1.4 20.0 ± 1.1 19.5 ± 1.0 18.0 ± 1.6 19.0 ± 2.0 18.9 ± 2.1 19.0 ± 2.1 20.1 ± 1.9 19.1 ± 1.6
NT 19.1 ± 1.3 19.3 ± 1.3 18.8 ± 1.6 18.6 ± 1.1a 19.8 ± 1.5a 20.0 ± 1.2a 20.7 ± 1.5a 22.1 ± 0.6a 22.5 ± 1.7a
MU 19.8 ± 1.7 20.0 ± 1.1 18.8 ± 1.1 19.5 ± 1.8 18.8 ± 2.5 18.1 ± 2.1 18.6 ± 2.0 18.8 ± 1.9 19.1 ± 1.6
MT 19.5 ± 1.2 20.0 ± 1.1 21.0 ± 0.8 21.5 ± 2.5b 22.1 ± 2.3b 23.0 ± 2.8b 23.8 ± 2.2b 24 ± 1.8b,c 25.5 ± 2b,c
Monocytes (x 109/L)
NU 5.3 ± 2.1 5.5 ± 2.1 6.0 ± 0.8 5.8 ± 1.3 5.5 ± 1.8 6.6 ± 1.3 6.5 ± 1.0 5.8 ± 1.7 5.8 ± 1.4
NT 5.5 ± 1.8 5.8 ± 1.6 6.0 ± 0.8 7.0 ± 1.1 6.8 ± 0.4 7.3 ± 1.2a 8.0 ± 0.6a 9.0 ± 0.6a 9.5 ± 0.8a
MU 4.8 ± 1.3 4.6 ± 0.8 5.0 ± 1.4 4.8 ± 0.7 3.8 ± 1.1 3.8 ± 0.9 4.1 ± 0.7 3.8 ± 0.7 4.1 ± 1.1
MT 5.1 ± 0.9 5.5 ± 0.8 5.5 ± 1.6 6.0 ± 2.1 6.8 ± 0.9b 6.6 ± 1.2b 7.1 ± 1.4b 7.5 ± 1.8b 8.0 ± 2.2b
Eosinophils (x 109/L)
NU 2.3 ± 0.8 3.1 ± 1.3 3.5 ± 1.2 2.5 ± 1.0 3.0 ± 0.6 3.8 ± 0.7 2.8 ± 0.7 2.8 ± 0.7 2.8 ± 0.9
NT 3.1 ± 1.1 4.0 ± 0.8 3.5 ± 1.3 3.5 ± 1.0 3.8 ± 1.1 3.8 ± 0.7 4.0 ± 0.8 4.1 ± 0.7 4.1 ± 0.9
MU 3.5 ± 1.0 3.8 ± 0.9 4.1 ± 0.7 3.8 ± 0.9 3.5 ± 1.0 3.0 ± 0.8 3.8 ± 0.7 3.1 ± 1.3 2.8 ± 0.7
MT 3.5 ± 1.0 4.0 ± 0.8 3.8 ± 1.1 3.6 ± 0.8 4.0 ± 0.8 3.5 ± 1.0 4.3 ± 0.8 3.8 ± 0.9 4.0 ± 0.8
T0 to T8 - Before the start of training to the eighth week of training; NU - Nourished untrained; NT - Nourished trained; MU - Malnourished untrained; MT -
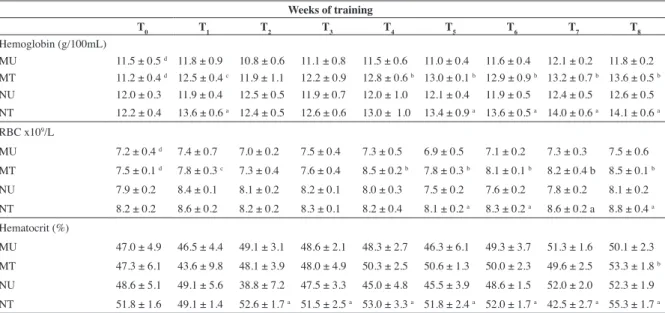
In respect to the RBC count, there was a statistical difference between the nourished and malnourished animals at T0 (p < 0.05 - effect of malnutrition). Between the trained groups (TN and TM), there was a signiicant difference at T1 (p < 0.05). However, this difference was not observed from T2 to T8. On comparing TN with UN and TM with UM there were signiicant increases from T5 and T4, respectively (p < 0.05).
Discussion
This study analyzed physiological changes induced by MPE on the leukocytes and RBCs of the peripheral blood and on the morphology (TBW) of adult male rats submitted to early malnourishment. The total and differential leukocyte counts (neutrophils, lymphocytes, eosinophils and monocytes) were evaluated as were the RBC count and the hematocrit and hemoglobin concentrations. To identify the impact of MPE and NR on animals that had been submitted to malnourishment and those that had not, these variables were measured at the end of each week of training (T1 to T8) and compared both with basal measurements (T0) and between the different experimental groups.
Before the start of training (T0)
At T0, the total lymphocytes, and hemoglobin and Hematocrit concentrations of malnourished animals were lower, even following NR, compared to the nourished animals; however, there were no signiicant differences in the other variables. It is likely that NR was not effective for these speciic variables. These results may be a consequence of the period when malnutrition was applied. At this stage, there is a greater demand for calories and From T3 there were signiicant differences between the TM and UM
Groups and between the TN and UN Groups from T3 (p < 0.05). No signiicant difference was observed for monocytes between the nourished and malnourished animals at T0 (effect of the NR) or between the TM and TN Groups from T1. However on comparing the trained and untrained animals, there was a signiicant increase for the TM compared to the UM Group (effect of training) from T4 and between the TN and UN Groups (effect of training) from T5 (p < 0.05).
Eosinophils did not change signiicantly with NR or with training; although there were slight increases in their count, no signiicant differences were observed between nourished and malnourished animals with training.
Red blood cell indices
Table 3 shows the changes in RBC indices over the 8 weeks of training. There were no signiicant differences between the hematocrit levels of the nourished and malnourished animals at the start of training (T0 - effect of the NR) or between the TM and TN Groups from T1. However a signiicant increase was observed for the TN Group compared to the UN Group from T2 (p <0.05); a signiicant increase in the TM Group compared to the UM Group occurred at T8 (p < 0.05).
There were statistical differences for hemoglobin between the nourished and malnourished animals at T0 (effect of malnutrition) and between the TM Group and TN Group at T1 (p < 0.05). However, this difference was not signiicant from T2. A signiicant increase in hemoglobin was observed in the TN Group compared to the UN Group at T1 (effect of early training - break in homeostasis) and from T5 (p < 0.05); the difference was signiicant between the TM and UM Groups from T4 (p < 0.05).
Table 3 - Analysis of the red blood cell (RBC) indices in peripheral blood of adult rats within and between nourished and malnourished groups
Weeks of training
T0 T1 T2 T3 T4 T5 T6 T7 T8
Hemoglobin (g/100mL)
MU 11.5 ± 0.5 d 11.8 ± 0.9 10.8 ± 0.6 11.1 ± 0.8 11.5 ± 0.6 11.0 ± 0.4 11.6 ± 0.4 12.1 ± 0.2 11.8 ± 0.2
MT 11.2 ± 0.4 d 12.5 ± 0.4 c 11.9 ± 1.1 12.2 ± 0.9 12.8 ± 0.6 b 13.0 ± 0.1 b 12.9 ± 0.9 b 13.2 ± 0.7 b 13.6 ± 0.5 b
NU 12.0 ± 0.3 11.9 ± 0.4 12.5 ± 0.5 11.9 ± 0.7 12.0 ± 1.0 12.1 ± 0.4 11.9 ± 0.5 12.4 ± 0.5 12.6 ± 0.5
NT 12.2 ± 0.4 13.6 ± 0.6 a 12.4 ± 0.5 12.6 ± 0.6 13.0 ± 1.0 13.4 ± 0.9 a 13.6 ± 0.5 a 14.0 ± 0.6 a 14.1 ± 0.6 a
RBC x109/L
MU 7.2 ± 0.4 d 7.4 ± 0.7 7.0 ± 0.2 7.5 ± 0.4 7.3 ± 0.5 6.9 ± 0.5 7.1 ± 0.2 7.3 ± 0.3 7.5 ± 0.6
MT 7.5 ± 0.1 d 7.8 ± 0.3 c 7.3 ± 0.4 7.6 ± 0.4 8.5 ± 0.2 b 7.8 ± 0.3 b 8.1 ± 0.1 b 8.2 ± 0.4 b 8.5 ± 0.1 b
NU 7.9 ± 0.2 8.4 ± 0.1 8.1 ± 0.2 8.2 ± 0.1 8.0 ± 0.3 7.5 ± 0.2 7.6 ± 0.2 7.8 ± 0.2 8.1 ± 0.2
NT 8.2 ± 0.2 8.6 ± 0.2 8.2 ± 0.2 8.3 ± 0.1 8.2 ± 0.4 8.1 ± 0.2 a 8.3 ± 0.2 a 8.6 ± 0.2 a 8.8 ± 0.4 a
Hematocrit (%)
MU 47.0 ± 4.9 46.5 ± 4.4 49.1 ± 3.1 48.6 ± 2.1 48.3 ± 2.7 46.3 ± 6.1 49.3 ± 3.7 51.3 ± 1.6 50.1 ± 2.3
MT 47.3 ± 6.1 43.6 ± 9.8 48.1 ± 3.9 48.0 ± 4.9 50.3 ± 2.5 50.6 ± 1.3 50.0 ± 2.3 49.6 ± 2.5 53.3 ± 1.8 b
NU 48.6 ± 5.1 49.1 ± 5.6 38.8 ± 7.2 47.5 ± 3.3 45.0 ± 4.8 45.5 ± 3.9 48.6 ± 1.5 52.0 ± 2.0 52.3 ± 1.9
NT 51.8 ± 1.6 49.1 ± 1.4 52.6 ± 1.7 a 51.5 ± 2.5 a 53.0 ± 3.3 a 51.8 ± 2.4 a 52.0 ± 1.7 a 42.5 ± 2.7 a 55.3 ± 1.7 a
T0 to T8 - Before the start of training to the eighth week of training; RBC - red blood cell count; NU - Nourished untrained; NT - Nourished trained; MU -
proteins for cell function and to provide energy for the neonatal metabolism(9). The cellular changes caused by malnourishment seem to impact on the formation of lymphoid organs(10), as well as on leukocyte expansion during adulthood(11).
There is a relationship between the low biological value of dietary protein and iron intake and alterations in the RBC parameters(12). Malnourishment may change the structure of hematocrit and hemoglobin reducing concentrations and function(12). The lack of iron can alter oxygen transport, thereby reducing the maximum oxygen consumption (VO2 max), one of the parameters used to analyze performance in physical exercise(5). Malnourishment may have altered the protein content of the milk provided to the offspring thereby impacting the TBW(13) keeping the weight down from the 7th day of the neonatal period until the end of the experiment (120th day).
This work corroborated, in some respects, to another study that did not observe changes in the monocyte and eosinophil counts of malnourished compared to nourished animals, however, there was a signiicant reduction in total leukocyte count during this period and in the TBW of the animals from the 5th day of life(13). The effects of restricted protein consumption during the neonatal period were also seen in rats from day 5(14). In the study by Barone et al.(12) it is possible that the differences in the other variables are due to speciic physiological responses to the type of training (swimming), as the experiment designs were similar.
In another study, malnourishment caused signiicant changes in rats from the 21st to the 60th day of life(1). This result is different from the current study, as although the objectives were similar, the malnourishment continued beyond the neonatal period. This does not change the effectiveness of the model utilized, but may hinder the identiication of some cellular responses that are affected speciically during the neonatal period(10,11). In another model, the red and white blood cell variables of undernourished rats administered with saline did not differ from those administered lipopolysaccharides however, the body weight during adulthood was different to rats that were breastfed(15).
The results in the current study differ from a study that administered an endotoxin (lipopolysaccharides) in the neonatal period(15) as we did not use exogenous pro-inlammatory stimuli during the experimental period. Malnourishment in the neonatal period reduces the immunocompetence and may cause damage to structures and functions of organ systems such as the nervous, endocrine and immune systems(16,17). NR may re-establish these losses, but the process is slow(1) and physical exercise may help to reduce the effects caused by malnourishment.
1st week of training (T 1)
During this period, the purpose of the training was to break the organic homeostasis of the animals(18); some variables responded with values above baseline, albeit sometimes without signiicance. It was also observed that malnourishment signiicantly affected the total leukocyte count and hemoglobin and hematocrit concentrations even with the start of training. It is possible that these variables are not responsive to short sessions (5 minutes) of MPE(19), which altered the responses of other variables, creating an increase in the number of blood cells(20).
The irst week of MPE triggered physiological and metabolic responses similar to those of acute training, despite the moderate intensity. These changes induced homeostatic adjustments(21), either as a response to physical stress(22) or as pre-disposition of changes to training. The physical exercise in acute conditions can change the count, distribution and functional capacity of some cells(19). These conditions were observed in the signiicant increase in the total leukocyte count of animals that performed moderate physical exercise for 5 minutes compared to light physical exercise for 5 minutes(19).
A short period of physical exercise can be compared to sudden physical stress as it also induces changes in RBCs. Animals, but not humans, are capable of storing large quantities of RBCs in the spleen and expel them into circulation when the oxygen transport system is under stress(12). In the current study, the irst week of MPE seems to have induced a higher demand of energy from the cardiovascular system thereby improving VO2max. as shown by the increased hematocrit and hemoglobin concentrations. Thus, the lack of nutrients does not appear to have changed the chemiosmotic coupling process of aerobic energy production in the mitochondria(4,12).
The energy production in the mitochondria results in changes that appear to be related to increased metabolism during physical exercise, and thus, the TBW has been used to evaluate this(23). During the entire period of training (T
1 to T8) there were signiicant differences in the TBW between training groups, however, there were no differences within groups. This result of the TM Group demonstrates that NR was eficient, as energy expenditure and the catabolic phase are more intense with the association of physical exercise and protein deiciency(2), inducing a greater reduction in TBW.
In a study that used swimming with this animal model, a smaller weight gain was observed in rats from the 5th week of physical exercise compared to a control group that did not swim(12). Although the periods and type of exercise were different, the results are similar, however, in the current study the rats were irst submitted to malnourishment and later to NR. It is possible that the differences in methodology contributed to the differences in the outcomes.
2nd and 3rd week of training (T
2 and T3)
This stage of the physical training was characterized by a transition between the breakdown of homeostasis to stability, which led to some responsive variables. Malnourishment did not impede signiicant increases in the total leukocyte and neutrophil counts of the TM compared to UM animals, and the total leukocyte count in relation to the TN Group. Important, albeit non-signiicant, increases were observed for the other variables both between the groups of malnourished animals and compared to the nourished rats. It is possible that these responses occurred due to the MPE, which, combined with NR, induced physiological adaptations in cells thereby minimizing the expected differences.
MPE, as in the interval between T0 and T3, there was a mean total leukocyte count of 9.340/mm3, a lower value than what is suggestive of inlammatory leukocytosis(24).
An increase in the lymphocyte count was observed in a group of rats after swimming to exhaustion(25) and in another group submitted to 8 weeks of MPE on a treadmill(18). In another experiment, regular exercise sessions at submaximal intensities did not alter the lymphocyte count(26). However, leukocytosis and lymphocytosis was identiied in rats subjected to 5 and 15 minutes of moderate and acute physical exercise(27). Despite the similarity, it is dificult to compare the results of this study with the literature, as here the changes in weight each week were compared to T0.
Physical exercise seems to have inluenced the increase in RBC indices in the period from T2 to T3 compared to the period of malnourishment. This increase in oxygen transportation may have improved the VO2max., thereby improving the aerobic capacity of the animals in the trained group. These results, in principle, suggest that the TM group did not suffer from a lack of nutrients such as iron, responsible for transporting oxygen and co-factor disorders such as anemia(27). There is a possibility of a reduction in the RBCs with training, which would cause pseudoanemia(27).
The hematocrit and hemoglobin concentrations and RBC count of Wistar rats submitted to swimming for 6 weeks, did not change statistically(6). It is possible that the type of exercise, the environment and diet given in the neonatal period may have corroborated to the differences found compared to this work. Increases in hematocrit and hemoglobin concentrations were observed in another study that used psychological stress employing restraint(28). These results corroborate the current work, even though another type of stress and conditioning was used.
Animals are able to retain RBCs in the spleen and release them into circulation when the oxygen transport system is under stress(28). This mechanism, via the sympathetic nervous system, results in a contraction of the smooth muscles of the spleen reducing its volume(28). Thus, chronic physical stress, as in the current study, may have caused changes in oxygen supply, with possible increases in the concentrations of 2,3-diphosphoglycerate in RBCs(28). This compound binds to hemoglobin, reducing its afinity to oxygen thereby making it available to the tissues.
From the 4th to 8th week of training (T 4 to T8)
This period was described as the beginning of the period of physiological adaptation to training. Most variables tended to have moderate increases in their values. NR helped to consolidate the effects caused by the MPE on the TM Group for almost all study variables except for the eosinophil count. This, despite the changes throughout the period of training, was not responsive to MPE. As the eosinophil count did not differ within the groups or between groups, the oxidative stress to overtraining was minimized(29). These responses observed in the study variables were similar in the TN Group.
In this work, malnourishment did not change, in general, the leukocyte, hematological and morphological responses in the group of malnourished animals in respect to physical exercise during adulthood. These results corroborate other trials that did not observe signiicant cellular changes induced by malnourishment in adult females, even using the same malnutrition during pregnancy
and lactation, weaning at 30 days and swimming as MPE(30). It may be noted that important variables such as gender and low-protein diet during pregnancy did not inluence the results.
The inluence of malnourishment on linear and muscle growth was also studied in young rats and children during NR(29). It was observed that groups subjected to light physical exercise improved in terms of anthropometric indices of growth(29). It seems that the recovering organism preserves the homeostatic mechanisms that guarantee physiological adaptations to physical exercise, which stimulate linear growth(29). Our results, in line with other publications(30,29), tend to suggest a possible interaction between NR and physical exercise in response to malnourishment.
The effects of NR and MPE attenuated possible consequences of malnourishment in trained rats, establishing for some variables, signiicantly higher increases compared to well-nourished rats. The MPE seems to have induced adaptations of leukocyte and RBC variables of adult male Wistar rats that were submitted to early malnourishment as well as attenuated the reduction in their TBW.
References
1. Santhiago V, Silva AS, Gobatto CA, Mello MA. Treinamento físico durante a recuperação nutricional não afeta o metabolismo muscular da glicose de ratos. Rev Bras Med Esporte. 2006;12(2):76-80.
2. Papoti M, Almeida PB, Prada FJ, Eleno TG, Hermini HA, Gobatto CA, Mello MA. Máxima fase estável de lactato durante a natação em ratos recuperados de desnutrição protéica. Motriz, Rio Claro [Internet]. 2003 [cited 2011 Nov 21] ;9(2):103-10. Available from: http://www.rc.unesp. br/ib/eisica/motriz/09n2/14Papoti.pdf
3. Lapin LP, Prestes J, Pereira GB, Palanch AC, Cavaglieri CR, Verlengia R. Respostas metabólicas e hormonais ao treinamento físico. Rev Bras Educ Física Esporte Lazer Dança. 2007;2(4):115-24.
4. Moraska A, Deak T, Spencer RL, Roth D, Fleshner M. Treadmill running produces both positive and negative physiological adaptations in Sprague-Dawley rats. Am J Physiol Regul Integr Comp Physiol. 2000;279(4):R1321-9.
5. Cruz AM da. Resistência aeróbia e eritropoetina. Estudos (Goiânia). 2006;33(7/8): 553-72.
6. Nascimento E, Cavalcante T, Pereira S, Palmeira A, Rocha MC, Viana MT, et al. O exercício físico crônico altera o peril leucocitário e a taxa de fagocitose de ratos estressados. Rev Port Ciênc Desp. 2004;4(3):26-33. 7. Leandro CG. Inluência do treino de resistência moderado na resposta
imunológica de ratos submetidos a contenção aguda [thesis]. Portugal: Faculdade de Ciências do Desporto e de Educação Física - Universidade do Porto; 2005.
8. Stibbe W, Weise M, Seidel D. [Automated platelet count in thrombocytopenic patients-a comparison of methods]. J Clin Chem Clin Biochem. 1985;23(7):399-404. German.
9. Pithon-Curi TC, Schumacher RI, Freitas JJ, Lagranha C, Newsholme P, Palanch AC, et al. Glutamine delays spontaneous apoptosis in neutrophils. Am J Physiol Cell Physiol. 2003;284(6):C1355-61.
10. Chandra RK. Nutrition and the immune system from birth to old age. Eur J Clin Nutr. 2002;56(Suppl 3):S73-6
11. Cunningham-Rundles S, McNeeley DF, Moon A. Mechanisms of nutrient modulation of the immune response. J Allergy Clin Immunol. 2005;115(6):1119-28, quiz 1129. Comment in: J Allergy Clin Immunol. 2005;115(6):1235-7.
III. Interaction between copper and iron in maternal protein deiciency. Placenta. 1988;19(1):113-8.
13. Porto SM, Araújo FR, Melo JF, Silva RR, Silva KM, De Castro CM. Cinética do peril leucocitário do sangue, antes e após treinamento físico moderado, em ratos adultos desnutridos no período neonatal. An Fac Med Univ Fed Pernamb. 2006;51(1):59-65.
14. Queiros-Santos A. Desnutrição precoce e estresse agudo: aspectos da resposta imunitária em ratos adultos [dissertation]. Recife: Universidade Federal de Pernambuco; 2000.
15. Ferreira e Silva WT. Aspectos da resposta inlamatória em ratos adultos endotoxêmicos submetidos à desnutrição no período de aleitamento. [dissertation]. Recife. Universidade Federal de Pernambuco; 2002.
16. Rocha-de-Melo AP, Picanço-Diniz CW, Borba JM, Santos-Monteiro JG, Guedes RC. NADPH-diaphorase histochemical labeling patterns in the hippocampal neuropil and visual cortical neurons in weaned rats reared during lactation on different litter sizer. Nutrit Neurosci. 2004;7(4):207-16. 17. Costa Rosa LF, Vaisberg MW. Inluência do exercício na resposta imune.
Rev Bras Med Esporte [Internet].2002 [cited 2011 Nov 21];8(4):167:72. Available from: http://www.scielo.br/pdf/rbme/v8n4/v8n4a06.pdf
18. Dias R, Frollini AB, Prestes J, Ferreira CK, Donatto FF, Verlengia R, et al. Efeito do exercício agudo de curta duração em leucócitos circulantes e linfócitos teciduais de ratos. Rev Bras Educ Fis Esp. 2007;21(3):229-49.
19. Green KJ, Croaker SJ, Rowbottom DG. Carbohydrate supplementation and exercise-induced changes in T-lymphocyte function. J Appl Physiol. 2003;95(3):1216-23.
20. Pereira B, Souza Jr TP. Adaptação e rendimento físico - considerações biológicas e antropológicas. Rev Bras Ci Mov [Internet]. 2005 [cited 2011 Nov 21];13(2):145-52. Available from: http://portalrevistas.ucb.br/
index.php/RBCM/article/view/636/647
21. Afonso M, Souza CN, Zagatto AM, Luciano E. Respostas metabólicas agudas ao exercício físico moderado em ratos wistar. Motriz, Rio Claro [Internet]. 2003 [cited 2011 Nov 21] ;9(2):87-92. Available from: http:// www.rc.unesp.br/ib/eisica/motriz/09n2/Afonso.pdf
22. Green KJ, Rowbottom DG, Mackinnon LT. Exercise and T-lymphocyte function: a comparison of proliferation in PBMC and NK cell-depleted PBMC culture. J Appl Physiol. 2002;92(6):2390-5.
23. Prestes J, Ferreira CK, Frollini AB, Dias R, Donatto FF, Guereschi MG, et al. Inluência do exercício físico agudo realizado até a exaustão sobre o número de leucócitos, linfócitos e citocinas circulantes. Fit Perf J. 2007;6(1):32-7.
24. Kim H, Shin MS, Kim SS, Lim BV, Kim HB, Kim YP, et al. Modulation of immune responses by treadmill exercises in Sprague-Dawley rats. J Sports Med Phys Fitness. 2003;43(1):99-104.
25. Pedersen BK, Hoffman-Goetz L. Exercise and the immune system regulation, integration and adaptation. Physiol Rev. 2000;80(3):1055-81.
26. Bricks LF. Ferro e infecções. Atualização Pediat. (São Paulo). 1994;16(1):34-43.
27. Araújo CF, Moraes MS, Diniz AP, Cosendey AE. Pseudoanemia dilucional e os atletas olímpicos. Rev Bras Anal Clin. 2004;36(4):197-200.
28. Stewart IB, McKenzie DC. The human spleen during physiological stress. Sports Med. 32(6):361-9.
29. Torun B, Viteri FE. Inluence of exercise on linear growth. Eur J Clin Nutr. 1994;48(Suppl 1):S186-9.
30. The early history of the biochemistry of muscle contraction. J Gen Physiol. 2004;123(6):631-41.