Marina Campos AraujoI Ilana Nogueira BezerraI Flávia dos Santos BarbosaII Washington Leite JungerIII Edna Massae YokooIV Rosangela Alves Pereirav Rosely SichieriIII
I Programa de Pós-Graduação em Saúde
Coletiva. Departamento de Epidemiologia. Instituto de Medicina Social. Universidade do Estado do Rio de Janeiro. Rio de Janeiro, RJ, Brasil
II Departamento de Nutrição Social. Instituto
de Nutrição. Universidade do Estado do Rio de Janeiro. Rio de Janeiro, RJ, Brasil
III Departamento de Epidemiologia. Instituto
de Medicina Social. Universidade do Estado do Rio de Janeiro. Rio de Janeiro, RJ, Brasil
IV Departamento de Epidemiologia e
Bioestatística. Instituto de Saúde da Comunidade. Universidade Federal Fluminense. Niterói, RJ, Brasil
V Departamento de Nutrição Social Aplicada.
Instituto de Nutrição Josué de Castro. Universidade Federal do Rio de Janeiro. Rio de Janeiro, RJ, Brasil
Correspondence: Marina Campos Araujo
Instituto de Medicina Social – UERJ Rua São Francisco Xavier 524, 7º andar Sala E7002 Maracanã
20550-900 Rio de Janeiro, RJ, Brasil E-mail: [email protected] Received: 11/25/2011
Approved: 4/16/2012
Article available from: www.scielo.br/rsp
Macronutrient consumption
and inadequate micronutrient
intake in adults
ABSTRACT
OBJECTIVE: To estimate energy and nutrient intake and prevalence of inadequate micronutrient intake among Brazilian adults.
METHODS: Data from the National Dietary Survey, from the 2008-2009 Household Budget Survey, were used. Food consumption was evaluated through food record on two non-consecutive days. A total of 21,003 individuals (52.5% women), between 20-59 years old, participated in the survey. Usual nutrient intake was estimated according to the National Cancer Institute method. The Estimated Average Requirement (EAR) cut-off points were used to determine the prevalence of inadequate micronutrient intake. For manganese and potassium, the Adequate Intake (AI) was used as cut-off. Sodium intake was compared with the Tolerable Upper Intake Level (UL). The probability approach was used to determine the prevalence of inadequate iron intake. The data were analyzed according to the location of the household (urban or rural) and macro regions of Brazil.
RESULTS: The mean energy intake was 2,083 kcal among men and 1,698 kcal among women. Prevalence of inadequacy equal to or greater than 70% were observed for calcium among men and magnesium, vitamin A, and sodium among both men and women. Prevalence equal to or greater than 90% were found for calcium in women and vitamins D and E in both genders. Prevalence lower than 5% were found for iron in men and for niacin in men and women. In general, prevalence of inadequate intake was higher in the rural area and in the Northeast region.
CONCLUSIONS: Energy intake was higher among individuals who live in urban areas and in the North region. The greatest risk groups of inadequate micronutrient intake were women and those living in rural areas and in the Northeast region.
Assessing dietary intake is essential for guiding public policies in preventing both diseases resulting from deficiencies and chronic non-communicable diseases (NCD). In spite of this, Brazil did not have a regular nationwide survey evaluating individual food intake,24 the only example being the National Study on
Household Expenditure (Endef), carried out in 1970, which used the direct weighing of food to estimate dietary intake of Brazilian families.a
Combining the fi ndings of national studies on nutri-tional defi cienciesb with those on excess weight,c it
can be stated that Brazil faces a double burden of diseases originating in diet. Diseases caused by defi -ciency of specifi c micronutrients have been verifi ed; for example, the prevalence of anemia in children and non-pregnant women varies between 21% and 29% respectively and inadequate serum levels of vitamin A
vary between 17% and 12% respectively.b Moreover,
results of localized studies registered persistent iron defi ciency anemia in pre-school children in Ilha Bela (São Paulo, Southeastern Brazil),4 outbreaks of beriberi
in Maranhão19 and inadequate vitamin A,20,28 C,1,28 E25,28
and B1226 intake. What is more, documented levels
of obesity among Brazilians are high and increasing.c
Micronutrients play an important role in preventing diseases which have signifi cant impact in Brazil. For example, the anti-oxidant action of some vitamins can reduce the occurrence of NCD,3 excessive sodium intake
is associated with high blood pressure and the consequent increased risk of cardiovascular and renal disease13 and
vitamin D and calcium are also essential for healthy bones and reducing the risk of osteoperosis.14
The need and relevance of investigating food intake at a national level has been recognized and the most recent Household Budget Survey (POF), conducted in 2008-2009, included a module evaluating individual food intake in a representative sample of the Brazilian population, the National Dietary Survey.d
The aim of this study was to estimate energy and nutrient intake and the prevalence of inadequate micro-nutrient intake in Brazilian adults.
METHODS
Data from the National Dietary Survey, part of the Household Budget Survey, 2008-2009, conducted by IBGE (Brazilian Institute of Geography and Statistics)
INTRODUCTION
a Instituto Brasileiro de Geografi a e Estatística. Estudo Nacional da Despesa Familiar – dados preliminares. Brasília (DF); 1978.
b Ministério da Saúde. Pesquisa Nacional de Demografi a e Saúde da Criança e da Mulher – PNDS 2006: dimensões do processo reprodutivo e
da saúde da criança. Brasília (DF); 2009.
c Instituto Brasileiro de Geografi a e Estatística. Pesquisa de Orçamentos Familiares, 2008-2009. Antropometria e estado nutricional de
crianças, adolescentes e adultos no Brasil. Rio de Janeiro; 2010.
d Instituto Brasileiro de Geografi a e Estatística. Pesquisa de orçamentos familiares, 2008-2009. Análise do consumo alimentar pessoal no
Brasil. Rio de Janeiro; 2011.
were analyzed. Details on the sample and the data
collection have been published by the IBGE.d
POF 2008-2009 used a two-stage cluster sampling design. In the fi rst stage, census tracts were primary sampling units (PSU), which had been previously strati-fi ed according to location and mean income of the heads of households, were selected. The PSU were randomly selected with probability proportional to the number of households based on the 2000 Demographic Census. In the second stage, the sample units were permanent private households, selected using simple random sampling without replacement, from within PSU. All of the strata in the study were evaluated throughout the 12 months of the survey.d
In the 2008-2009 POF, 68,373 households were selected. A subsample for the INA was calculated at 25% of the households in the POF 2008-2009 sample and was organized so that one in every four households in each PSU was selected. In the data collection stage 16,764 households (24.5%) were sampled. There were 38,340 residents aged ten and over, in 13,569 households, who responded to the research, with a non-response rate of 19%. A total of 34,032 individuals completed the data on food and/or drink intake (11% non-response rate).
This analysis included all adult individuals aged between 20 and 59 years old, excluding pregnant and breast-feeding women (n = 1,065), totaling 21,003 individuals.
Food intake from food records on two non-consecutive days was estimated, in which individuals reported all food and drink consumed on the day in question, also recording the time, quantity in portion sizes, method of preparation as well as the source of the food (at home or away from home). There was also a question about sugar and/or sweetener consumption. When the subject was unable to complete the food record this could be done with the help of another member of the household or another nominated person.
the quantity consumed (106 portion sizes). At the end of the research, 1,120 food/drink items had been reported.
Partial analyses were carried out during data collection to control the quality.d
When verifying the reliability of the data, 29 individuals reporting fewer than fi ve items whose energy consump-tion seemed unlikely were excluded. In addiconsump-tion, quanti-ties considered to be unlikely were entered using the hot deck imputation procedure and this information was registered in the database.d
The addition of soya oil to all meat, fi sh and poultry dishes and to boiled and sautéed vegetables was taken into account. Moreover, the addition of 10 g of sugar (standardized) to every 100 ml of fruit juice, coffee, coffee and milk, tea and mate was taken into account when the subject reported using sugar as usual and 5 g of sugar for every 100 ml when the subject reported using both sugar and sweetener.
In order to estimate energy intake and macro- and micronutrient intake, tables of nutritional compositione
and portion sizesf compiled specifi cally for analyzing
the food items and dishes reported in the 2008-2009 POF were used. Data on nutrient intake represented only that from food and drink and did not include supplements and/or medicines.
The method used to estimate the mean and the distri-bution percentiles of usual nutrient intake from food
was developed by the National Cancer Institute(NCI).
The NCI method enables usual intake of food items consumed daily by the majority of individuals to be estimated, which is the case for many nutrients, as well as for less frequently consumed foods. In the case of frequently consumed foods and nutrients, the method takes into account only the quantities consumed on a specifi c day using the data described in the food records.27
In order to estimate usual intake of the variables which represent ratios: percentage of calories from protein, carbohydrates and lipids, an extension of the NCI method, based on a bivariate model, is used.5
The estimates of standard errors obtained using the NCI method are based on assumptions of the observations’ independence and equal distribution, i.e., the assump-tion that a simple random sample is being used. Such assumptions do not apply to the data obtained in a complex sample such as the POF. Thus, the standard errors were estimated using the balanced repeated repli-cation technique, with Fay’s modifi repli-cation (1989).15,g
The prevalence of inadequate micronutrient intake were estimated according to sex and age group, using the Estimated Average Requirements (EAR), as set by the Institute of Medicine (IOM) for the population of the United States and Canada8-10,12,14 as cutoff points. The
EAR represents mean necessity of the nutrient according to gender and stage of life. The prevalence of inadequate intake of each micronutrient was estimated by the propor-tion of individuals with intake below the EAR value.
The EAR can only be used to estimate prevalence of inadequate intake in the following conditions: (a) distribution of nutrient intake is independent of the requirement distribution; (b) symmetry of distribution in the nutrient requirement; and (c) lower variance in the distribution of nutrient requirement compared to the nutrient intake distribution. Thus, it is necessary to know the distribution of usual intake in the population
studied and the EAR for this method works.11
Because the distribution of iron requirement among women of reproductive age is skewed, the EAR cut-off
point method could not be used;11 therefore,
inad-equate iron intake was calculated using a probabilistic approach.12 To begin with, the 1st, 5th, 10th, 15th, 25th,
40th, 50th, 75th, 85th, 90th, 95th and 99th percentiles of
usual iron intake were estimated. Probability of inad-equate intake was associated to each percentile. These inadequacy probabilities are specifi ed to each interval of requirement intake of iron according to gender and
age group as recommended by the IOM12 (2001). The
prevalence of inadequate iron intake corresponds to the sum of the percentage of individuals with inadequate intake in each percentile.
For those nutrient for which an EAR has not been established, such as manganese12 and potassium,13 mean
intake were compared to values of adequate intake (AI), as it was not possible to estimate prevalence of inadequate intake.
As sodium intake in Brazil is excessively high,23 in
order to calculate excessive sodium intake, values above the Tolerable Upper Intake Level (UL) were
considered.13 The sodium assessed included both the
intrinsic to food items and the salt added to it.
Prevalence of inadequate intake were estimate according to regions (North, Northeast, Southeast, South and Midwest) and location of the households (urban or rural). When the cutoff points varied according to age group for the same nutrient, the weighted mean of the prevalence of inadequate intake was calculated.
e Instituto Brasileiro de Geografi a e Estatística. Pesquisa de orçamentos familiares, 2008-2009. Tabela de composição nutricional dos
alimentos consumidos no Brasil. Rio de Janeiro; 2011.
f Instituto Brasileiro de Geografi a e Estatística. Pesquisa de orçamentos familiares, 2008-2009. Tabela de medidas referidas para os alimentos
consumidos no Brasil. Rio de Janeiro; 2011.
g Fay RE. Theory and application of replicate weighting for variance calculations. In: Proceedings of the Survey Research Methods Section.
All of the estimates were calculated using Statistical Analysis System (SAS), version 9.1 software, taking into account expansion factors in the POF 2008-2009 and the complexity of the sample design.
The research protocol was approved by the Ethics Committee of the Instituto de Medicina Social of the Universidade do Estado do Rio de Janeiro (CAAE 0011.0.259.000-11).
RESULTS
The mean age of the adults studied was 37 years old (standard error [SE] = 0.13) and 52.5% were female. The highest mean of energy intake was observed among men and among individuals in the urban area. The North region had the highest mean energy intake, whereas the lowest for both men and women was in the Midwest region. From the point of view of diet quality, men consumed slightly more calories from protein than women; on the other hand, women reported more energy from carbohydrates. Energy from lipids was similar for both sexes (Table 1).
The highest rate of inadequate intake, for both men and women, were for vitamins E and D and calcium, and for excessive sodium intake. Excessive sodium intake was found in 89.3% of men and 70% of women, and
the highest levels of inadequate calcium intake were among women aged 51 to 59 (96.4%). The prevalence of inadequate intake of magnesium and vitamin A was greater than 70% for all groups studied (Table 2).
For both genders, the prevalence of inadequate micro-nutrient intake was more accentuated in rural areas than in urban areas, with the exception of magnesium and vitamin D and excessive sodium intake. The inadequacy of the phosphorous and iron intake among women in rural area was three to fi ve times higher, respectively, compared to inadequacy among men in the same area. It was also observed that in urban area inadequate iron intake was seven times higher in women than in men (Figure 1).
When the analysis was stratifi ed according to regions of the country, for both sexes, it was observed that the South was notable for inadequate magnesium intake, whereas the Northeast showed higher prevalence of inadequate zinc and iron, the latter especially among women (Figure 2).
Moreover, the South had the highest levels of inade-quate vitamin D intake for both sexes, and the Northeast and Midwest stood out for higher levels of inadequate thiamin intake. Lower rates of inadequate vitamin B12 intake were observed in the North and Midwest. The
Table 1. Mean and standard error (SE) of energy intake and percentage of energy provided by macronutrients according to sex,
location of household and region of the country. Brazil, 2008-2009. Male
Brazil Location of household Regions
(n = 9,974)
Urban (n = 7,441)
Rural (n = 2,533)
North (n = 1,593)
Northeast (n = 3,501)
Southeast (n = 2,191)
South (n = 1,298)
Midwest (n = 1,391)
Mean SE Mean SE Mean SE Mean SE Mean SE Mean SE Mean SE Mean SE
Energy (kcal)
2,083 12 2,009 10 1,742 9 2,222 18 2,144 15 2,070 14 1,994 10 1,920 10
Protein (% kcal)
17.4 0.1 17.2 0.1 18.3 0.1 17.6 0.2 17.3 0.1 16.6 0.1 15.9 0.1 17.0 0.2
Carbohydrate (% kcal)
54.4 0.3 54.2 0.3 55.3 0.2 53.7 0.4 55.3 0.2 54.2 0.5 54.5 0.3 52.7 0.2
Lipids (% kcal)
27.3 0.1 27.7 0.1 25.3 0.4 25.4 0.3 25.6 0.1 28.1 0.1 28.6 0.3 28.4 0.4
Female
Brazil Location of household Regions
(n = 11,029)
Urban (n = 8,757)
Rural (n = 2,272)
North (n = 1,579)
Northeast (n = 4,015)
Southeast (n = 2,442)
South (n = 1,390)
Midwest (n = 1,603)
Mean SE Mean SE Mean SE Mean SE Mean SE Mean SE Mean SE Mean SE
Energy (kcal)
1,698 7 1,873 6 1,620 11 1,850 9 1,784 7 1,712 7 1,652 10 1,586 8
Protein (% kcal)
16.8 0.1 16.7 0.1 17.5 0.2 17.7 0.2 17.3 0.1 16.7 0.1 15.9 0.1 17.0 0.2
Carbohydrate (% kcal)
55.8 0.2 55.7 0.2 56.5 0.3 55.5 0.4 56.1 0.2 55.5 0.2 56.7 0.3 55.6 0.3
Lipids (% kcal)
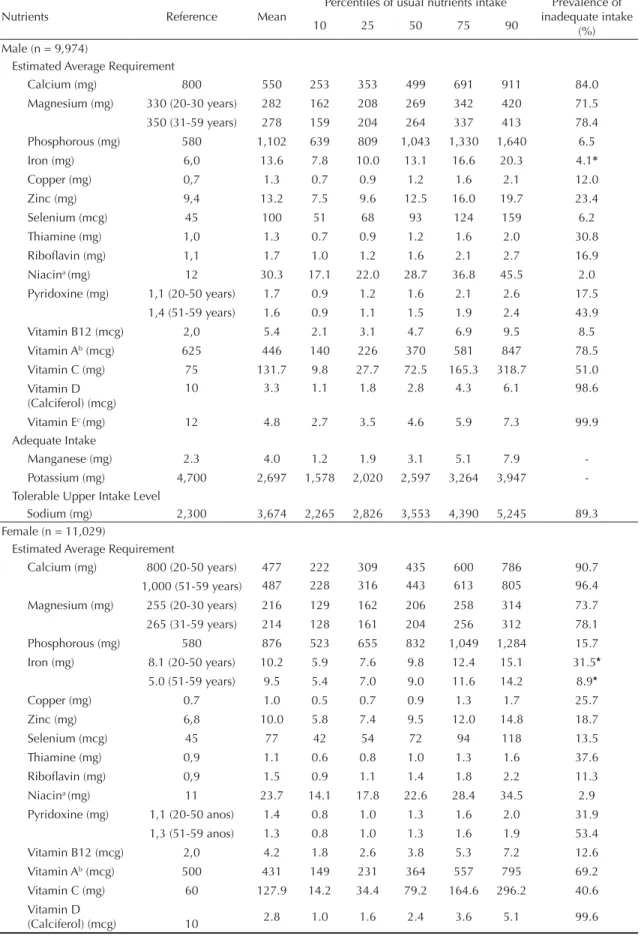
Table 2. Reference intake, mean, percentiles of usual intake distribution and prevalence of inadequate micronutrients intake according to sex. Brazil, 2008-2009.
Nutrients Reference Mean
Percentiles of usual nutrients intake Prevalence of inadequate intake
(%)
10 25 50 75 90
Male (n = 9,974)
Estimated Average Requirement
Calcium (mg) 800 550 253 353 499 691 911 84.0
Magnesium (mg) 330 (20-30 years) 282 162 208 269 342 420 71.5
350 (31-59 years) 278 159 204 264 337 413 78.4
Phosphorous (mg) 580 1,102 639 809 1,043 1,330 1,640 6.5
Iron (mg) 6,0 13.6 7.8 10.0 13.1 16.6 20.3 4.1*
Copper (mg) 0,7 1.3 0.7 0.9 1.2 1.6 2.1 12.0
Zinc (mg) 9,4 13.2 7.5 9.6 12.5 16.0 19.7 23.4
Selenium (mcg) 45 100 51 68 93 124 159 6.2
Thiamine (mg) 1,0 1.3 0.7 0.9 1.2 1.6 2.0 30.8
Ribofl avin (mg) 1,1 1.7 1.0 1.2 1.6 2.1 2.7 16.9
Niacina (mg) 12 30.3 17.1 22.0 28.7 36.8 45.5 2.0
Pyridoxine (mg) 1,1 (20-50 years) 1.7 0.9 1.2 1.6 2.1 2.6 17.5
1,4 (51-59 years) 1.6 0.9 1.1 1.5 1.9 2.4 43.9
Vitamin B12 (mcg) 2,0 5.4 2.1 3.1 4.7 6.9 9.5 8.5
Vitamin Ab (mcg) 625 446 140 226 370 581 847 78.5
Vitamin C (mg) 75 131.7 9.8 27.7 72.5 165.3 318.7 51.0
Vitamin D (Calciferol) (mcg)
10 3.3 1.1 1.8 2.8 4.3 6.1 98.6
Vitamin Ec (mg) 12 4.8 2.7 3.5 4.6 5.9 7.3 99.9
Adequate Intake
Manganese (mg) 2.3 4.0 1.2 1.9 3.1 5.1 7.9
-Potassium (mg) 4,700 2,697 1,578 2,020 2,597 3,264 3,947
-Tolerable Upper Intake Level
Sodium (mg) 2,300 3,674 2,265 2,826 3,553 4,390 5,245 89.3
Female (n = 11,029)
Estimated Average Requirement
Calcium (mg) 800 (20-50 years) 477 222 309 435 600 786 90.7
1,000 (51-59 years) 487 228 316 443 613 805 96.4
Magnesium (mg) 255 (20-30 years) 216 129 162 206 258 314 73.7
265 (31-59 years) 214 128 161 204 256 312 78.1
Phosphorous (mg) 580 876 523 655 832 1,049 1,284 15.7
Iron (mg) 8.1 (20-50 years) 10.2 5.9 7.6 9.8 12.4 15.1 31.5*
5.0 (51-59 years) 9.5 5.4 7.0 9.0 11.6 14.2 8.9*
Copper (mg) 0.7 1.0 0.5 0.7 0.9 1.3 1.7 25.7
Zinc (mg) 6,8 10.0 5.8 7.4 9.5 12.0 14.8 18.7
Selenium (mcg) 45 77 42 54 72 94 118 13.5
Thiamine (mg) 0,9 1.1 0.6 0.8 1.0 1.3 1.6 37.6
Ribofl avin (mg) 0,9 1.5 0.9 1.1 1.4 1.8 2.2 11.3
Niacina (mg) 11 23.7 14.1 17.8 22.6 28.4 34.5 2.9
Pyridoxine (mg) 1,1 (20-50 anos) 1.4 0.8 1.0 1.3 1.6 2.0 31.9
1,3 (51-59 anos) 1.3 0.8 1.0 1.3 1.6 1.9 53.4
Vitamin B12 (mcg) 2,0 4.2 1.8 2.6 3.8 5.3 7.2 12.6
Vitamin Ab (mcg) 500 431 149 231 364 557 795 69.2
Vitamin C (mg) 60 127.9 14.2 34.4 79.2 164.6 296.2 40.6
Vitamin D
(Calciferol) (mcg) 10 2.8 1.0 1.6 2.4 3.6 5.1 99.6
greatest discrepancy between regions was observed in vitamin B12 intake among women, with the prevalence of inadequate intake in women 4.3 times higher in the Southeast than in the North. The inadequate vitamin C intake among men was greater in the Southeast and the inadequacy of ribofl avin intake was high in the Midwest (Figure 3).
Despite the impossibility of estimating the inadequacy of manganese and potassium intake, it was observed that approximately 34.4% and 97% of men, respec-tively, had intakes below the reference value. Among women, the percentage of intake below the reference value was 33.5% for manganese and 99.7% for potas-sium. Similar results were observed regarding the location of the household. Considering the regions, the percentage of individuals below the reference value for manganese varied from 23% in the South to 48% in the North, for both sexes. The quantity of individuals with potassium intake below the reference values varied between 94% (North) and 97% (Northeast, Southeast and South) for men and, for women, these percentages were higher, approaching 100% (data not shown).
DISCUSSION
In the fi rst characterization of micronutrient intake in the adult Brazilian population, based on representative sample, we observed a high prevalence of inadequate intake of calcium, magnesium, vitamins E, D, A and C and excessive sodium intake in all regions, in both urban and rural areas.
The greatest difference observed between the sexes was in the prevalence of inadequate iron intake. Women’s higher requirements and the fact that men reported consuming more iron rich foods, such as red meat and legumes,d explain these marked differences.
When analyzed according to regions and locations of the households, it was verifi ed that, in rural areas, the rates of inadequate intake were almost 50% higher
than those in urban areas for both sexes for pyridoxine, ribofl avin, vitamin B12 and niacin and also for copper in men. In the rural areas, mean per capita daily intake of “traditional” Brazilian foods such as rice and beans was higher, whereas urban areas were notable for higher consumption of meat, poultry and meat derivatives,
as well as processed food and ready to eat meals.d
Moreover, energy intake in urban areas was 15% higher compared to rural areas, which may explain the higher rates of inadequate nutrient intake observed in rural areas. In Mexico, Barquera et al2 (2009) also observed
higher risk of inadequate intake in adults in rural areas.
Inadequate intake rates in the different regions of the country show the same trends as the overall national scenario. However, discrepancies between regions were observed for some nutrients, the greatest of these being for vitamin B12: inadequate intake among men in the Northeast and among women in the Southeast was around 75% higher than that observed among women and men in the North. The highest consumption of foods rich in this vitamin, such as fi sh, was observed in the North. This consumption was three times higher in the North than in the Northeast and almost eight times higher than in the Southeast.d
Vitamin D defi ciency has been associated with exac-erbating osteoporosis in adults and increased risk of death from cancer, cardiovascular disease and diabetes.7
However, it is known that the simplest way of obtaining the necessary quantity of vitamin D is moderate expo-sure to sunlight. Exposing the face, arms and hands or arms and legs to the sun for fi ve to ten minutes, twice to three times per week is suffi cient to not only to fulfi ll requirements but to build up a suffi cient stock of vitamin D in periods when exposure to the sun is
impossible.6 The EAR for vitamin D was set taking
into account the American population’s exposure to the sun, which is lower than in Brazil; therefore, the Brazilian population’s requirement for vitamin D may be overestimated.14
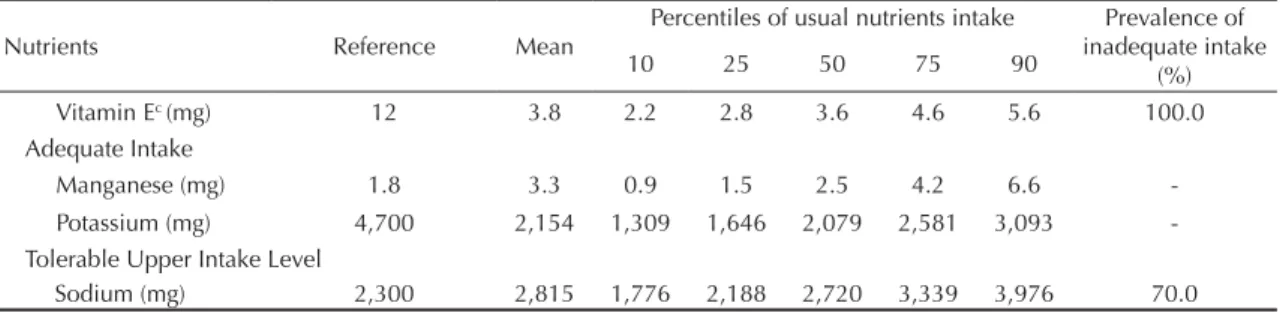
Table 2. Continuation.
Nutrients Reference Mean
Percentiles of usual nutrients intake Prevalence of inadequate intake
(%)
10 25 50 75 90
Vitamin Ec (mg) 12 3.8 2.2 2.8 3.6 4.6 5.6 100.0
Adequate Intake
Manganese (mg) 1.8 3.3 0.9 1.5 2.5 4.2 6.6
-Potassium (mg) 4,700 2,154 1,309 1,646 2,079 2,581 3,093
-Tolerable Upper Intake Level
Sodium (mg) 2,300 2,815 1,776 2,188 2,720 3,339 3,976 70.0
a Niacin equivalents
b Retinol activity equivalents c Total alpha-tocopherol
a Total alpha-tocopherol b Retinol activity equivalents
c Niacin equivalents
Figure 1. Prevalence of inadequate micronutrients intake according to sex and location of household. Brazil, 2008-2009.
Men (n = 9,974)
Vitamins
Vitamin Ea (mg) 99.9 100.0
99.5 100.0
99.4 99.8
92.4
77.9
96.8
68.0
82.2 78.5
50.0 39.8
55.8 47.4
29.7 36.1
35.7 46.3
19.1 32.6
31.6 50.0
23.3 21.0
7.2 10.7
12.9 20.6
15.6 9.7
Vitamin D (calciferol) (mcg)
Vitamin Ab (mcg)
Vitamin C (mg)
Thiamin (mg)
Pyridoxine (mg)
Riboflavin (mg)
Vitamin B12 (mcg)
1.8 2.3
2.8 6.4
Niacinc (mg)
100 100
(%) 90 80 70 60 50 40 30 20 10 0 10 20 30 40 50 60 70 80 90
Women (n = 11,029)
Urban Rural
Urban Rural
100 100
(%) 90 80 70 60 50 40 30 20 10 0 10 20 30 40 50 60 70 80 90
Men (n = 9,974)
Minerals
Calcium (mg) 85.583.6 91.393.9
89.4 70.4
88.6
78.4
67.3
78.3
65.3 68.6
22.7 17.7
25.8 23.8
11.0 24.5
16.6 32.8
6.4 15.1
6.7 20.0
6.9 16.6
4.0 27.5
5.1 28.4
5.6 12.7
Sodium (mg)
Magnesium (mg)
Zinc (mg)
Copper (mg)
Phoshporus (mg)
Selenium (mcg)
Iron (mg)
Females (n = 11,029)
0 100
(%) 5 10 15 20 25 30 35 40 45 50 55 60 65 70 75 80 85 90 95
Males (n = 9,974)
0 100
(%) 5 10 15 20 25 30 35 40 45 50 55 60 65 70 75 80 85 90 95
Southeast (n = 2,191) South (n = 1,298)
North (n = 1,593) Northeast (n = 3,501) Midwest (n = 1,391)
Calcium (mg)
Sodium (mg)
Magnesium (mg)
Zinc (mg)
Copper (mg)
Phosphorus (mg)
Selenium (mcg)
Iron (mg)
Calcium (mg)
Sodium (mg)
Magnesium (mg)
Zinc (mg)
Copper (mg)
Phosphorus (mg)
Selenium (mcg)
Iron (mg)
Southeast (n = 2,191) South (n = 1,298)
North (n = 1,593) Northeast (n = 3,501) Midwest (n = 1,391)
Females (n = 11,029)
0 100
(%) 5 10 15 20 25 30 35 40 45 50 55 60 65 70 75 80 85 90 95
Males (n = 9,974)
0 100
(%) 5 10 15 20 25 30 35 40 45 50 55 60 65 70 75 80 85 90 95
Vitamin Ea (mg)
Vitamin D (Calciferol) (mcg)
Vitamin Ab (mcg)
Vitamin C (mg)
Thiamin (mg)
Pyridoxine (mg)
Riboflavin (mcg)
Cobalamin (mcg)
Niacinc (mg)
Vitamin Ea (mg)
Vitamin D (Calciferol) (mcg)
Vitamin Ab (mcg)
Vitamin C (mg)
Thiamin (mg)
Pyridoxine (mg)
Riboflavin (mcg)
Cobalamin (mcg)
Niacinc (mg)
Southeast (n = 2,191) South (n = 1,298)
North (n = 1,593) Northeast (n = 3,501) Midwest (n = 1,391)
Southeast (n = 2,191) South (n = 1,298)
North (n = 1,593) Northeast (n = 3,501) Midwest (n = 1,391)
Figure 3. Prevalence of inadequate vitamins intake according to sex and region of the country. Brazil, 2008-2009.
a Total alpha-tocopherol b Retinol activity equivalent
Almost all of the individuals studied showed inadequate intake of vitamin E due to low levels consumption of nuts such as Brazilian nuts, peanuts, hazelnuts and almonds. The high inadequacy of vitamin A intake are also related to insuffi cient consumption of offals, yams, carrots, sweet potatoes and broccoli.d
As expected, men consumed almost 23% more calo-ries than women, irrespective of region or location of residence. Individuals living in urban areas and in the North region consumed approximately 15% and 16% more calories than those living in rural areas and in the Midwest region, respectively. Brazilian men, on average, consumed around 30% less energy than American men, and Brazilian women, on average,
10% less than their American counterparts.h However,
underestimation of intake in the American study was around 11%17 and 17% in the Brazilian study.d On the
other hand, energy intake in Brazilian men and women was around 6% and 10% higher, respectively, than that registered in Mexico2 and in the United Kingdom.29
Protein’s contribution to total calorie intake was similar in Brazil, the United Statesh and the United Kingdom.29
However, the proportion of lipids was higher in the
United Statesh and the United Kingdom29 and the
proportion of carbohydrates was higher in Brazil than in these two countries. The Mexicans consumed fewer calories derived from protein and more deriving from
carbohydrates compared to the Brazilians.2
With regards to nutrients with high rates of inadequate intake, the data presented are comparable those
described for North American adults.i However, the
magnitude of the inadequacy in Brazil was greater, for example, inadequate intake levels of vitamins E, A and C in Brazilian men were approximately 100%, 78% and 51%, whereas for American adult males they
were 90%, 55% and 40% respectively.i Moreover,
average intake of vitamins and minerals observed in American adults were higher than those estimated among Brazilians. Calcium and vitamin E intake were almost double among Americans compared to Brazilian men.h
Two other international population based studies with adults observed -prevalence of inadequate intake lower than those observed in Brazil. A Mexican study carried out in 2006 observed risk of inadequate vitamin A of 31.6% and 22.6% for men and women respectively; 25.6% and 18.4% for vitamin C; 17.2% and 23.5% for calcium; 12.8% and 8.6% for zinc; and 0.3% and 3.7% for iron.2 An investigation carried out in 2008-2009 in
adults in the United Kingdom verifi ed median intakes of calcium, magnesium, thiamin, vitamin B12, vitamin A and potassium above the medians observed among adults in Brazil. However, median intake of iron, zinc, ribofl avin and vitamin C and E were similar to those found among Brazilian adults.29
No individuals were excluded from this study for energy intake deemed unlikely. The inclusion of individuals who under-report energy intake could overestimate by up to 17% the prevalence of
inad-equacy.16 According to Poslusna et al (2009), 30% of
underestimated iron, calcium or vitamin C intake may be related to under reporting.21
On the other hand, the estimates of usual intake in the present study were based on appropriate statistical methods, adjusting distribution by intra-individual variability which removed extremes considered to be unlikely, for both over- and under-estimates of intake.18
The study design used allows estimation of population dietary consumption over a year, capturing seasonal variations in Brazilian’s eating habits.
The nutritional defi ciencies observed were not a result of insuffi cient quantities of food, as the main indicator of energy defi ciency, Body Mass Index (BMI) shows that only 2.7% of adult individuals were classes as underweight.c In fact, the results indicate a low density
of nutrients in food consumed. High levels of vitamin and mineral inadequacies may be corrected by improving the quality of the diet, including a higher proportion of cereals, legumes, fruit, vegetables, milk and dairy products and reducing the amount of highly processed food. It was verifi ed that mean per capita consumption of milk, milk based drinks and other milk derivatives did not exceed 100 g/ml per day, which explains the high levels if inadequate calcium intake. It was also observed that more than 90% of the Brazilian population consumed fewer fruit and vegetables that recommended, which also explains the high levels of inadequate vitamin C and magnesium intake and the large percentage of individuals with low potassium intake. In addition, processed foods have shown increasing participation of the Brazilian diet, which explains why more than 70% of adults have a sodium intake above the tolerable limit.d
The markedly inadequate intake of various micronutri-ents in adult Brazilians’ diets indicates that fortifying food is not the best way to solve this problem and indeed may aggravate it, as has been observed in the Canadian population, in which fortifying food with vitamins and minerals discouraged the adoption of healthy eating habits.22
h United States. Department of Agriculture. Agricultural Research Service. Nutrient Intakes from Food: mean amounts consumed per
individual, by gender and age. What we eat in American. NHANES 2007-2008. Washington, United States. Washington (DC); 2010. Available from: www.ars.usda.gov/ba/bhnrc/fsrg
i Moshfegh A, Goldman J, Cleveland L. What we eat in America. NHANES 2001-2002: Usual nutrient intakes from food compared to dietary
The present study identifi ed that individuals living in urban areas and in the North region had higher energy intake. Important inadequate micronutrients intake were verifi ed among Brazilian adults, with those most at risk being women and individuals living in rural areas and in the Northeast region.
1. Azevedo L, Martino HSD, Carvalho FG, Rezende ML. Estimativa da ingestão de ferro e vitamina C em adolescentes no ciclo menstrual. Cienc Saude Coletiva. 2010;15(Supl 1):1359-67. DOI:10.1590/S1413-81232010000700045
2. Barquera S, Hernández-Barrera L, Campos-Nonato I, Espinosa J, Flores M, Barriguete JA, et al. Energy and nutrient consumption in adults: Analysis of the Mexican National Health and Nutrition Survey 2006. Salud Publica Mex. 2009;51Supll 4:S562-73. DOI:10.1590/S0036-36342009001000011
3. Chong-Han K. Dietary Lipophilic Antioxidants: Implications and Signifi cance in the Aging Process. Crit Rev Food Sci Nutr. 2010;5(10):931-7. DOI:10.1080/10408390903044073
4. Costa JT, Bracco MM, Gomes PAP, Gurgel RQ. Prevalência de anemia em pré-escolares e resposta ao tratamento com suplementação de ferro. J Pediatr. 2011;87(1):76-9. DOI:10.2223/JPED.2049
5. Freedman LS, Guenther PM, Dodd KW, Krebs-Smith SM, Midthune D. The population distribution of ratios of usual intakes of dietary components that are consumed every day can be estimated from repeated 24-hour recalls. J Nutr. 2010;140(1):111-16. DOI:10.3945/jn.109.110254
6. Holick MF. Sunlight and vitamin D for bone health and prevention of autoimmune diseases, cancers, and cardiovascular disease. Am J Clin Nutr. 2004;80(6 Suppl):1678-88.
7. Holick MF. Vitamin D: importance in the prevention of cancers, type 1 diabetes, heart disease, and osteoporosis. Am J Clin Nutr. 2004; 79(3):362-71. Erratum in: Am J Clin Nutr. 2004;79(5):890.
8. Institute of Medicine, Food and Nutrition Board (US). Dietary reference intakes for Calcium, Phosphorus, Magnesium, Vitamin D, and Fluoride. Washington (DC): National Academy Press; 1997.
9. Institute of Medicine, Food and Nutrition Board (US). Dietary reference intakes for Thiamin, Ribofl avin, Niacin, Vitamin B6, Folate, Vitamin B12, Pantothenic Acid, Biotin, and Choline. Washington (DC): National Academy Press; 1998.
10. Institute of Medicine, Food and Nutrition Board (US). Dietary reference intakes for Vitamin C, Vitamin E, Selenium, and Carotenoids. Washington (DC): National Academy Press; 2000.
11. Institute of Medicine, Food and Nutrition Board (US). Dietary reference intakes: applications in dietary assessment. Washington (DC): National Academy Press; 2000.
12. Institute of Medicine, Food and Nutrition Board (US). Dietary reference intakes for Vitamin A, Vitamin K, Arsenic, Boron, Chromium, Copper, Iodine, Iron, Manganese, Molybdenum, Nickel, Silicon, Vanadium, and Zinc. Washington (DC): National Academy Press; 2001.
13. Institute of Medicine, Food and Nutrition Board (US). Dietary Reference Intakes for Water, Potassium, Sodium, Chloride, Sulfate. Washington (DC): National Academy Press; 2004.
14. Institute of Medicine, Food and Nutrition Board (US). Dietary Reference Intakes for Calcium and Vitamin D. Washington (DC): National Academy Press; 2010.
15. Korn EL, Graubard BI. Analysis of Health Surveys. New York: John Wiley and Sons; 1999.
16. Lauzon B, Volatier JL, Martin A. A Monte Carlo simulation to validate the EAR cut-point method for assessing the prevalence of nutrient inadequacy at the population Level. Public Health Nutr. 2004;7(7):893-900. DOI:10.1079/PHN2004616
17. Moshfegh AJ, Rhodes DG, Baer DJ, Murayi T, Clemens JC, Rumpler WV, et al. The US Department of Agriculture Automated Multiple-Pass Method reduces bias in the collection of energy intakes. Am J Clin Nutr. 2008;88(2):324-32.
18. Murphy SP, Barr SI. Practice paper of the American Dietetic Association: using the dietary reference intakes. J Am Diet Assoc. 2011;111(5):762-70. DOI:10.1016/j.jada.2011.03.022
19. Padilha EM, Fujimori E, Borges ALV, Sato APS, Gomes MN, Branco MRFC, et al. Perfil epidemiológico do beribéri notificado de 2006 a 2008 no Estado do Maranhão, Brasil. Cad Saude Publica. 2011;27(3):449-59. DOI:10.1590/S0102-311X2011000300006
20. Peres WAF, Chaves GV, Gonçalves JCS, Ramalho A, Coelho HSM. Vitamin A defi ciency in patients with hepatitis C virus-related chronic liver disease. Br J Nutr. 2011;106(11):1724-31. DOI:10.1017/S0007114511002145
21. Poslusna K, Ruprich J, Vries JHM de, Jakubikova M, van’t Veer P. Misreporting of energy and micronutrient intake estimated by food records and 24hour recalls, control and adjustment methods in practice. Br J Nutr. 2009;101(Supll 2):73-85. DOI:10.1017/S0007114509990602
22. Sacco JE, Tarasuk V. Discretionary addition of vitamins and minerals to foods: implications for healthy eating. Eur J Clin Nutr. 2011;65(3):313-20. DOI:10.1038/ejcn.2010.261
Financed by the Ministério da Saúde (General Coordination of Food and Nutrition) and by PhD fellowships from: the Fundação de Amparo à Pesquisa of the Estado do Rio de Janeiro – Faperj (Ilana N Bezerra); by the Coordenação de Aperfeiçoamento de Pessoal de Nível Superior – Capes (Marina C Araujo); and Conselho Nacional de Desenvolvimento Científi co e Tecnológico – CNPq (Flávia S Barbosa).
The authors declare that there are no confl icts of interest.
This manuscript was submitted for publication and underwent a peer review process as any other manuscripts submitted to this publication, and anonymity was guaranteed for authors and reviewers. Editors and reviewers declare no confl icts of interest that may affect the peer-review process.
23. Sarno F, Claro RM, Levy RB, Bandoni DH, Ferreira SRG, Monteiro CA. Estimated sodium intake by the Brazilian population, 2002-2003. Rev Saude Publica. 2009;43(2):219-25. DOI:10.1590/S0034-89102009005000002
24. Schmidt MI, Duncan BB, Silva GA, Menezes AM, Monteiro CA, Barreto SM, et al. Doenças crônicas não transmissíveis no Brasil: carga e desafi os atuais. Lancet. 2011;377(9781):1949-61. DOI:10.1016/S0140-6736(11)60135-9
25. Silva JVL, Timóteo AKCD, Santos CD, Fontes G, Rocha EMM. Consumo alimentar de crianças e adolescentes residentes em uma área de invasão em Maceió, Alagoas, Brasil. Rev Bras Epidemiol. 2010;13(1):83-93. DOI:10.1590/S1415-790X2010000100008
26. Steluti J, Martini LA, Peters BS, Marchioni DM. Folate, vitamin B6 and vitamin B12 in adolescence: serum concentrations, prevalence of inadequate intakes and sources in food. J Pediatr. 2011;87(1):43-9. DOI:10.2223/JPED.2056
27. Tooze JA, Midthune D, Dodd KW, Freedman LS, Krebs-Smith SM, Subar AF, et al. A new statistical method for estimating the usual intake of episodically consumed foods with application to their
distribution. J Am Diet Assoc. 2006;106(10):1575-87. DOI:10.1016/j.jada.2006.07.003
28. Verly Jr E, Cesar CLG, Fisberg RM, Marchioni DML. Socio-economic variables infl uence the prevalence of inadequate nutrient intake in Brazilian adolescents: results from a population-based survey. Public Health Nutr. 2011;14(9):1533-8. DOI:10.1017/S1368980011000760