Raúl Andrés Mendoza-Sassi Juraci Almeida Cesar Patricia Rodrigues da Silva Giovana Denardin
Mariana Mendes Rodrigues
Divisão População e Saúde. Faculdade de Medicina. Universidade Federal do Rio Grande. Rio Grande, RS, Brasil
Correspondence:
Raúl Andrés Mendoza-Sassi R. General Osório, s/n Campus Saúde
96200-400 Rio Grande, RS, Brasil E-mail: [email protected] Received: 11/10/2008 Revised: 6/9/2009 Approved: 8/7/2009
Risk factors for cesarean
section by category of
health service
Fatores de risco para cesárea
segundo tipo de serviço
ABSTRACT
OBJECTIVE: To analyze the rate of cesarean section and differences in risk factors by category of health service, either public or private.
METHODS: A cross-sectional study was carried out including all pregnant women in labor admitted to hospitals in the city of Rio Grande, Southern Brazil, between January 1 and December 31, 2007. A coded and pre-tested questionnaire was used to collect on social, demographic, obstetric and newborn care information. Two regression models were constructed: one for public users and the other one for private ones. Poisson regression was used in each model in the multivariate analysis. Prevalence rates and 95% confi dence intervals were calculated for each adjusted factor.
RESULTS: The rate of cesarean section was 43% and 86% among public and private users. Sociodemographic factors and twin births have a more signifi cant impact among public users as well as number of pregnancies (25% vs. 13% reduction in public and private users, respectively) and previous cesarean section (86% vs. 24% increase in public and private users, respectively). Prenatal care visits and hospital admissions affected the outcome only in women users of public services.
CONCLUSIONS: Cesarean section rates were high in both groups studied, but it was twice as high among women cared in the private sector. Associated factors differ in magnitude by category of service used.
Cesarean section (C-section) rates have continuously increased over recent decades. This phenomenon has occurred in developed countries14,15 as well as in Latin
America,23 including Brazil.2 In Brazil, cesarean rates
have grown from 15% in the 1970s to 43% in 2005, way higher than 15% recommended by the World Health Organization (WHO).
Some of the reasons associated with this high rate are related to health service characteristics.22,25 A recent
study of the Brazilian National Supplemental Health Agency (ANS, which regulates private insurance) reported that cesarean section rates among
privately-insured women were as high as 80% in 2006a while
it is was 26% in the public Brazilian National Health System (SUS),b a rate that is high but closer to that
recommended.
Although the same surgical procedure is performed – and sometimes they are performed by the same doctors
RESUMO
OBJETIVO: Analisar a taxa de cesárea e fatores associados à sua ocorrência segundo serviço de saúde utilizado, público ou privado.
MÉTODOS: Foi realizado estudo transversal entre 1º de janeiro e 31 de dezembro de 2007 com todas as gestantes que deram à luz nos hospitais da cidade de Rio Grande, RS. As gestantes foram entrevistadas, utilizando-se um questionário testado e pré-codifi cado com questões sociodemográfi cas, obstétricas e relacionadas ao recém-nascido. Foram desenvolvidos dois modelos de predição, um para as gestantes internadas pelo Sistema Único de Saúde (público) e outro para as gestantes internadas em serviços privados. Em cada modelo foi realizada uma análise multivariada utilizando a regressão de Poisson, calculando-se as razões de prevalência e seus respectivos intervalos com 95% de confi ança.
RESULTADOS: A taxa de cesárea para o grupo público foi 43% enquanto
no grupo privado foi 86%. Os fatores sociodemográfi cos e o parto gemelar
foram mais importantes no modelo público, assim como o número gravidezes (redução de 25% vs. 13% no grupo privado) e cesárea prévia (incremento de 86% vs. 24% no privado). Consultas de pré-natal e internações afetaram o desfecho somente no grupo público.
CONCLUSÕES: As taxas de cesárea foram elevadas nos dois grupos, sendo o dobro no serviço privado. Os fatores de risco são diferentes em magnitude, segundo o tipo de gestante.
DESCRITORES: Cesárea. Fatores de Risco. Fatores Socioeconômicos. Sistemas Pré-Pagos de Saúde. Saúde Suplementar. Sistema Único de Saúde. Estudos Transversais.
INTRODUCTION
and in the same health facilities – there is a difference between public and private systems that is more related to women’s characteristics (for example, sociodemogra-phic and obstetric factors) and medical practice rather than to established technical guidelines.17,19
It is essential to understand the differences in associated factors for C-section between categories of health service. Most research has focused on associated factors in public services users or addressed this issue consi-dering together women from both public and private health services. There is little information about risk factors for cesarean section in the private sector and differences between public and private services.
The objective of the present study was to analyze cesa-rean rates and differences of factors associated between public and private health services.
a Agência Nacional de Saúde Suplementar. Parto Normal. Movimento ANS em favor do parto normal e da redução das cesarianas desnecessárias no setor suplementar. Rio de Janeiro; 2007 [cited 2008 May 07]. Available from: http://www.ans.gov.br/portal/upload/ biblioteca/carta_parto_normal.pdf
METHODS
A cross-sectional was carried out in all public or private hospitals in the city of Rio Grande, Southern Brazil, between January 1 and December 31, 2007. The sample included all women in labor living in the city who delivered at least one child weighting ≥500 g with a gestational age ≥20 weeks.
The study was part of a larger study designed to analyze perinatal care in the city and included all women (2,591) who delivered during the aforementioned period. At the end of the study, 2,557 subjects were recruited (1.3% loss). Of 34 losses, one refused to participate and the rest were not found (most of them were private care users) after many attempts. With this sample size, the study had a statistical power of 90% or higher for identi-fying signifi cant associations according to the following parameters: 95% confi dence level; relative risk of two or more; non-exposed to exposed ratio from 1:1 to 10:1 and a cesarean section rate in non-exposed of 10% or higher. In the fi nal sample, 2,023 (79.1%) women were users of public and 534 (20.9%) of private services.
Mothers were interviewed within 24 hours after delivery. A team consisting of ten previously trained interviewers applied a pre-coded and pre-tested questio-nnaire. The questionnaire collected sociodemographic information, past and current obstetric history, morbi-dities during pregnancy, and newborn characteristics. Ten percent of the subjects were re-interviewed after hospital discharge for quality control.
The outcome of interest was type of delivery (cesarean section or vaginal delivery), which was categorized according to health service (public-SUS or private). Information was collected in the interviews and from medical records. Independent variables analyzed were: a) sociodemographic: age, skin color, education, per capita family income and living with a partner; b) past obstetric history: number of pregnancies and number of previous cesarean sections; c) current obstetric history: planned pregnancy, number of prenatal care visits, prenatal care provided by the same doctor, prenatal care facility, number of ultrasonographies, high blood pressure, diabetes, urinary infection, bleeding in the last gestational trimester, work during last gestational trimester, number of hospital admissions; c) delivery and newborn characteristics: number of newborns, newborn’s gender, weight, and head circumference.
Data was entered twice and independently using Epi Info 6.04 software. After correction of amplitude or consistency errors, data was analyzed using Stata 9.2 software. Two models were constructed according to category of health service, one for women users of the public sector and the other one for private sector users. The sample characteristics and cesarean rates were calculated and compared. In the bivariate analysis prevalence ratios (PR) and 95% confi dence intervals
(95% CI) for cesarean section and independent varia-bles in each model were estimated. A multivariate analysis was carried out using Poisson regression with robust confi dence intervals and a four-level hierarchical analysis model.24 The fi rst level included
sociodemogra-phic variables; the second level, past obstetric history; the third level included current obstetric history; and the fourth level, newborn and delivery characteristics. At each level, all variables were included and those with a p-value ≤0.20 were retained and adjusted for the next level, using backward stepwise regression. PR and 95% CI were estimated at each level and statistical signifi -cance was assessed using the Wald test. When ordinal variables had three or more categories and a trend was observed, a linear trend test was performed. When no trend was detected, a heterogeneity test was used. A p-value of 0.05 or less for a two-tail test was specifi ed for all statistical analysis. The analyses were carried out in the same manner and with the same variables for both models (public and private).
The study was approved by the Research Ethics Committee of Universidade do Rio Grande.
RESULTS
The cesarean section rate was 51.6% in the entire sample; 42.6% among public (SUS) users and 85.8% among private users.
Table 1 shows the sample characteristics for the two models. Compared to private users, public users were younger, less educated, had lower per capita family income, and a higher proportion of women with black/ other skin color and not living with a partner was seen. Public users had a larger number of previous pregnancies and cesarean rates. The proportion of women attending prenatal care was similar between both groups (94.7% vs. 99.8%), but mean number of visits was higher among private users (10.2 vs. 6.5). Privately-insured women had twice as many ultrasonographies (5.3 vs. 2.5). Half of public users were provided prenatal care in primary care facilities, while most of private users attended a physician’s private offi ce. There was a higher preva-lence of morbidities and hospital admissions during pregnancy among users of public services.
No signifi cant differences were found between newborn weight (public: mean 3,198 g, SD 567; private: 3,185, SD 494; p=0.6) and premature birth rate (public: 17.3%; private: 13.5%; p=0.06). Head circumference (p=0.04) was statistically signifi cant though slightly different between children delivered in public (mean 34.36 cm, SD 2.14) and private services (mean 34.57, SD 1.82).
Table 1. Sample characteristics per category of health service. Rio Grande, Southern Brazil, 2008. (N=2,557)
Variable Public service (n=2023) Private service (n=534) p
% n % n
Age (years)
15 to 19 23.4 474 7.9 42 0.001a
20 to 24 30.2 412 19.8 106
25 to 29 22.4 453 32.8 175
30 or + 23.9 484 39.5 211
Skin color
White 66.4 1343 81.5 435 0.001a
Black/other 33.6 680 18.5 99
Living with a partner
No 19.7 398 7.9 42 0.001a
Yes 80.3 1625 92.1 492
Education
0 to 4 15.3 310 2.2 12 0.001a
5 to 8 42.8 466 10.7 57
9 to 11 38.8 784 53.8 287
12 or + 3.1 63 33.3 178
Income (minimum wages)
0 to ½ 49.5 1001 5.4 29 0.001a
+ ½ to 1 31.5 638 21.7 116
+ than 1 19.0 384 72.9 389
Number of pregnancies
1 37.7 762 46.3 247 0.001a
2 26.5 536 30.9 165
3 14.9 302 15.5 83
4 11.0 223 6.2 33
5 or + 9.9 200 1.1 6
Previous C-section
No 69.4 1389 54.1 287 0.001a
Yes 30.6 612 45.9 244
Pre-natal care
No 5.3 107 0.2 1 0.001a
Yes 94.7 1916 99.8 533
Pre-natal visits (mean and SD) 6.6 3,54 10.2 3.40 0.001b
Ultrasonography (mean and SD) 2.5 2.33 5.3 3.21 0.001b
Pre-natal care facility
Primary care 51.0 978 4.7 25 0.001a
Hospital outpatient clinic 25.1 480 1.9 10
Physician’s private offi ce 23.9 458 93.4 498
Pre-natal with same doctor
No 27.8 533 7.9 42 0.001a
Yes 72.2 1874 92.1 491
High blood pressure
No 81.1 1636 85.0 454 0.04a
Yes 18.9 381 15.0 80
Some similarities were found regarding obstetric factors, but public service had always higher PR. Except for high blood pressure, which was signifi cant in both groups, other morbidities were risk factors only among public users. In regard to newborn factors, only head circumference was associated with the outcome in both models; on the other hand, multiple birth and weight was signifi cant only among public users.
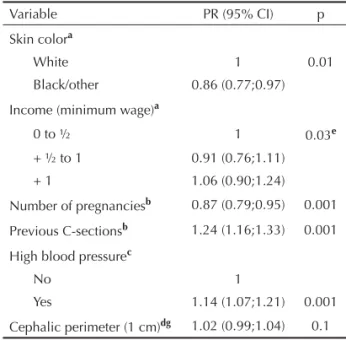
Adjusted PRs for public and private users are described in Table 3 and 4, respectively. Even after adjustment, almost all sociodemographic factors remained signifi -cant in the public model, including education and per capita family income (with a linear trend). In the private model, only skin color (with reduction of cesarean section among black women) and income remained signifi cant, but with small effects. In the second level of analysis, the number of previous pregnancies and cesarean sections remained risk factors in both models. However, the magnitude of the effect was greater in the public model (25% vs. 13% reduction for pregnancy and 86% vs. 24% increase for previous cesarean section among public and private users, respectively). For the third level of analysis, risk factors were only signifi cant
in the public model, except for high blood pressure, which was signifi cant only among private users. Every prenatal care visit among public users increased the risk of cesarean delivery by 4% and every hospital admis-sion produced a 12% increase in risk. In the fourth level of analysis, the association of head circumference and twin birth remained only in the public model.
DISCUSSION
In the present study cesarean section rate in the city of Rio Grande in 2007 was 52%; 43% and 86% among public and private users. Although a few similarities were identified between public and private health services regarding risk factors for cesarean delivery, the number of risk factors and the magnitude of the observed effects were different. In the public group, older age, living with a partner, higher education and income, previous cesarean, more prenatal care visits and hospital admissions, twin birth, and head circumfe-rence were all positively associated with the outcome; previous pregnancy had a negative association. For the private group, higher income, previous cesarean and high blood pressure had a direct association with Table 1 continuation
Variable Public service (n=2023) Private service (n=534) p
% n % n
Diabetes
No 97.0 1953 97.4 520 0.7a
Yes 3.0 60 2.6 14
Bleeding in 3rd trimester of pregnancy
No 92.1 1862 95.3 509 0.01a
Yes 7.9 160 4.7 25
Urinary infection
No 60.3 1211 73.9 394 0.001a
Yes 39.7 798 26.1 139
Hospital admission
No 84.9 1716 93.1 497 0.001a
Yes 15.1 306 6.9 37
Working during 3rd trimester
No 76.1 1516 57.1 305 0.001a
Yes 23.9 477 42.9 229
Planned pregnancy
No 61.3 1241 41.0 219 0.001a
Yes 38.7 782 59.0 315
Twin birth
No 98.7 1997 98.5 526 0.7a
Yes 1.3 26 1.5 8
aChi-square test
Table 2. Crude prevalence ratios for cesarean sections and factors studied in public and private hospital health services. Rio Grande, Southern Brazil, 2008. (N=2,557)
Variable Public service (n=2,023) p Private service (n=534) p
PR (95% CI) PR (95% CI)
Age group
15 to 19 1 0.006a 1 0,12a
20 to 24 1.13 (0.97;1.32) 0.95 (0.80;1.12)
25 to 29 1.36 (1.17;1.59) 1.03 (0.89;1.19)
30 or + 1.21 (1.04;1.42) 1.07 (0.93;1.24)
Skin color
White 1 0.006 1 0.006
Black/other 0.86 (0.77;0.97) 0.87 (0.75;0.95)
Living with a partner
No 1 0.002 1 0.25
Yes 1.26 (1.09;1.46) 1.09 (0.94;1.29)
Education
0 to 4 1 0.001b 1 0.002b
5 to 8 0.97 (0,83;1.15) 1.01 (0.70;1.44)
9 to 11 1.28 (1.09;1.50) 1.15 (0.82;1.60)
12 or + 1.36 (1.04;1.80) 1.19 (0.86;1.66)
Income (min. wage)
0 to ½ 1 0.001b 1 0.01a
+ ½ to 1 1.17 (1.04;1.32) 0.92 (0.75;1.11)
+ 1 1.37 (1.21;1.55) 1.07 (0.91;1.27)
Number of pregnancies 0.94 (0.91;0.98) 0.001 0.99 (0.96;1.03) 0.7
C-sections 1.56 (1.51;1.61) 0.001 1.12 (1.09;1.13) 0.001
Pre-natal care visit 1.06 (1.05;1.07) 0.001 1.01(1.002;1.02) 0.02
Ultrasonography 1.06 (1.05;1.08) 0.001 1,01 (0.99;1.02) 0.06
Hospital admissions 1.17 (1.11;1.23) 0.001 1.01 (0.90;1.12) 0.9
Pre-natal care facility
Primary care 1 0.001b 1 0.8a
Hospital outpatient clinic 1.30 (1.15;1.46) 0.95 (0.67;1.36)
Physician’s private offi ce 1.38 (1.22;1.55) 1.02 (0.86;1.22)
Pre-natal with same doctor
No 1 0.02 1 0.4
Yes 0.88 (0.79;0.98) 1.06 (0.92;1.24)
High blood pressure
No 1 0.001 1 0.001
Yes 1.30 (1.17;1.46) 1.15 (1.08;1.22)
Diabetes
No 1 0.03 1 0.3
Yes 1.31 (1.03;1.65) 1.09 (0.93;1.26)
Bleeding in 3rd trimester
No 1 0.009 1 0.7
Yes 0.73 (0.58;0.93) 1,03 (0.88;1.19)
Working during 3rd trimester
No 1 0.002 1 0.5
Yes 1.19 (1.06;1.33) 1,02 (0.96;1.10)
cesarean delivery, while black skin color and previous pregnancy were inversely associated.
With respect to methodological limitations, it should be discussed the study design. It is known that cross-sectional studies are weak for establishing causal relationship. But in this case, where the outcome (a surgical procedure) is preceeded by the risk factors studied, the direction of causality does not seem to be a problem. Another potential methodological issue is the number of losses, but as they were slightly higher than 1%, it is very unlikely it could have affected the results. Some of the non-signifi cant associations could be attributed to a lack of statistical power. Although the sample size initially studied had a good power, when constructing the two models, it may have been reduced due to losses. This would particularly affect the private model, which had a smaller number of observations. However, those associations that were not signifi cant, or those that lost signifi cance after adjustment, showed in most situations very small effects and narrow CI, which somehow minimized the problem.
The cesarean section rate in the entire sample was high and way off that recommended by WHO. It is even
higher than that reported nationwide (43% in 2005)a
and in the neighbor city of Pelotas (45% in 2004).5
However, it shows a rising trend which must be taken into consideration.
Comparison of both models showed relevant issues regarding the factors studied as well as the risk magnitude. Both groups of users had high cesarean section rates, but the rates was twice as high as among private than public users and closer to that reported by ANS in 2006 (80%). Further studies are needed to
explore the reasons why four out of fi ve women in
private services and four out of ten in the public ones underwent surgical delivery instead of normal vaginal
delivery, but it is certainly has other explanation than that of technical indications.
Another major issue is sociodemographic differences. Other studies have identifi ed them as risk factors,6-8,10
and in the present study this was seen in the public model, except for skin color. As in other child or mother outcomes,13 better-off women are more likely
to have a cesarean section. Those living with a partner also had higher risk of cesarean delivery. This fi nding may be explained by a will to preserve their sexual function.9,27 Among private users, the socioeconomic
factors that remained in the model were income and skin color. With respect to income, although there was a difference, it was small as expected since women in this group are more affl uent. The negative association between cesarean delivery and skin color has been described in other studies,10,21 and for other child and
mother outcomes,3,13,20 and is explained by poor quality
of prenatal care and socioeconomic disadvantages. However, it should be noted that it remains a factor in the model that exclusively analyzed the private sector, even after adjustment for income. In addition, when those who attended six or more prenatal care visits in the private sector were analyzed, no signifi cant difference was found between non-white and white women (94.8 vs. 97%, p=0.3). Therefore, we can assume that other factors may have affected the lower number of cesareans among non-white women users of private services.
Additional issues associated to cesarean sections are obstetric and newborn factors, which were also iden-tifi ed in other studies6,10,11,22 as major determinant of
cesarean section rate in both groups. However, there were differences according to the category of health service. It was clear for prenatal care. Every visit in the public sector increased the risk of cesarean by 4%, even after adjusting for prenatal care with the same physician (which was not signifi cant), while in the private group Table 2 continuation
Variable Public service (n=2,023) p Private service (n=534) p
PR (95% CI) PR (95% CI)
Planned pregnancy
No 1 0.001 1 0.8
Yes 1.18 (1.07;1.31) 1.01 (0.94;1.08)
Twin birth
No 1 0,001 1 0.5
Yes 2.01 (1.70;2.40) 0.87 (0.58;1.30)
Newborn weight (100 grams) 1.02 (1.01;1.03) 0.001 1.005 (0.99;1.01) 0.2
Head circumference (each 1cm) 1.07 (1.04;1.09) 0.001 1.03 (1.01;1.05) 0.01
a Heterogeneity Test
b Linear trend test
it had no effect at all. If one considers all efforts that are made to ensure pregnant women adequate number of prenatal care visits, it is a paradoxical that more care can lead to a higher risk of cesarean section, thereby increasing the likelihood of negative outcomes for the
child and the mother.26 One of the explanations for
this association would be that women with high-risk pregnancies have more prenatal care visits, and there-fore have higher cesarean section rate. Although this is true, it cannot explain by itself the high rate of cesarean
Table 3. Adjusted prevalence ratios and 95% CI for cesarean sections in the public health sector. Rio Grande, Southern Brazil, 2008.
Variable PR (95% CI) P
Agea(years)
15 to 19 1 0.04e
20 to 24 1.04 (0.89;1.22)
25 to 29 1.23 (1.05;1.44)
30 or + 1.12 (0.95;1.31)
Living with a partnera
No 1 0.03e
Yes 1.18 (1.03;1.37)
Schoolinga
0 to 4 1 0.006e
5 to 8 0.99 (0.84;1.18)
9 to 11 1.21 (1.02;1.44)
12 or + 1.18 (0.89;1.57)
Skin colora
White 1 0.08
Black/other 0.90 (0.80;1.01)
Income (min. wage)a
0 to ½ 1 0.01f
+ ½ to 1 1.08 (0.95;1.22)
+ 1 1.19 (1.04;1.37)
Number of pregnanciesb 0.75 (0.70;0.81) 0.001
Previous C-sectionsb 1.86 (1.77;1.95) 0.001
Pre-natal care visitsc 1.04 (1.02;1.05) 0.001
Hospital admissionsc 1.12 (1.05;1.19) 0.001
Pre-natal care facilityc
Primary care 1 0.02e
Hospital outpatient clinic 1.16 (1.04;1.30)
Physician’s private offi ce 1.11 (0.99;1.25)
Twin birthdg
No 1 0.001
Yes 1.73 (1.33;2.26)
Head circumference (each 1 cm)dg 1.04 (1.02;1.07) 0.002
a First level model
b Second level model
cThird level model
d Forth level model
eHeterogeneity test
f Linear trend test
delivery seen in public services (40%), considering that the study was population-based and representative of all pregnant women who sought public care.
Other obstetric and newborn variables showed different values according to the category of service. Although it is a factor identifi ed in other studies,25 the effect of
number of previous cesarean sections was very high in the public sector (86% compared to 24% in the private sector). Twin birth was only important in public services. As for head circumference, even after adjustment for premature births, pregnant women users of public services had an increased risk, while no difference was found after adjustment among private users.
All these differences are extremely disproportionate among women per category of health service they use, but they are not different in their fi nal health need (delivering a child). It is barely logical that they only occur due to technical or scientifi c reasons. Technical indications of cesarean sections cannot be that high and that different between different categories of
services. But a different medical practice according to health sector could explain the higher and different rates seen and the differences in factors associated to cesarean section.
Our study provided input that should be used to further explain these differences. Other studies on the same subject pointed to two other factors that could explain our results: mother’s behavior and preferences, and doctor’s practice. As for mother’s behavior and prefe-rences, studies have found that pregnant women’s choice,15 even of those with low or middle condition,4
has an infl uence on the outcome. Furthermore, appa-rently it occurs after hospital admission,17 suggesting
that for some reason the mother changes her mind about vaginal delivery. As for doctor’s practice, there is evidence that medical practice is very important for the outcome in both public and private services.12,18
There seems to be a disagreement between what doctors believe would be their patients’ preferred route of
deli-very and what women actually want.9
In conclusion, the present study adds new knowledge about risk factors for cesarean section, and shows that they are not consistent when analyzed individually according to category of health service. The explanation is probably due to differences in women’s and doctors’ behaviors in both public and private services rather than adverse clinical conditions.
The Brazilian cesarean section rate is a public health concern and must be reduced. Some interventions to reduce these rates have focused on the main agents involved and others have been specific to health services. Promoting conscientious practices among physicians, and providing pregnant women with information about the benefi ts of vaginal delivery are some of them. Other interventions under consideration would be payment limitation for cesarean sections in the private health sector, as seen in public services. We suggest that health institutions, in addition to the second-opinion strategy,16 which is quite effective at
reducing unnecessary cesarean sections,1 establish a
specifi c hospital committee to review cesarean section indications following the same procedures as for other hospital events (e.g., hospital infection, deaths, and medical records quality).
A multi-focal strategy that includes cultural, fi nancial, management and medical practice interventions could have impact on reducing the cesarean section rate in Brazil.
Table 4. Adjusted prevalence ratios and 95% CI for cesarean sections in the private health sector. Rio Grande, Southern Brazil, 2008.
Variable PR (95% CI) p
Skin colora
White 1 0.01
Black/other 0.86 (0.77;0.97)
Income (minimum wage)a
0 to ½ 1 0.03e
+ ½ to 1 0.91 (0.76;1.11)
+ 1 1.06 (0.90;1.24)
Number of pregnanciesb 0.87 (0.79;0.95) 0.001
Previous C-sectionsb 1.24 (1.16;1.33) 0.001
High blood pressurec
No 1
Yes 1.14 (1.07;1.21) 0.001
Cephalic perimeter (1 cm)dg 1.02 (0.99;1.04) 0.1
a First level model
b Second level model
cThird level model
d Forth level model
eHeterogeneity test
f Linear trend test
g Adjusted for premature birth
1. Althabe F, Belizán JM, Villar J, Alexander S, Bergel E, Ramos S, et al. Mandatory second opinion to reduce rates of unnecessary caesarean sections in Latin
America: a cluster randomised controlled trial. Lancet.
2004;363(9425):1934-40. DOI:10.1016/S0140-6736(04)16406-4
2. Barros FC, Vaughan JP, Victora CG, Huttly SR.
Epidemic of caesarean sections in Brazil. Lancet.
1991;338(8760):167-9. DOI:10.1016/0140-6736(91)90149-J
3. Barros FC, Victora CG, Horta BL. Ethnicity and infant
health in Southern Brazil. A birth cohort study. Int
J Epidemiol. 2001;30(5):1001-8. DOI:10.1093/ ije/30.5.1001
4. Behágue DP, Victora CG, Barros FC. Consumer demand for caesarean sections in Brazil: informed decision making, patient choice, or social inequality? A population based birth cohort study linking ethnographic and epidemiological methods.
BMJ. 2002;324(7343):942-5. DOI:10.1136/
bmj.324.7343.942
5. Cesar JA, Matijasevich A, Santos IS, Barros AJ, Dias-da-Costa JS, Barros FC, et al. The use of maternal and child health services in three population-based cohorts
in Southern Brazil, 1982-2004. Cad Saude Publica.
2008;24(Suppl 3):S427-36. DOI:10.1590/S0102-311X2008001500008
6. D’Orsi E, Chor D, Giffi n K, Angulo-Tuesta A, Barbosa GP, Gama AS, et al. Factors associated with cesarean sections in a public hospital in Rio de Janeiro,
Brazil. Cad Saude Publica. 2006;22(10):2067-78.
DOI:10.1590/S0102-311X2006001000012
7. Fabri RH, Murta EF. Socioeconomic factors
and cesarean section rates. Int J Gynaecol
Obstet. 2002;76(1):87-8. DOI:10.1016/S0020-7292(01)00544-6
8. Faisal-Cury A, Menezes PR. Fatores associados
à preferência por cesareana. Rev Saude Publica.
2006;40(2):226-32. DOI:10.1590/S0034-89102006000200007
9. Faúndes A, Pádua KS, Osis MJ, Cecatti JG, Sousa MH. Opinião de mulheres e médicos brasileiros
sobre a preferência pela via de parto. Rev Saude
Publica. 2004;38(4):488-94. DOI:10.1590/S0034-89102004000400002
10. Freitas PF, Drachler ML, Leite JC, Grassi PR. Desigualdade social nas taxas de cesariana em
primíparas no Rio Grande do Sul. Rev Saude
Publica. 2005;39(5):761-7. DOI:10.1590/S0034-89102005000500010
11. Gomes UA, Silva AA, Bettiol H, Barbieri MA. Risk factors for the increasing caesarean section rate in Southeast Brazil: a comparison of two birth cohorts,
1978-1979 and 1994. Int J Epidemiol.
1999;28(4):687-94. DOI:10.1093/ije/28.4.687
12. Hopkins K. Are Brazilian women really choosing to
deliver by cesarean? Soc Sci Med. 2000;51(5):725-40.
DOI:10.1016/S0277-9536(99)00480-3
13. Leal MC, Gama SG, Cunha CB. Desigualdades raciais, sociodemográfi cas e na assistência ao
pré-natal e ao parto, 1999-2001. Rev Saude
Publica. 2005;39(1):100-7. DOI:10.1590/S0034-89102005000100013
14. Mayor S. Caesarean section rate in England reaches
22%. BMJ. 2002;324(7346):1118. DOI:10.1136/
bmj.324.7346.1118/d
15. NIH State-of-the-Science Conference Statement on
cesarean delivery on maternal request. NIH Consens
State Sci Statements. 2006;23(1):1-29.
16. Osis MJ, Cecatti JG, Padua KS, Faundes A. Brazilian doctors’ perspective on the second
opinion strategy before a C-section. Rev Saude
Publica. 2006;40(2):233-9. DOI:10.1590/S0034-89102006000200008
17. Potter JE, Berquó E, Perpétuo IH, Leal OF, Hopkins K, Souza MR, et al. Unwanted caesarean sections among public and private patients in Brazil: prospective
study. BMJ. 2001;323(7322):1155-8. DOI:10.1136/
bmj.323.7322.1155
18. Potter JE, Hopkins K, Faúndes A, Perpétuo I. Women’s autonomy and scheduled cesarean sections in Brazil: a
cautionary tale. Birth. 2008;35(1):33-40. DOI:10.1111/
j.1523-536X.2007.00209.x
19. Roberts CL, Tracy S, Peat B. Rates for obstetric intervention among private and public patients in Australia: population based descriptive study.
BMJ. 2000;321(7254):137-41. DOI:10.1136/
bmj.321.7254.137
20. Silva AA, Lamy-Filho F, Alves MT, Coimbra LC, Bettiol H, Barbieri MA. Risk factors for low birthweight in north-east Brazil: the role of caesarean section.
Paediatr Perinat Epidemiol. 2001;15(3):257-64. DOI:10.1046/j.1365-3016.2001.00358.x
21. Silva LM, Silva RA, Silva AA, Bettiol H, Barbieri MA. Racial inequalities and perinatal health in the southeast
region of Brazil. Braz J Med Biol Res.
2007;40(9):1187-94. DOI:10.1590/S0100-879X2006005000144
22. Silveira DS, Santos IS.Fatores associados à cesariana
entre mulheres de baixa renda em Pelotas, Rio Grande
do Sul, Brasil. Cad Saude Publica. 2004;20(Supl
2):S231-41.
23. Trujillo-Hernández B, Rios-Silva M, Huerta M, Trujillo X, Vásquez C, Millán-Guerrero R. Frequency of, indications for and clinical epidemiological characteristics of fi rst time cesarean section, compared
with repeated cesarean section. Arch Gynecol Obstet.
2002;267(1):27-32. DOI:10.1007/s00404-001-0255-6
24. Victora CH, Huttly SR, Fuchs SC, Olinto MT. The role of conceptual frameworks in epidemiological
analysis: a hierarchical approach. Int J Epidemiol.
1997;26(1):224-7. DOI:10.1093/ije/26.1.224
25. Villar J, Valladares E, Wojdyla D, Zavaleta N, Carroli G, Velazco A, et al. Caesarean delivery rates and pregnancy outcomes: the 2005 WHO global survey on
maternal and perinatal health in Latin America. Lancet.
2006;367(9525):1819-29. DOI:10.1016/S0140-6736(06)68704-7.
26. Villar J, Carroli G, Zavaleta N, Donner A, Wojdyla D, Faundes A, et al. Maternal and neonatal individual risks and benefi ts associated with caesarean delivery: multicentre prospective
study. BMJ. 2007;335(7628):1025. DOI:10.1136/
bmj.39363.706956.55
27. Wax JR, Cartin A, Pinette MG, Blackstone J. Patient
choice cesarean: an evidence-based review. Obstet