Belén Sanz-BarberoI Enrique RegidorII Silvia GalindoI
I Escuela Nacional de Sanidad. Instituto de Salud Carlos III (España). Ministerio de Ciencia e Innovación. Madrid, España II Departamento de Medicina Preventiva,
Salud Pública e Historia de la Ciencia. Facultad de Medicina. Universidad Complutense de Madrid. Madrid, España Correspondence:
Belén Sanz Barbero
Escuela Nacional de SanidadInstituto de Salud Carlos III
C/ Monforte de Lemos nº5 28029 Madrid, España E-mail: bsanz@isciii.es Received: 7/30/2010 Approved: 5/11/2011
Article available from: www.scielo.br/rsp
Impact of geographic origin on
gynecological cancer screening
in Spain
ABSTRACT
OBJECTIVE: To assess the association between geographic origin and the use
of screening cervical smears and mammograms.
METHODS: Data was obtained from the 2006 Spanish National Health Survey
that included 13,422 females over 16 years of age. The dependent variable was use of screening mammograms and cervical smears in the past 12 months. The measure of association (odds ratio and its related 95% confi dence interval) was estimated using logistic regression.
RESULTS: African women were 0.36 (95% CI 0.21,0.62), Eastern European
0.40 (95%CI 0.22;0.74), Western European, American and Canadian 0.60 (95%CI 0.43,0.84), and Central and South American 0.64 times (95%CI 0.52, 0.81) less likely to undergo a mammogram compared with the general population of Spain. In regard to cervical cancer screening, Eastern European women were 0.38 (95%CI 0.28,0.50), African 0.47 (95%CI 0.33,0.67) and Western European, American and Canadian 0.61 times (95%CI 0.46, 0.81) less likely to undergo cervical smears. These associations were independent of age, socioeconomic condition, health status and health insurance coverage.
CONCLUSIONS: Immigrant women use less screening programs than native
Spanish women. This fi nding may suggest diffi cult access to prevention programs.
DESCRIPTORS: Vaginal Smears. Mammography. Equity in Access.
Emigrants and Immigrants. Socioeconomic Factors. Health Inequalities. Mass Screening.
INTRODUCTION
Breast cancer is the most common cancer among women from Western coun-tries. The incidence rate of breast cancer (standardized by age) estimated in member states of the European Union was 107.6 cases per 100,000 women in 2006,a much higher than worldwide estimates (37.4 cases/100,000 women in
2002).15 In Spain, the estimated rate of breast cancer was 93.6 cases/100,000
women in 2006.a However, 80% of cervical cancer cases occur in countries with
low levels of economic development. In addition, these cases are more frequent in regions such as South Africa (38.2 cases/100,000 women), the Caribbean (32.6 cases/100,000 women) and South America (28.6 cases/100,000 women).15
For cervical cancer, it is estimated that in the European Union, the incidence rate (standardized by age) was 13.8 cases/100,000 women in 2006,a which is
lower than the rate estimated worldwide (16.0 cases/100,000 women).15 In
Spain, specifi cally, the estimated incidence of cervical cancer was 10.3 cases per 100,000 women.a
Breast and cervical cancer screening tests reduce the incidence and mortality rates associated with these cancers.b In Spain, Autonomous Communities (ACs)
have population screening programs for breast cancer that include women aged 50 to 64 years, while some ACs broaden that age range to 45 to 69 years. In the majority of ACs, programs that screen for cervical cancer recom-mend cytology for women between 35 and 64 years of age, with periodic testing every three to fi ve years.c
Numerous studies from the United States have analyzed gynecological cancer rates according to ethnicity. These investigations reveal lower rates of breast cancer among ethnic minority women. These same women also have decreased survival and higher mortality rates.17 Both
the incidence and mortality rates of cervical cancer are also higher among ethnic minority women.1,2
An important factor contributing to this elevated mortality is late diagnosis due to the decreased participa-tion of ethnic minority women in screening programs.4
The reasons for this lower representation are heteroge-neous and can be explained in part by socioeconomic inequalities, linguistic and cultural barriers or barriers in accessing the healthcare system.9,13,19,21 Goel et al
showed that in the United States, the decreased use of preventative programs is associated with being an immi-grant rather than belonging to a specifi c race/ethnicity.9
In the European region, studies that have analyzed the use of screening programs according to place of birth are scarce, and the results of these studies present some heterogeneity. A study performed in Switzerland did not identify a relationship between country of origin (Switzerland, Spain, Italy, Portugal, Yugoslavia) and the use of mammography.8 Moser et al indicate that
ethnicity was a strong predictor for the use of cervical cancer screening programs but was not related to breast cancer screening in the United Kingdom, independent of sociodemographic and socioeconomic variables.14
Given that immigration is a recent phenomenon in Spain, the utilization of preventative services with respect to geographic origin has received little atten-tion. Studies conducted at the regional level show that immigrant women make less use of gynecological cancer screening than do Spanish women,16 although
these results have not been adjusted for factors related to healthcare access, factors shown to be explanatory in studies completed by other authors.7
b World Health Organization. International Agency for Research on Cancer. Geneva; 2008[cited 2010 May 2]. Available from: http://www.iarc.fr/en/publications/list/handbooks/index.php
c Ministerio de Sanidad y Consumo. Descripción del cribado del cáncer en España. Proyecto DESCRIC. Informe de Evaluación de Tecnologías Sanitarias (AATRM No 2006/01). Madrid; 2006.
d Instituto Nacional de Estadística. INEbase: Lista de operaciones estadísticas incluídas Madrid; [s.d.][cited 2010 May 2]. Available from: http://www.ine.es/inebmenu/indice.htm#12
Because nationwide information on the use of gyne-cological screening programs according to region of geographic origin does not exist, the objective of this study was to analyze the association between region of origin and the use of cytology and mammography.
METHODS
The data originated from the 2006 Spanish National Health Survey, which sampled the non-institutional-ized population older than 16 years. This survey was conducted by the National Statistical Institute and included 13,422 women.d Sampling was stratified.
Units in the fi rst stage were census selections, grouped in layers depending on the size of the municipality. Sections were selected in each layer with a probability proportional to size. Units of the second stage were main family dwellings and were selected within each section with equal probability by systematic sampling with a random base. Within each home, we randomly selected an individual 16 years of age or older. The response rate was 96.1%. When the selected person could not give information due to problems related to communication, illness or handicap, obtaining information from another suffi ciently informed and capable household resident was permitted. Questionnaires in official Spanish languages were made and translated to English.
Women aged 16 to 74 years were asked about cervical cancer screening (vaginal cytology). Women aged 35 to 74 years were asked about breast cancer screening (mammography). These age ranges were chosen taking into account the age coverage of the screening programs while also attempting to interview a suffi cient number of women to obtain estimations.
The dependent variables covered the following topics: 1) having had a mammography in the last year [ques-tions: “Have you received a mammogram at some point (breast radiography)?” and “In what year did you have your last mammogram?”] and 2) having had a vaginal cytology examination in the past year [questions: “Have you received a vaginal cytology (cell sample) assessment?” and “In what year did you have your last vaginal cytology?].
The geographic areas of origin (the principal indepen-dent variable) were defi ned by the countries of birth of the interviewees: Spain, Western Europe, the United States and Canada, Eastern Europe, Central and South America, Africa and Asia.
class of reference in the home (defi ned by the National Statistical Institute as the current or the last occupa-tion undertaken by the person who contributes most the household income). Levels of education included the following: no education/cannot read or write, elementary or equivalent and high school or university. Categories of social class included the following: I) executives and professionals associated with a univer-sity degree; II) professional staff and administrative support, self-employed, supervisors of manual workers; IV) semi-skilled manual laborers; and V) unskilled manual laborers. These categories were further grouped as follows: high class, I+II; middle class, III; and lower class, IV + V. Total household income was categorized as the following: less than 600 €/month; between 601-1200 €/month; 1201-3600 €/month; more than 3601 €/month; or did not answer.
To evaluate the need for healthcare assistance, we analyzed self-perceived health in the last year (very good, good, fair, bad or very bad) and the number of chronic illnesses that the interviewee suffered (no illness, 1-2 illnesses, 3-4 illnesses, more than four illnesses).
Health coverage (public, public and private, only private or other forms of coverage, including people without coverage and loss of information) was included as a mediator of healthcare. The number of subjects without information was small; therefore, it was not included as an independent category.
The distribution of the variables was calculated for each of the categories of geographic areas of origin. The association between geographic area of origin and having a mammography/cytology in the year before the interview was calculated. The measure of association used was the odds ratio with a 95% confi dence interval (95%CI), calculated by logistic regression. Model 0 estimated the crude association; the following models successively included age (model 1), socioeconomic variables (model 2), state of health (model 3) and healthcare coverage (model 4). The reference category was the Spanish population.
Data were subject to the statistical confidentiality law (article 50.b of the public statistic law),e which
ensures the protection of the identities of the persons interviewed.
RESULTS
The total sample included 13,422 women, 13.9% of whom were immigrants. According to geographic area of origin, the distribution was the following: Spain, 86%; Central and South America, 7.4%; Eastern Europe, 2.3%; Western Europe, the United States and Canada, 2%; Africa, 1.7%; and Asia, 0.5% (Table 1).
The average age of the population was 43.23 years (SD: 15.84). The youngest women came from Eastern Europe (31.74 years; DS: 10.13 years), followed by those from Africa (33.6 years; DS: 12.16 years), Central and South America (35.9 years; DS: 11.8 years), Asia (36.2 years; DS: 12.8 years), Western Europe, the United States and Canada (43.9 years; DS: 14.9 years) and Spain (44.4 years; DS: 16.0 years).
The African population had the highest percentage of women without education (23.5%), followed by the Spanish population (10.3%). The groups with the highest percentages in the higher social class were from Western Europe, the United States and Canada (55.3%) and Spain (44.6%). Asia was polarized in the high (46.3%) and low (43.3%) social classes.
The percentages of respondents with positive self-perceived health (very good, good) were greater among the Eastern European population (74.2%) and those from Western Europe, the United States and Canada (71.4%).
Fewer mammograms were received by women of Eastern European origin (20.8%), followed by popula-tions from Africa (23.0%), Central and South America (32.4%), Western Europe, the United States and Canada (36.1%), Asia (42.9%) and Spain (44.7%). Decreased use of cytology was reported by women from Africa (20.8%), followed by those from Eastern Europe (24.8%), Asia (33.8%), Western Europe, the United States and Canada (36.7%), Spain (47.7%) and Central and South America (48.9%) (Table 2).
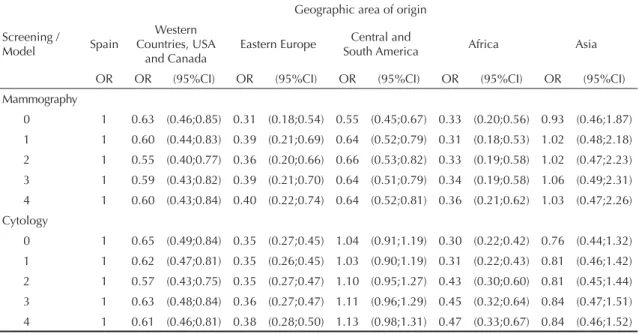
The association between geographic area of origin and receipt of mammography was significant and was less than the units of all the other groups in the study, with the exception of populations from Asia, after adjusting for age, socioeconomic indicators and healthcare coverage. The probability of having had a mammography in the last year, using the Spanish population as a reference, was 0.36 (95%CI 0.21;0.62) times less among women from Africa, 0.40 (95%CI 0.22;0.74) times less than women from Eastern Europe, 0.60 (95%CI 0.43;0.84) times less among women from Western Europe, the United States and Canada and 0.64 (95%CI 0.52;0.81) times less than women from Central and South America. The probability of having had a mammography in the last year was similar in the Asian and Spanish populations (Table 3).
The probability of having undergone cytology was 0.38 (95%CI 0.28;0.50) times less among women from Eastern Europe, 0.47 (95%CI 0.33;0.67) times less among women from Africa and 0.61 (95%CI 0.46;0.81) times less among the population from Western Europe,
Table 1. Women between 16-74 years of age by geographic area of origin: Spain, 2006.
Variable
Geographic area of origin
Spain
Western Countries,
the USA and Canada
Eastern Europe
Central/ South America
Africa Asia Total
n = 11549 n = 272 n = 314 n = 995 n = 226 n = 66 n = 13422
n % n % n % n % n % n % n
Age (years)
16 to 24 1468 12.7 30 11.0 58 18.5 155 15.6 60 26.5 11 16.7 1782 25 to 34 2198 19.0 50 18.4 178 56.7 363 36.5 79 35.0 21 31.8 2889 35 to 44 2385 20.7 70 25.7 44 14.0 246 24.7 36 15.9 18 27.3 2799 45 to 54 2059 17.8 47 17.3 21 6.7 154 15.5 37 16.4 11 16.7 2329 55 to 64 1792 15.5 47 17.3 6 1.9 58 5.8 9 4.0 5 7.6 1917 65 to 74 1647 14.3 28 10.3 7 2.2 19 1.9 5 2.2 0 0.0 1706 Level of education (n = 125)
Not applicable/ Does not know how to read or write / no education
1187 10.3 9 3.3 8 2.6 14 1.4 53 23.5 5 7.6 1276
Elementary school or equivalent 3692 32.0 40 14.6 42 13.4 181 18.2 64 28.3 16 24.2 4035 Secondary education (1st and
2nd stages) 4542 39.3 165 60.2 199 63.6 598 60.2 94 41.6 29 43.9 5627 University education (1st and
2nd stages) 2016 17.5 60 21.9 56 17.9 195 19.6 15 6.6 16 24.2 2358 Social class (n = 322)
High: executives, university
professionals, employees 5147 44.6 151 55.3 59 18.8 252 25.3 44 19.4 31 46.3 5684 Middle: skilled manual laborers 3192 27.6 58 21.2 124 39.6 252 25.3 74 32.6 3 4.5 3703 Low: semi- and unskilled
manual laborers 2934 25.4 61 22.3 126 40.3 469 47.1 96 42.3 29 43.3 3715 Income Level (€/month)
< 600 825 7.1 11 4.0 6 1.9 51 5.1 19 8.4 4 6.0 916 601 to 1200 3428 29.7 71 26.0 90 28.8 318 32.0 88 38.9 20 29.9 4015 1201 to 3600 5039 43.6 125 45.8 151 48.2 463 46.5 56 24.8 17 25.4 5851 > 3601 475 4.1 16 5.9 17 5.4 38 3.8 6 2.7 5 7.5 557 No information 1782 15.4 50 18.3 49 15.7 125 12.6 57 25.2 21 31.3 2084 Self-perceived health
Very good 1859 16.1 77 28.2 89 28.4 199 20.0 52 23.0 11 16.4 2287 Good 5530 47.9 118 43.2 144 46.0 426 42.8 100 44.2 26 38.8 6344 Regular 3106 26.9 66 24.2 69 22.0 312 31.4 55 24.3 23 34.3 3631
Bad 762 6.6 6 2.2 7 2.2 52 5.2 8 3.5 7 10.4 842
Very bad 291 2.5 6 2.2 5 1.6 6 0.6 11 4.9 0 0.0 319 Number of chronic illnesses
None 2495 21.6 95 34.8 111 35.5 295 29.6 108 47.8 19 28.4 3123 1 to 2 3794 32.9 98 35.9 117 37.4 334 33.6 62 27.4 32 47.8 4437 3 to 4 2488 21.5 49 17.9 71 22.7 193 19.4 22 9.7 12 17.9 2835 More than 4 2772 24.0 30 11.0 15 4.8 173 17.4 34 15.0 4 6.0 3028 Health coverage
the United States and Canada in relation to the Spanish population. Women from Central and South America and those from Asia did not show signifi cant differ-ences from those from Spain. These associations are independent of age, socioeconomic indicators, state of health and healthcare coverage.
DISCUSSION
Immigrant women have a decreased probability of under-going screening for gynecological cancer compared to Spanish women. The probability of having a yearly mammogram was lower among immigrant women than in Spanish women, with the exception of women from Asia, who are likely to receive mammography with the same frequency as the Spanish population. This
association was independent of sociodemographic and socioeconomic characteristics, state of health and health coverage. For cervical cancer screening programs, the probability of having cytology within the year of the study was lower among immigrant women than among Spanish women, with the exception of women from Central and South America and those from Asia, who all had probabilities similar to native women.
Studies completed in Spain and in other countries have identifi ed a series of variables related to the use of gynecological screening programs. Socioeconomic indicators and sociodemographic variables have been studied widely, illustrating that older women and those from a high social class participate more in gyneco-logical screening programs than young women or those from a lower social class.5,12
Table 2. Use of breast and cervical cancer screenings according to geographic area of origin: Spain, 2006.
Use of screening
Geographic area of origin
Spain
Western Countries, the USA and Canada
Eastern Europe
Central/ South America
Africa Asia Total
n % n % n % n % n % n % n %
Mammography in the last year
(35-74 years of age) 3636 46,1 69 36,1 16 20,8 154 32,4 20 23,0 15 42,9 3910 44,7 Cytology in the last year
(16-64 years of age) 4727 47,7 90 36,7 76 24,8 477 48,9 46 20,8 23 33,8 5439 46,7
Table 3. Use of breast and cervical cancer screenings according to geographic area of origin: Spain, 2006.
Screening / Model
Geographic area of origin
Spain
Western Countries, USA
and Canada
Eastern Europe Central and
South America Africa Asia
OR OR (95%CI) OR (95%CI) OR (95%CI) OR (95%CI) OR (95%CI)
Mammography
0 1 0.63 (0.46;0.85) 0.31 (0.18;0.54) 0.55 (0.45;0.67) 0.33 (0.20;0.56) 0.93 (0.46;1.87) 1 1 0.60 (0.44;0.83) 0.39 (0.21;0.69) 0.64 (0.52;0.79) 0.31 (0.18;0.53) 1.02 (0.48;2.18) 2 1 0.55 (0.40;0.77) 0.36 (0.20;0.66) 0.66 (0.53;0.82) 0.33 (0.19;0.58) 1.02 (0.47;2.23) 3 1 0.59 (0.43;0.82) 0.39 (0.21;0.70) 0.64 (0.51;0.79) 0.34 (0.19;0.58) 1.06 (0.49;2.31)
4 1 0.60 (0.43;0.84) 0.40 (0.22;0.74) 0.64 (0.52;0.81) 0.36 (0.21;0.62) 1.03 (0.47;2.26) Cytology
0 1 0.65 (0.49;0.84) 0.35 (0.27;0.45) 1.04 (0.91;1.19) 0.30 (0.22;0.42) 0.76 (0.44;1.32) 1 1 0.62 (0.47;0.81) 0.35 (0.26;0.45) 1.03 (0.90;1.19) 0.31 (0.22;0.43) 0.81 (0.46;1.42)
2 1 0.57 (0.43;0.75) 0.35 (0.27;0.47) 1.10 (0.95;1.27) 0.43 (0.30;0.60) 0.81 (0.45;1.44) 3 1 0.63 (0.48;0.84) 0.36 (0.27;0.47) 1.11 (0.96;1.29) 0.45 (0.32;0.64) 0.84 (0.47;1.51) 4 1 0.61 (0.46;0.81) 0.38 (0.28;0.50) 1.13 (0.98;1.31) 0.47 (0.33;0.67) 0.84 (0.46;1.52) OR: odds ratio; CI95%: confi dence interval at 95%
- Model 0: univariate - Model 1: adjusted for age
- Model 2: adjusted for age, education level, social class and income
- Model 3: adjusted for age, education level, social class, income, self-perceived health and chronic illness
The evaluation of participation in gynecological screening programs according to geographic area of origin has received little attention. Investigations in the United States, Canada and the United Kingdom have evaluated the differences in participation in screening programs according to ethnicity.7,14 The results indicate
that ethnic minorities use gynecological screening programs less frequently and that these differences are diminished, but do not disappear, by adjusting for sociodemographic and socioeconomic variables. The work of Goel et al9 (2003) shows that inequalities
attrib-uted to ethnicity are not attributable to ethnic group alone, but to the country of origin. Moreover, indepen-dent of ethnic group, immigrant women participate less in gynecological screening programs than do native women. The reasons for this lower level of participa-tion, beyond the sociodemographic and socioeconomic characteristics, have not yet been clearly identifi ed.
Diffi culties communicating with service providers are associated with less frequent uses of these services. Linguistic barriers are widely cited by immigrant women.21 This language barrier is important because
the recommendation of screening tests by medical staff is a powerful predictor of their completion and can be compromised by communication problems.3,18
Our work does not adjust for language skills; however, this hypothesis might explain the fact that women from Central and South America are as likely to have cervical cytology as the Spanish population. This hypothesis explains neither the frequent use of cytology among women from Asia, which was similar to the frequency in the Spanish population, nor the lower probability of participation among women from Central and South America in breast cancer screening programs.
A variable that has been important in other works but was not investigated in this study due to the lack of relevant information in the National Health Survey is length of stay in the host country and the administrative status of women. The participation of immigrant women in gynecological screening programs increases with dura-tion of stay in the host country.20 Shorter stays in the host
country imply less social integration; this trend likely extends to healthcare. This phenomenon may partially explain our results because immigration is a recent phenomenon in Spain. Studies conducted in the United States show that undocumented women infrequently use
both screening tests.7 In Spain, having an unregulated
administrative status might be associated with greater job insecurity, lack of health coverage and less knowledge of the healthcare system. In short, unregulated status could be compromising the use of services.
In our study, women from Asia were an exception to the association between immigration and participation in breast cancer screening. Currently, there are no other studies that support these results, which is perhaps due to the low representation of this group of women in the survey.
Although there are questions that this study cannot answer, the decreased use of screening programs by immigrant women may result from a lack of knowledge regarding cancer or a different early prevention culture. The participation in screening programs11 may have a
strong cultural component, as has been shown by other studies in other contexts.6,10
This investigation presents certain limitations. An absence of variables related to the migratory process, including duration of residence in Spain or native language, has already been mentioned. When collecting data, although questionnaires were translated into English, we did not have the help of translators. This shortcoming might bias the sample toward the selec-tion of people with a better knowledge of Spanish and presumably toward those with greater use of health services. Therefore, we may be underestimating the asso-ciations identifi ed this study. However, the geographic areas studied are heterogeneous in relation to the coun-tries that were included, and a greater stratifi cation would not permit us to obtain such robust estimations.
1. Albain KS, Unger JM, Crowley JJ, Coltman Jr CA, Hershman DL. Racial disparities in cancer survival among randomized clinical trials patients of the Southwest Oncology Group. J Natl Cancer Inst.
2009;101(14):984-92. DOI:10.1093/jnci/djp175
2. Barnholtz-Sloan J, Patel N, Rollison D, Kortepeter K, MacKinnon J, Giuliano A. Incidence trends of invasive cervical cancer in the United States by combined race and ethnicity. Cancer Causes Control. 2009;20(7):1129-38. DOI:10.1007/s10552-009-9317-z
3. Barzagan M, Barzagan SH, Farooq M, Baker R. Correlates of cervical cancer screening among underserved Hispanic and African-American women.
Prev Med. 2004;39(3):465-73. DOI:10.1016/j.
ypmed.2004.05.003
4. Chlebowski RT, Chen Z, Anderson GL, Rohan T, Aragaki A, Lane D, et al. Ethnicity and breast cancer: factors infl uencing differences in incidence and outcome. J Natl Cancer Inst. 2005;97(6):439-48. DOI:10.1093/jnci/dji064
5. Coughlin SS, Leadbetter S, Richards T, Sabatino SA. Contextual analysis of breast and cervical cancer screening and factors associated with health care access among United States women, 2002.
Soc Sci Med. 2008;66(2):260-75. DOI:10.1016/j.
socscimed.2007.09.009
6. Echevarria ES, Carrasquillo O. The roles of citizenship status, acculturation, and health insurance in breast and cervical cancer screening among immigrant women. Med Car. 2006;44(8):788-92. DOI:10.1097/01.mlr.0000215863.24214.41
7. Fontana M, Bischoff A. Uptake of breast cancer screening measures among immigrant and Swiss women in Switzerland. Swiss Med Wkly. 2008;138(49-50):752-8.
8. Goel MS, Wee CC, McCarthy EP, Davis RB, Ngo-Metzger Q, Phillips RS. Racial and ethnic disparities in cancer screening. The importance of foreign birth as a barriers to care. J Gen Intern Med. 2003;18(12):1028-35. DOI:10.1111/j.1525-1497.2003.20807.x
9. Holroyd E, Twinn S, Adab P. Socio-cultural infl uences on Chinese women’s attendance for cervical screening.
J Adv Nurs. 2004;46(1):42-52.
DOI:10.1111/j.1365-2648.2003.02964.x
10. Johnson CE, Mues KE, Mayne SL, Kiblawi AN. Cervical cancer screening among immigrants and ethnic minorities: a systematic review using the Health Belief Model.J Low Genit Tract Dis. 2008;12(3):232-41. DOI:10.1044/1059-0889(2008/002
11. Lostao L, Joiner TE, Pettit JW, Chorot P, Sandín B. Health beliefs and illness attitudes as predictors of breast cancer screening attendance. Eur J
Public Health. 2001;11(3):274-9. DOI:10.1093/
eurpub/11.3.274
12. Lostao L, Regidor E, Calle ME, Navarro P, Domínguez V. Evolución de las diferencias socioeconómicas en la utilización y accesibilidad de los servicios sanitarios en España entre 1987 y 1995-97. Rev Esp Salud
Publica. 2001;75(2):115-27.
DOI:10.1590/S1135-57272001000200004
13. Markovic M, Kesic V, Topic L, Matejic B. Barriers to cervical cancer screening: a qualitative study with women in Serbia. Soc Sci Med. 2005;61(12):2528-35. DOI:10.1016/j.socscimed.2005.05.001
14. Moser K, Patnick J, Beral V. Inequalities in reported use of breast and cervical screening in Great Britain: analysis of cross sectional survey data. BMJ. 2009;338:b2025. DOI:10.1136/bmj.b2025
15. Parkin MD, Bray F, Ferlay J, Pisani P. Global Cancer Statistics, 2002. CA Cancer J Clin. 2005;55(2):74-108. DOI:10.3322/canjclin.55.2.74
16. Regidor E, Sanz B, Pascual C, Lostao L, Sánchez E, Días Olalla JM. La utilización de los servicios sanitarios por la población inmigrante en España. Gac
Sanit. 2009;23Supl1:4-11.
17. Smigal C, Jemal A, Ward E, Cokkinides V, Smith R, Howe HL, et al. Trends in Breast Cancer by Race and Ethnicity: Update 2006. Cancer J Clin. 2006;56(3):168-83. DOI:10.3322/canjclin.56.3.168
18. Su X, Ma G, Seals B, Tan Y, Hausman A. Breast cancer early detección among chinese women in the Philadelphia Area. J Women’s Health. 2006;15(5):507-19. DOI:10.1089/jwh.2006.15.507
19. Thomas VN, Saleem T, Abraham R. Barriers to effective uptake of cancer screening among Black and minority ethnic groups. Int J Palliat Nurs.
2005;11(11):564-71.
20. Tsui J, Saraiya M, Thompson T, Achintya MA, Richardson L. Cervical cancer screening among foreing-born women by birthplace and duration in the United States. J Womens Health (Larchmt).
2007;16(10):1447-57. DOI:10.1089/jwh.2006.0279
21. Woltman KJ, Newbold KB. Immigrant women and cervical cancer screening uptake: a multilevel analysis.
Can J Public Health. 2007;98(6):470-5.)
REFERENCES