Disparities in cervical and
breast cancer mortality in Brazil
Os grandes contrastes na
mortalidade por câncer do colo
uterino e de mama no Brasil
I Plataforma de Pesquisa Clínica. Instituto Nacional de Infectologia Evandro Chagas. Fundação Oswaldo Cruz. Rio de Janeiro, RJ, Brasil
II Instituto Latino-americano de Ciências da Vida e da Natureza. Universidade Federal da Integração Latino-americana. Foz do Iguaçu, PR, Brasil
III Departamento de Epidemiologia. Instituto de Medicina Social. Universidade do Estado do Rio de Janeiro. Rio de Janeiro, RJ, Brasil Correspondence:
Vania Reis Girianelli Av. Brasil, 4365 Manguinhos 21040-360 Rio de Janeiro, RJ, Brasil E-mail: [email protected] Received: 10/29/2013
Approved: 2/26/2014
Article available from: www.scielo.br/rsp
ABSTRACT
OBJECTIVE: To analyze cervical and breast cancer mortality in Brazil according to socioeconomic and welfare indicators.
METHODS: Data on breast and cervical cancer mortality covering a 30-year period (1980-2010) were analyzed. The data were obtained from the National Mortality Database, population data from the Brazilian Institute of Geography and Statistics database, and socioeconomic and welfare information from the Institute of Applied Economic Research. Moving averages were calculated, disaggregated by capital city and municipality. The annual percent change in mortality rates was estimated by segmented linear regression using the
joinpoint method. Pearson’s correlation coeficients were conducted between
average mortality rate at the end of the three-year period and selected indicators in the state capital and each Brazilian state.
RESULTS: There was a decline in cervical cancer mortality rates throughout the period studied, except in municipalities outside of the capitals in the North and Northeast. There was a decrease in breast cancer mortality in the capitals from the end of the 1990s onwards. Favorable socioeconomic indicators were inversely correlated with cervical cancer mortality. A strong direct correlation was found with favorable indicators and an inverse correlation with fertility rate and breast cancer mortality in inner cities.
CONCLUSIONS: There is an ongoing dynamic process of increased risk of cervical and breast cancer and attenuation of mortality because of increased, albeit unequal, access to and provision of screening, diagnosis and treatment.
DESCRIPTORS: Breast Neoplasms, mortality. Uterine Cervical
Neoplasms, mortality. Health Services Accessibility. Time Series Studies.
Vania Reis GirianelliI
Carmen Justina GamarraII
a Ministério da Saúde, Departamento de Informática do Sistema Único de Saúde. Informações das estatísticas de mortalidade e demográficas [cited 2013 Jan]. Available from: www2.datasus.gov.br/DATASUS/index.php?area=02
Breast and cervical cancer are the most common malignant neoplasms in women worldwide. Breast cancer, together with lung and colorectal cancer, are among the most common types in high income countries, while uterine cancer exceeds other types in low income countries.6
Increased incidence of breast cancer in various countries can be partially explained by demographic and lifestyle changes affecting reproductive factors, such as delayed
irst pregnancy, having fewer children and shorter duration
of breastfeeding.17 Over the last few decades, mortality has declined in developed countries such as the USA, the United Kingdom, France and Australia. The fall in inci-dence in the USA from the year 2000 onwards is attributed to the reduction in hormone replacement therapy and the
RESUMO
OBJETIVO: Analisar a evolução da mortalidade por câncer do colo uterino e de mama no Brasil, segundo indicadores socioeconômicos e assistenciais.
MÉTODOS: Foram analisados dados agregados de 30 anos (1980-2010) de mortalidade por câncer de mama e colo uterino. Os dados de óbitos foram extraídos do Sistema de Informações sobre Mortalidade, os denominadores populacionais, do Instituto Brasileiro de Geografia e Estatística, e os indicadores socioeconômicos e assistenciais do Instituto de Pesquisa Econômica e Aplicada. Foram calculadas as médias móveis desagregadas por capitais e municípios do interior dos estados. O percentual de mudança anual das taxas foi estimado a partir da regressão linear segmentada por joinpoint. Foi feita correlação de Pearson entre as taxas médias trienais do final do período e os indicadores selecionados das capitais e de cada estado brasileiro.
RESULTADOS: Houve queda da mortalidade por câncer do colo uterino em todo o período, exceto em municípios das regiões Norte e Nordeste fora das capitais. Houve declínio na mortalidade por câncer de mama nas capitais a
partir do inal da década de 1990. Os indicadores socioeconômicos positivos
correlacionaram-se inversamente com a mortalidade de câncer do colo uterino. Observou-se forte correlação direta entre indicadores positivos e inversa com a taxa de fecundidade e a mortalidade por câncer de mama nos municípios do interior dos estados.
CONCLUSÕES: Encontra-se em curso um mecanismo dinâmico entre aumento de risco por câncer de mama e do colo uterino com atenuação da mortalidade em função da expansão de oferta e acesso ao rastreamento, diagnóstico e tratamento, porém de forma desigual.
DESCRITORES: Neoplasias da Mama, mortalidade. Neoplasias do Colo do Útero, mortalidade. Acesso aos Serviços de Saúde. Estudos de Séries Temporais..
INTRODUCTION
decreased number of pre-clinical cases detected through screening, which began over 20 years ago.12
The introduction of cervical cancer screening in
devel-oped countries proved that this measure signiicantly
reduces incidence of, and mortality from, this disease and prolongs patient survival. However, this has not been observed in low income countries where access to primary and specialized care is limited.16
In Brazil, the Sistema de Informações sobre Mortalidade
b Instituto de Pesquisa Econômica Aplicada. Indicadores sociais [cited 2013 Jan]. Available from: www.ipeadata.gov.br
c Mathers CD, Bernard C, Iburg KM, Inoue M, Fat DM, Shibuya K, Stein C, Tomijima N, Xu H. Global Burden of Disease in 2002: data sources, methods and results. Global Programme on Evidence for Health Policy Discussion Paper No. 54 World Health Organization December 2003 (revised February 2004).
d Segi M. Cancer mortality for selected sites in 24 countries (1950-57). Sendai: Tohoku University School of Public Health; 1960.
greater than those oficially released if corrections referring to “undeined” causes and cases classiied as “non-speciied area of uterus” were made. Using
these data to project expected number of new cases in this country, more than 50,000 women would be diag-nosed with breast cancer annually, and around 20,000 with cervical cancer.
Analysis of temporal trends in mortality between 1980 and 2006 indicate that there are differentiated patterns to these cancers in Brazil, with a fall in cervical cancer and an increase in breast cancer.4 When data for state capi-tals and other municipalities are disaggregated, these trends are shown to have different inclinations. The decrease in cervical cancer in women in the Southeast, South and Central-West is clear. However, in the North and Northeast, such a fall is only apparent in the state capitals and rates in residents in the interior show
statis-tically signiicant increases.
During the period, increases in mortality from breast
cancer were veriied in all ive regions of Brazil, although a declining trend in the coeficients was observed in state
capitals from the end of the 1990s onwards.
The great challenge for middle and low income coun-tries is to ensure strategies that enable early diagnosis of these two types of cancer and to reduce trends in mortality. It would be possible to reduce cervical cancer incidence if all women with premalignant lesions had access to appropriate treatment.
It is essential that trends in incidence and mortality are monitored in order to evaluate the results of screening strategies which have been shown to be effective in other countries.
The aim of this study was to analyze the evolution of breast and cervical cancer mortality in state capitals and other Brazilian municipalities, according to socioeco-nomic and health care indicators.
METHODS
This is a study of breast and cervical cancer mortality
in state capitals and other municipalities in the ive
Brazilian regions, using aggregated time series data from a 30-year-period (1980-2010). The data on deaths were obtained from the SIM, population data from Brazilian Institute of Geography and Statistics (IBGE) demographic censusesa and socioeconomic and health care indicators from the Institute of Applied Economic Research (IPEA).b Population data between the censuses were estimated using linear interpolation.
Between 1980 and 1995, the deaths included were
those classiied using the Manual of the International Statistical Classiication of Diseases, Injuries, and
Causes of death (ICD-9); and those occurring between
1996 and 2010, classiied using the International Statistical Classiication of Diseases and Related
Health Problems (ICD-10). Breast cancer and cervical cancer correspond to codes: 174(ICD-9) and C50(ICD-10), 180(ICD-9) and C53(ICD-10),
respec-tively, reported to the SIM and classiied under these
codes after correction.
Correction for breast and cervical cancer deaths was conducted by proportionally redistributing 50.0% of
deaths classiied as “undeined” (codes: 780-799 of the
ICD-9 and R00-R99 of the ICD-10), using the World Health Organization (WHO) proportional redistribution methodology.c Correction factors were calculated for
each ive-year-period, age and sex for capital and inte -rior of each state. Cervical cancer deaths were corrected
by redistributing all deaths classiied as non-speciied
uterine cancer (codes 179 of the ICD-9 and C55 of the ICD-10), maintaining the same proportion of deaths from cervical and uterine cancer.9
Average breast and cervical cancer mortality rates (to the order of three) were calculated and standard-ized, corrected for age group using the direct method, taking the world population standard as a reference.d The time trend was evaluated using joinpoint regres-sion, version 3.4.3. Year of death was the independent variable and mortality rates the dependent variable, according to the following groupings: large regions, state capitals and other municipalities (interior). The models were adjusted assuming a different number of joinpoints, from zero (trend represented by one single segment of the line) to three; considering changes in the rates over time. Annual percentage changes (APC) were calculated for each type of cancer, period and geographic area.
indicators corresponded to worse conditions: propor-tion of populapropor-tion aged ≥ 25 who are illiterate; fertility rate; proportion of individuals living below the poverty line, i.e., on under half a minimum wage
per capita; mortality rate in children < 5/1,000 live
births; percentage of households headed by women, without partner and with children < 15.
Pearson’s correlation coefficients were calculated between the three-year average rates (2008-2010) in the Federal District and the state capitals and other municipalities in each state and the indicators in the capitals and states, respectively, using the R statistic program (version 2.7.1). Values between 0.70 and 1 were deemed strong correlation, moderate 0.30 to 0.69 and weak 0 to 0.29.
The research was approved by the Research Ethics Committee of the Instituto de Medicina Social,
Universidade do Estado do Rio de Janeiro (Process
CAAE 0027.0.259.000-09, 8/12/2009), and followed ethical standards.
RESULTS
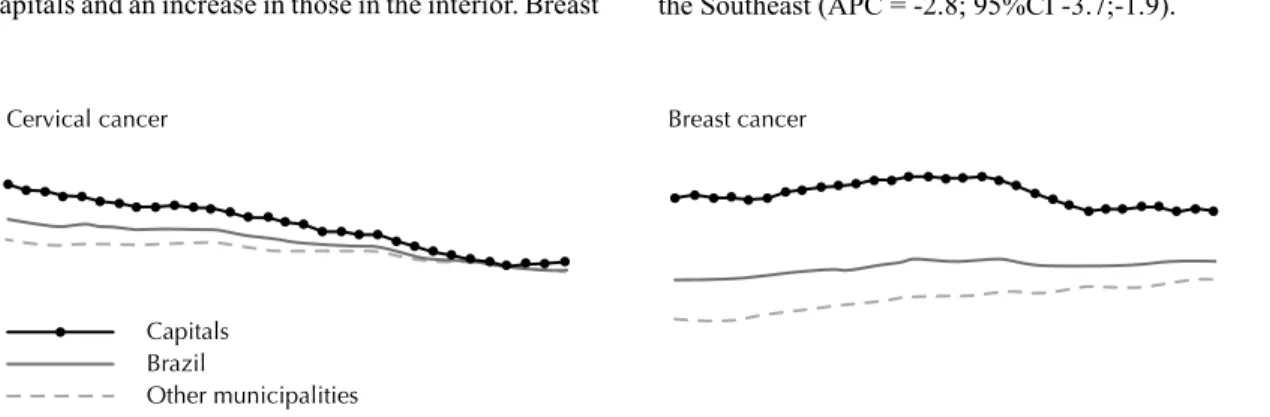
In the 1980s, the magnitude of breast cancer mortality in Brazilian women was similar to that of cervical cancer. However, breast cancer always weighed more heavily in state capitals (Figure 1). Patterns in mortality rates for the two types of cancer in Brazil differed over the 30 years: a clear fall in cervical cancer, more pronounced in state capitals, and an increase in breast cancer. From the end of the 1990s, number of deaths from this cancer began to decrease in women living in the state capitals.
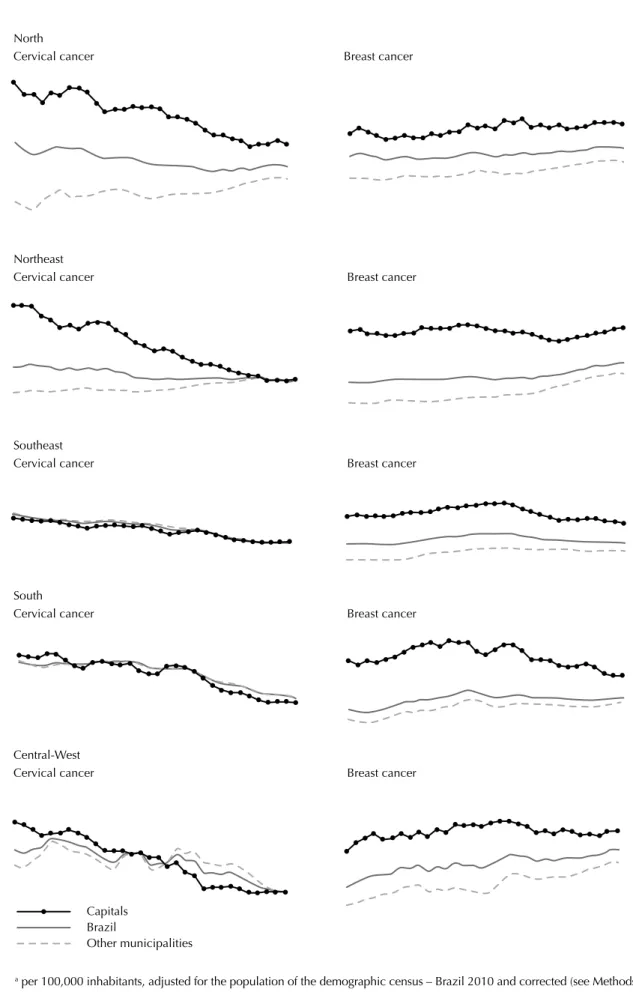
The same comparison with data disaggregated by region shows a difference in magnitude and trends of mortality for these two types of cancer (Figure 2). In the North, cervical cancer mortality was higher than that of breast cancer throughout the period, and there was a fall in deaths among women living in the state capitals and an increase in those in the interior. Breast
cancer increased evenly in all municipalities. This
proile differed in the Northeast, where breast cancer
mortality rates exceeded those of cervical cancer at the end of the period, with a marked increase in women living in the interior. Cervical cancer mortality
coef-icients in the South and Southeast were lower than
those of breast cancer and there was a clear trend of decline in the female population as a whole. A decline in deaths from breast cancer was noted in the state capitals of the South from the mid-1990s onwards, and in the Southeast from the end of that decade. In the Central-West, throughout the period, there was an increase in breast cancer mortality and a fall in cervical cancer mortality. The speed of the advance of breast cancer among women living outside the state capitals was considerable.
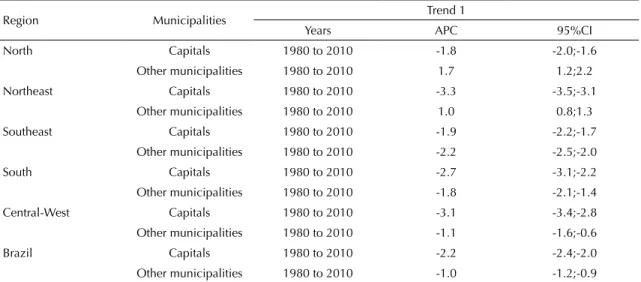
Regression analysis using joinpoint showed a signii -cantly statistic drop in mortality rates from cervical cancer in the state capitals and other municipalities in the Southeast, South and Central-West (Table 1). In the North and Northeast, there was a fall in the state capitals and an increase in the interior. The largest drop was observed in state capitals in the Northeast (APC -3.3; 95%CI -3.5;-3.1).
The patterns of breast cancer mortality trends differed between the regions and between the state capitals and other municipalities (Table 2). There was an overall
increase in rates in the irst observation period, with
the exception of in the interior of the North. Mortality rates for this cancer continued to grow in the interior of the North and Northeast and in the state capitals in the North. However, the rates began to fall in other regions, both in the state capitals and outside of them. The greatest growth was observed in the North, in municipalities in the interior, between 1999 and 2010 (APC = 5.0; 95%CI 3.3;6.8) and in the interior of the Northeast (APC = 4.9; 95%CI 4.4;5.5). The greatest annual drop was observed between 1997 and 2002 in the Southeast (APC = -2.8; 95%CI -3.7;-1.9).
Figure 1. Breast and cervical cancer mortalitya. Brazil, overall and by state capitals and other municipalities, 1980 to 2010.
a per 100,000 inhabitants, adjusted for the population of the demographic census – Brazil 2010 and corrected (see Methods).
Cervical cancer Breast cancer
Other municipalities Brazil
Figure 2. Breast and cervical cancer mortality.a Brazil, overall and by state capitals and other municipalities, 1980 to 2010.
a per 100,000 inhabitants, adjusted for the population of the demographic census – Brazil 2010 and corrected (see Methods).
Other municipalities Brazil
North
Cervical cancer Breast cancer
Northeast
Cervical cancer Breast cancer
Southeast
Cervical cancer Breast cancer
South
Cervical cancer Breast cancer
Central-West
Cervical cancer Breast cancer
Correlation analysis was conducted between some socioeconomic and health care positive and negative indicators (doctors/1,000 inhabitants) and mortality rates in residents in the state capitals or other munici-palities in the states. A moderate direct relationship between three positive indicators and an inverse rela-tionship, also moderate, were found with breast cancer. In the interior, there were strong correlations with almost all the positive indicators and, of the negative indicators, there was a strong correlation with fertility (r = -0.92; p < 0.0001) and the percentage of female head of household, single and with children under 15 (r = -0.82; p < 0.0001), with moderate correlation with the other three (Table 3).
Mortality indicators behaved differently for cervical
cancer in the state capitals: of the ive positive indica
-tors, three were negatively correlated, and of the ive
negatives, three correlated positively. The indicators analyzed do not show correlation with cervical cancer mortality rates in the interior, with the exception of percentage of individuals living below the poverty line (r = 0.46; p = 0.017).
DISCUSSION
The results suggest there is a dynamic mechanism between determining risk exposures in the appear-ance of breast and cervical cappear-ancer. At the same time, Table 1.Joinpoint regression analysis of cervical cancer mortality trends. State capitals and other municipalities in the Brazilian regions, 1980 to 2010.
Region Municipalities Trend 1
Years APC 95%CI
North Capitals 1980 to 2010 -1.8 -2.0;-1.6
Other municipalities 1980 to 2010 1.7 1.2;2.2
Northeast Capitals 1980 to 2010 -3.3 -3.5;-3.1
Other municipalities 1980 to 2010 1.0 0.8;1.3
Southeast Capitals 1980 to 2010 -1.9 -2.2;-1.7
Other municipalities 1980 to 2010 -2.2 -2.5;-2.0
South Capitals 1980 to 2010 -2.7 -3.1;-2.2
Other municipalities 1980 to 2010 -1.8 -2.1;-1.4
Central-West Capitals 1980 to 2010 -3.1 -3.4;-2.8
Other municipalities 1980 to 2010 -1.1 -1.6;-0.6
Brazil Capitals 1980 to 2010 -2.2 -2.4;-2.0
Other municipalities 1980 to 2010 -1.0 -1.2;-0.9
APC: annual percentage change.
Table 2.Joinpoint regression analysis of breast cancer mortality trends. State capitals and other municipalities in the Brazilian regions, 1980 to 2010.
Region Municipalities Trend 1 Trend 2 Trend 3
Years APC 95%CI Years APC 95%CI Years APC 95%CI
North Capitals 1980 to 1984 -2.1 -7.3;3.4 1984 to 2010 1.0 0.6;1.3 – – –
Other municipalities 1980 to 1999 3.1 2.4;3.9 1999 to 2010 5.0 3.3;6.8 – – –
Northeast Capitals 1980 to 1992 0.4 -0.3;1.1 1992 to 2010 -0.5 -0.8;-0.1 – – –
Other municipalities 1980 to 1997 1.5 1.2;1.9 1997 to 2010 4.9 4.4;5.5 – – –
Southeast Capitals 1980 to 1997 0.9 0.8;1.0 1997 to 2002 -2.8 -3.7;-1.9 2002 to 2010 -0.6 -0.9;-0.2
Other municipalities 1980 to 2010 0.6 0.4;0.8 – – – – – –
South Capitals 1980 to 1991 1.6 1.1;2.2 1991 to 2010 -1.3 -1.5;-1.1 – – –
Other municipalities 1980 to 1993 1.9 1.6;2.2 1993 to 2010 -0.2 -0.4;0.0 – – –
Central-West Capitals 1980 to 1996 1.4 1.0;1.8 1996 to 2010 -0.9 -1.4;-0.4 – – –
Other municipalities 1980 to 2010 2.4 2.0;2.8 – – – – – –
Brazil Capitals 1980 to 1997 0.7 0.6;0.8 1997 to 2003 -2.6 -3.2;-1.9 2003 to 2010 0.0 -0.4;0.5
Other municipalities 1980 to 2010 1.1 1.0;1.2 – – – – – –
e Ministério da Saúde. Pesquisa Nacional Demografia e Saúde da Criança e da Mulher (PNDS-2006). Brasília (DF); 2008.
f Instituto Nacional do Câncer. Viva Mulher. Câncer do Colo do Útero: informações técnico-gerenciais e ações desenvolvidas. Rio de Janeiro: INCA; 2002.
g Lago TG. Políticas nacionais de rastreamento do câncer do colo uterino no Brasil: análise do período 1998 a 2002 [doctoral thesis]. Campinas: Instituto de Filosofia e Ciências Humanas da UNICAMP; 2004.
mortality is attenuated due to better access to diagnostic and treatment measures. The fall in cervical cancer mortality occurred in women all over the Southeast and South, the most developed regions of the country, whereas for women in the North and Northeast it only occurred in the state capitals. Likewise, deaths from breast cancer began to decrease in women living in the state capitals in the South and Southeast from the mid-1990s onwards.
Declining cervical cancer mortality may relect the
protection provided by the Pap smear test. This was not observed in the interior of the North and Northeast.
Breast cancer mortality increased, partly, due to increased incidence of the disease. This may be explained by the increasing adoption of urban life-styles among women, which directly affects the degree of exposure to reproductive factors. The large annual increase in mortality rates in the North and Northeast suggests that changes in reproductive and sexual behavior, initiated in large urban centers, were rapidly adopted by women in other municipalities, even those in low income areas. On the other hand, the reversal in mortality rates that began in the capitals was possible
due to access to diagnostic and treatment measures, more effective at the initial stages of the disease.
Brazilian studies have shown overall rates of HPV infec-tion varying between 13.7% and 54.3%.3 The number of women infected is growing in all regions of the country, probably accompanying early onset of sexual activity.e
This is a malignant neoplasm that can be prevented by screening for intraepithelial neoplastic lesions. Thus, the fall in mortality that began in the more developed regions of Brazil, moving thence to the state capitals in other regions, indicates certain success in screening interven-tions. The increased availability of the Papanicolaou test may have partially reversed the risk of death in women with access to preventative measures.
Actions to control cervical cancer began in the 1980s.
They intensiied between 1999 and 2002, period in
which two campaigns of the Viva Mulher program were conducted,f leading to a substantial increase in provi-sion of the Papanicolaou test in all regions of Brazil.g
However, a fall in mortality from this cancer had been detected in several states even before these initiative Table 3. Correlation between breast and cervical cancer mortality rates and selected socioeconomic and health care indicators. Capitals and other municipalities in Brazil, 2008 to 2010.
Breast cancer Cervical cancer
Indicators Capitals Other municipalities Capitals Other municipalities
Correlation p Correlation p Correlation p Correlation p
Positive
Human development index (HDI) 0.32 0.0990 0.58 0.0020 -0.38 0.0502 -0.38 0.0585
Doctors (per thousand inhabitants)a 0.61 0.0008 0.81 < 0.0001 -0.51 0.0084 -0.29 0.1581
% individuals aged ≤ 25 with more
than 11 years of schooling 0.51 0.0063 0.78 < 0.0001 -0.57 0.0018 -0.37 0.0636
% individuals in households with
electricity 0.36 0.0635 0.71 < 0.0001 -0.17 0.3828 -0.36 0.0745
% individuals in households with plumbing
0.53 0.0047 0.82 < 0.0001 -0.40 0.0404 -0.36 0.0689
Negative
% population aged ≤ 25 who are
illiterate
-0.22 0.2764 -0.47 0.0155 0.18 0.3588 0.27 0.1893
Fertility rate (%) -0.59 0.0013 -0.92 < 0.0001 0.52 0.0056 0.35 0.0754
% individuals living below the
poverty line -0.26 0.1878 -0.62 0.0007 0.45 0.0198 0.46 0.0173
Mortality rate in children < 5 per
1,000 LB -0.16 0.4283 -0.40 0.0429 0.36 0.0613 0.39 0.0508
% female head of household,
single and with children aged ≤ 15
-0.44 0.0223 -0.82 < 0.0001 0.33 0.0895 0.24 0.2421
LB: live births
commenced. Decreases in cervical cancer deaths had been recorded in the municipality of Sao Paulo between 1980 and 1999,8 between 1984 and 20032 and between 1987 and 1998 in the municipalities of Campinas, Piracicaba and Sao Joao da Boa Vista,18 all in the state ofSao Paulo.Similar declines were identiied in Paraná5 and in Minas Gerais between 1980 and 2005.1 Actions to organize screening for the disease at a state and local level, in the case of Sao Paulo and Paraná, may have encouraged the start of the fall in mortality in the South and Southeast.
Data from household surveys conirm an increase in
preventative examinations that became part of national policy for controlling cancer over the last decade. Data from the Pesquisa Nacional de Amostras de Domicílio
(PNAD – National Household Survey) estimated 82.6% coverage of preventative gynecological examinations in women aged 25 to 59 in 2003.h This estimate was 87.1% in 2008, an increase across all income classes, although of a more marked nature among the poorest.
Correlation analysis conirms what has been shown
in the literature.4,6,9 Cervical cancer mortality coefi -cients in the state capitals are inversely correlated with indicators of better socioeconomic status and directly correlated with negative indicators. This indicates that
it is more dificult for women living in state capitals to
have cervical cancer screening tests done. In the inte-rior, only the percentage of individuals living below the poverty line was related to increased mortality from this type of cancer. Are we faced with a situation in which women, outside of urban centers, who do not undergo cervical cancer screening are living in worse conditions? Is inequality in access concentrated in those who live in extreme poverty, while barriers also affect others on low incomes in the capitals?
Breast cancer mortality rates rose in Brazil according to increased positive socioeconomic indicators and decreased as negative indicators, such as fertility rates, increased. This relationship appears better in the inte-rior, suggesting that rates outside of the capitals were not attenuated by women diagnosed with the disease receiving treatment.
The main breast cancer risk factors are related to sexual and reproductive history.14 The fall in mortality in devel-oped countries is attributed to improved survival due to awareness, early detection and improved treatment.11 The demographic transition taking place in Brazil, with falling birth rates and having children later,i weighs
signiicantly in increased incidence of the disease.
Mortality accompanied this increase, which occurred homogeneously in women in different regions of the
country. Lifestyle changes appear to be relected in
reproductive factors and rapidly affect women in the interior. Decreased breast cancer deaths in the South and Southeast may show the results of better access to mammography and specialist treatment services,
bene-itting women diagnosed when the disease is in its early
stages. In Brazil, this phenomenon is more recent than the Pap smear examination.
Although some breast cancer screening proposals were
included in the intensiication stage of the Viva Mulher
program in 2002, it was in 2004 that the Ministry of Health launched the breast cancer control consensus, recommending that women aged between 50 and 69 have a mammogram every two years.j
PNAD datag from 2003 and 2008 conirm increased numbers of mammograms in women in the Ministry of Health target age group (50 to 69 years old), especially among those on higher incomes and with higher levels of education and who have health insurance. Although the percentage of women between 50 and 69 who reported having a mammogram increased from 54.6% in 2003 to 71.5% in 2008, among those with household income > 5 minimum wages, the increase was from 76.6% to 80.7%. These percentages were 20.2% in 2003 and 29.1% in households on an income of < 25.0% minimum wage in 2008, demonstrating considerable inequality in access by socioeconomic level. Residents in metropolitan areas are three times more likely to have the examination than those in other areas.15
The study was based on SIM data, which could pose
a signiicant limitation due to regional differences in
the coverage, completeness and quality of the informa-tion.7 However, previous studies indicate that cancer deaths are better recorded, although some of them may
be included in the undeined causes categories, which
have decreased markedly in this country.13 The
deci-sion to correct 50.0% of undeined deaths, together
with moving averages and joinpoint regression meant
that the trends in cancer mortality coeficients could
be approximated.
The effect of screening on reducing breast cancer mortality is lower than that which occurred with cervical cancer. Recent studies indicate that the impact of mammography screening on mortality is less than hoped10 and that the large reduction in mortality in developed countries is attributable to recent advances in treatment.11 This reality is compatible with countries
h Instituto Brasileiro de Geografia e Estatística. Pesquisa Nacional por Amostra de Domicílios: um panorama da saúde no Brasil: acesso e utilização dos serviços, condições de saúde e fatores de risco e proteção à saúde - PNAD 2008. Rio de Janeiro; 2010.
i Minamiguchi MM. Segunda transição demográfica: o que se pode dizer da situação brasileira? [dissertação de mestrado]. Rio de Janeiro: Escola Nacional de Ciências Estatísticas; 2011.
in which it is not so dificult to access cancer diagnosis
and treatment services. The obstacles are enormous for Brazil’s socioeconomically deprived population.
Urgent measures are needed to guarantee that all women have access to the best diagnosis and treat-ment available.
REFERENCES
1. Alves CMM, Guerra MR, Bastos RR. Tendência de mortalidade por câncer de colo de útero para o Estado de Minas Gerais, Brasil,
1980-2005. Cad Saude Publica. 2009;25(8):1693-700.
DOI:10.1590/S0102-311X2009000800005 2. Antunes JLF, Wünsch-Filho V. The effect of
performing corrections on reported uterine cancer mortality data in the city of São Paulo.
Braz J Med Biol Res. 2006;39(8):1091-9. DOI:10.1590/S0100-879X2006000800012 3. Ayres ARG, Azevedo e Silva G. Prevalência de
infecção do colo do útero pelo HPV no Brasil: revisão
sistemática. Rev Saude Publica. 2010;44(5):963-74.
DOI:10.1590/S0034-89102010000500023 4. Azevedo e Silva G, Gamarra CJ, Girianelli VR,
Valente JG. Tendência da mortalidade por câncer nas capitais e interior do Brasil entre 1980 e
2006. Rev Saude Publica. 2011;45(6):1009-18.
DOI:10.1590/S0034-89102011005000076 5. Bleggi Torres LF, Werner B, Totsugui J, Collaço
LM, Araújo, Huçulak M, et al. Cervical cancer screening program of Paraná: cost-effective model
in a developing country. Diagn Cytopathol.
2003;29(1):49-54. DOI:10.1002/dc.10269 6. Bray F, Jemal A, Grey N, Ferlay J, Forman D.
Global cancer transitions according to the Human Development Index (2008-2030): a
population-based study. Lancet Oncol. 2012;13(8):790-801.
DOI:10.1016/S1470-2045(12)70211-5 7. Felix JD, Zandonade E, Amorim MHC, Castro
DS. Avaliação da completude das variáveis epidemiológicas do Sistema de Informação sobre Mortalidade em mulheres com óbitos por câncer de mama na Região Sudeste: Brasil (1998 a
2007). Cienc Saude Coletiva. 2012;17(4):945-53.
DOI:10.1590/S1413-81232012000400016 8. Fonseca LAM, Ramacciotti AS, Eluf Neto J. Tendência da mortalidade por câncer do útero no Município de São Paulo entre 1980 e
1999. Cad Saude Publica. 2004;20(1):136-42.
DOI:10.1590/S0102-311X2004000100029
9. Gamarra CJ, Valente JG, Silva GA. Correction for reported cervical cancer mortality data in Brazil,
1996-2005. Rev Saude Publica. 2010;44(4):629-38.
DOI:10.1590/S0034-89102010000400006
10. Independent UK Panel on Breast Cancer Screening. The benefits and harms of breast cancer screening: an
independent review. Lancet. 2012;380(9855):1778-86.
DOI:10.1016/S0140-6736(12)61611-0
11. Jatoi I, Miller AB. Why is breast-cancer mortality
declining? Lancet Oncol. 2003;4(4):251-4.
DOI:10.1016/S1470-2045(03)01037
12. Jemal A, Center MM, DeSantis C, Ward EM. Global
patterns of cancer and mortality rates and trends. Cancer
Epidemiol Biomarkers Prev. 2010;19(8):1893-907. DOI:10.1158/1055-9965.EPI-10-0437
13. Jorge MHPM, Gotlieb SLD, Laurenti R. O sistema de informações sobre mortalidade: problemas e propostas para o seu enfrentamento. I - Mortes por causas
naturais. Rev Bras Epidemiol. 2002;5(2):197-211.
DOI:10.1590/S1415-790X2002000200007 14. Kobayashi S, Sugiura H, Ando Y, Shiraki N, Yanagi
T, Yamashita H, et al. Reproductive history and
breast cancer risk. Breast Cancer. 2012;19(4):302-8.
DOI:10.1007/s12282-012-0384-8
15. Oliveira EXG, Pinheiro RS, Melo ECP, Carvalho MS..
Condicionantes socioeconômicos e geográficos do acesso à mamografia no Brasil, 2003-2008.
Cienc Saude Coletiva. 2011;16(9):3649-64. DOI:10.1590/S1413-81232011001000002
16. Pecorelli S, Favalli G, Zigliani L, Odicino F. Cancer in
women. Int J Gynaecol Obstet. 2003;82(3):369-79.
DOI:10.1016/S0020-7292(03)00225
17. Porter PL. Global trends in breast cancer incidence and
mortality. Salud Publica Mex. 2009;51(Suppl 2):s141-6.
DOI:10.1590/S0036-36342009000800003 18. Zeferino LC. O desafio de reduzir a
mortalidade por câncer do colo do útero.
Rev Bras Ginecol Obstet. 2008;30(5):213-5. DOI:10.1590/S0100-72032008000500001