Cop
yright
© ABE&M t
odos os dir
eit
os r
eser
vados
.
Serum uric acid levels and
non-alcoholic fatty liver disease in
Uyghur and Han ethnic groups
in northwestern China
Concentração sérica de ácido úrico e doença hepática gordurosa não alcoólica em grupos étnicos Uyghur e Han no nordeste da China
Wen Cai1, Xuan Wu2, Bei Zhang3, Lei Miao4, Yu-ping Sun5, Yuan Zou6, Hua Yao7
ABSTRACT
Objective: The aim of this study was to compare serum uric acid values in two ethnically distinct Chinese populations: Uyghur, with a high prevalence of nonalcoholic fatty liver disease, and Han, with a lower prevalence. Subjects and methods: Serum uric acid and several clinical features and laboratory tests relevant to the metabolic syndrome were measured in 4,157 Uyghur and 6,448 Han subjects in a health examination program. The diagnosis of hepatic steatosis was established by abdominal ultrasound examination. Results: The prevalence of nonalcoholic fatty liver disease was 42.3% and 33.3% among Uyghur and Han subjects, respectively. The corresponding prevalence of hyperuricemia was 8.8% and 14.7%. The mean concentration of serum uric acid in Uyghurs also was lower than in Hans (282.75 vs. 310.79 µmol/L; p < 0.01). However, in both populations, the prevalence of nonalcoholic fatty liver disease was increased in association with increasing serum uric acid con-centrations, a trend that was more pronounced in Uyghur than in Han subjects (OR 3.279 and 3.230, respectively). Several components of the metabolic syndrome were more pronounced in Uyghurs than in Hans. Conclusions: Serum uric acid is an independent risk factor in nonalcoholic fatty liver disease in both Uyghurs and Hans, but other risk factors may be more important in the differences in prevalence of the disease between the two ethnic groups. Arq Bras Endocrinol Metab. 2013;57(8):617-22
Keywords
Non-alcoholic fatty liver disease; serum uric acid; Uyghur; Han; hyperuricemia
RESUMO
Objetivo: O objetivo deste estudo foi comparar os valores de ácido úrico em duas populações chine-sas etnicamente diferentes: Uyghur, com alta prevalência de doença hepática gordurosa não alcoó-lica, e Han, com prevalência mais baixa. Sujeitos e métodos. A concentração sérica de ácido úrico e várias características clínicas e testes laboratoriais relevantes para a síndrome metabólica foram determinados em 4.157 indivíduos Uyghur e 6.448 indivíduos Han submetidos a um programa de
checkups. O diagnóstico de esteatose hepática foi estabelecido por ultrassom abdominal. Resulta-dos: A prevalência de doença hepática gordurosa não alcoólica foi de 42,3% e 33,3% entre os indi-víduos Uyghur e Han, respectivamente. A prevalência correspondente de hiperuricemia foi de 8,8% e 14,7%. A concentração sérica média de ácido úrico em Uyghurs também foi mais baixa do que em Hans (282,75 contra 310,79 µmol/L; p < 0,01). Entretanto, em ambas as populações, a prevalência de doença hepática gordurosa não alcoólica aumentou com a elevação da concentração sérica de ácido úrico, uma tendência mais pronunciada em Uyghurs do que em Hans (OR 3,279 e 3,230, respectiva-mente). Vários componentes da síndrome metabólica são mais pronunciados em Uyghurs do que em Hans. Conclusões: A concentração sérica de ácido úrico é um fator de risco independente para a doença hepática gordurosa não alcoólica tanto em Uyghurs quando em Hans, mas outros fatores de risco podem ser mais importantes nas diferenças na prevalência da doença entre esses dois grupos étnicos. Arq Bras Endocrinol Metab. 2013;57(8):617-22
Descritores
Doença hepática gordurosa não alcoólica; ácido úrico sérico, Uyghur; Han; hiperuricemia
1 School of Nursing, Xinjiang Medical University, Urumqi, Xinjiang, P. R. China 2 The Fourth Afiliated Hospital of Xinjiang Medical University, Urumqi, Xinjiang, P. R. China 3 School of Basic Medical Sciences of Xinjiang Medical University, Urumqi, Xinjiang, P. R. China 4 Department of Public Health, Xinjiang Medical University, Urumqi, Xinjiang, P. R. China 5 School of Basic Medical Sciences of Xinjiang Medical University, Urumqi, Xinjiang, P. R. China 6 Center of Health Examination, The First Afiliated Hospital of Xinjiang Medical University, Urumqi, Xinjiang, P. R. China 7 Clinical Medical Research Institute, The First Afiliated Hospital of Xinjiang Medical University,Urumqi, Xinjiang, P. R. China
Correspondence to:
Hua Yao
Clinical Medical Research Institute, The First Afiliated Hospital of Xinjiang Medical University, No.137 Liyushan South Road, Urumqi,
830054 – Xinjiang, P. R. China [email protected]
Cop
yright
© ABE&M t
odos os dir
eit
os r
eser
vados
.
INTRODUCTION
N
on-alcoholic fatty liver disease (NAFLD) is a common accompaniment of metabolic syndrome (MS), which is characterized by insulin resistance, obesity, dyslipidemia, and hypertension (1). In recent years, an association between elevated serum uric acid concentrations and NAFLD has been reported (2-9). Some authors have concluded that hyperuricemia is an independent risk factor for NAFLD, and is even related to its histologic severity (7).This study tried to extend existing knowledge on NAFLD and associated hyperuricemia by measuring uric acid in two ethnically distinct populations, Uy-ghur and Han, in the Xinjiang region of northwestern China. Uyghur have a high prevalence of NAFLD, an increasingly severe medical problem among them. The two populations differ markedly in their genetic back-ground, lifestyle and dietary habits.
SUBJECTS AND METHODS
Study population
All subjects voluntarily visited the health promotion cen-ter of Xinjiang Medical University First Afiliated Hos-pital, China, for annual checkups between March, 2012 and March, 2013. The following category of subjects were excluded: missing covariate information; alcohol consumption greater than 20 g/day for men and 10 g/ day for women; positive test for hepatitis B antigens or hepatitis C antibodies; history of other known causes of chronic liver disease, such as other viral hepatitides or autoimmune hepatitis; use of hepatotoxic medications; history of cancer, respiratory problems, renal diseases, or endocrine disorder. After the exclusions, 10,605 sub-jects (4,157 Uyghur and 6,448 Han, with mean age of 43.24 ± 12.91 years for Uyghurs and 42.24 ± 12.91 years for Hans) were included in the inal analysis.
Clinical examination
Data on cigarette smoking, alcohol consumption, physical activity, dietary habits, and family history of hypertension, diabetes or NAFLD were obtained through a questionnaire. Physical examinations were performed by trained medical staff using a standard-ized procedure. Standing height and body weight were measured without shoes or outer clothing. Body mass index (BMI) was calculated as the ratio of weight in
kilograms to height in meters squared. Waist circum-ference (WC) was measured with the measuring tape positioned midway between the lowest rib and the su-perior border of the iliac crest as the patient exhaled normally. Blood pressure was measured using the auto-matic clinical blood pressure monitor while the subjects were seated comfortably after a rest period of at least 10 min. All blood samples were obtained from the ante-cubital vein in the morning after overnight fast. Serum triglyceride (TG), total cholesterol (TC), high-density lipoprotein (HDL), low-density lipoprotein (LDL), serum uric acid (SUA), fasting plasma glucose (FPG), aspartate aminotransferase (AST), alanine aminotrans-ferase (ALT), blood urea nitrogen (BUN), and serum creatinine (SCr) were measured.
Hepatic ultrasound examination was performed in all subjects by a trained ultrasonographist who was un-aware of the goals of the study and blinded to laborato-ry indings, using an ultrasound machine (CDUS512, Siemens, Japan) with a 3.5-MHz probe. Hepatic ste-atosis was diagnosed by characteristic echo patterns ac-cording to conventional criteria.
Deinitions
Hyperuricemia was deined as a SUA level ≥ 417 μmol/L (7.0 mg/mL) in men and ≥ 357 μmol/L (6.0 mg/mL) in women who were taking no medicines or antioxidants. The diagnosis of dyslipidemia was based on the deinition recommended by The Diabetes Asso-ciation of the Chinese Medical AssoAsso-ciation in 2004: hy-pertriglyceridemia: triglycerides ≥ 1.7 mmol/L; hyper-cholesterolemia: cholesterol ≥ 5.72 mmol/L; low HDL: HDL < 0.9 mmol/L for men and < 1.0 mmol/L for women; high LDL: LDL ≥ 3.37 mmol/L; elevated fast-ing plasma glucose: FPG ≥ 6.1 mmol/L. Hypertension was deined as SBP ≥ 140 mmHg, DBP ≥ 90 mmHg or previously diagnosed hypertension. Overweight or obe-sity was deined as BMI ≥ 25 kg/m2 in both genders.
This study was approved by the Ethics Committee of the First Afiliated Hospital of Xinjiang Medical Uni-versity and was conducted according to the standards of the Declaration of Helsinki. Written informed consent was obtained from the participants (20120220-135).
Statistics
Cop
yright
© ABE&M t
odos os dir
eit
os r
eser
vados
.
continuous variables were expressed as means and stan-dard deviations (SD), whereas categorical variables were summarized in frequency and percentage. Inde-pendent two-sample t-tests were used for the investiga-tion of any associainvestiga-tion with NAFLD. Odds ratio (OR) and 95% conidence interval (CI) for the presence of NAFLD, according to the SUA levels, were calculated using logistic multiple regression.
The risk factors of hyperuricemia in NAFLD patients were examined using logistic tests. Multivariate logistic regression was performed to draw models of risk for hy-peruricemia in subjects with NAFLD that included gen-der, race, hypertriglyceridemia, high LDL, low HDL, elevated FPG, hypertension, and obesity as independent variables. All statistical tests were 2-sided, and P < 0.05 was recognized as the level of statistical signiicance.
RESULTS
Characteristics of study subjects
Table 1 shows the clinical and biochemical characteris-tics of the 4,157 Uyghurs and 6,448 Hans. There was no signiicant difference in mean age and sex between the two populations. Mean BMI, WC, TC, LDL, AST, and ALT were signiicantly higher in Uyghurs, whereas SUA, BUN, systolic blood pressure (SBP), diastolic blood pressure (DBP), FPG, TG, HDL, and SCr were signiicantly lower in Uyghurs. Mean SUA was 282.75
± 90.74 μmol for Uyghur and 310.79 ± 92.10 μmol for Hans, a statistically signiicant difference.
The prevalence of NAFLD in Uyghur and Han populations
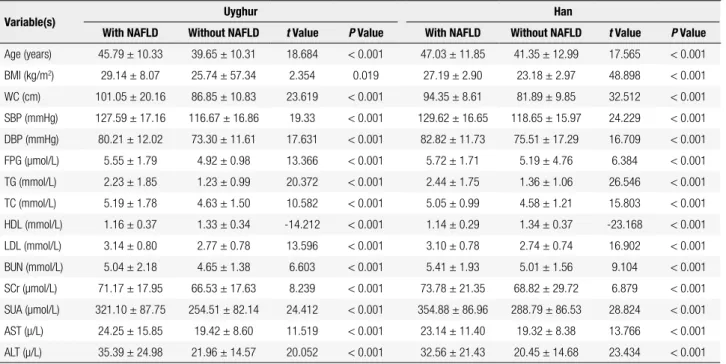
On the population that was evaluated, 1,758 Uyghurs (42.3%) and 2,148 Hans (33.3%) met the diagnostic criteria for NAFLD. As illustrated in table 2, mean BMI, WC, SPB, and DBP were higher in both the Uyghur and Han subjects who had NAFLD than in those who did not. Also, the NAFLD subjects had the worst me-tabolic proile: serum lipid values, liver enzymes, BUN, SCR, and FBG. In particular, SUA concentration was signiicantly higher in the subjects with NAFLD than in those without NAFLD.
Association of SUA level with prevalence rate of NAFLD and metabolic syndrome
The proportion of subjects with hyperuricemia was 8.8% (351) of Uyghur and 14.7% (946) of Hans, show a highly signiicant difference (χ2= 80.791, P < 0.001).
The proportion of subjects with MS was 29.9% (3172), the proportion with MS in the NAFLD and without NAFLD population was 55.97% (2186), 14.72% (986), a statistically signiicant difference (χ2 = 2002.309, P <
0.001).
All subjects were classiied into quartiles according to SUA levels within the normal range; a ifth group, with SUA values above the normal range, served as the hyperuricemic group. For males, Q1 was ≤ 281.68 μmol/L, Q2 281.69-328.00 μmol, Q3 328.01-367.38 μmol, Q4 367.39-416.99 μmol, and Q5 ≥ 417.00 μmol. For females, Q1 was ≤ 194.00 μmol/L, Q2 194.01-231.95 μmol, Q3 231.96-270.83 μmol, Q4 270.84-356.99 μmol, and Q5 ≥ 357.00 μmol. Table 3 shows the prevalence of MS in the Uyghur and Han population, as well as the proportion of MS in each quartile of SUA. With SUA level increased, the per-centages of MS were increased for Uyghur and Hans. The presence of MS and SUA levels were found signii-cant in the Uyghur and Han population.
Table 4 shows the risk of NAFLD according to the SUA level. In comparison with Uyghur and Han sub-jects in quintile 1, odds ratio (95% CI) in quintile 5 were 8.878 (6.757-11.646) for Uyghur, and 7.597 (6.182-9.335) for Han, respectively (P < 0.001). The relation-ship of SUA with NAFLD remained signiicant even after adjustment for indictors of metabolic syndrome in-Table 1. Clinical and biochemical characteristics among the Uyghur and
Han populations
Variables Uyghur Han t Value P Value
BMI (kg/m2) 27.19 ± 43.80 24.54 ± 3.51 3.691 0.000
WC (cm) 93.03 ± 17.11 86.34 ± 11.16 16.846 0.000
SBP (mmHg) 121.31 ± 17.82 122.33 ± 17.00 -2.758 0.006
DBP (mmHg) 76.24 ± 12.27 77.96 ± 16.02 -5.572 0.000
FPG (μmol/L) 5.18 ± 1.41 5.37 ± 4.02 -2.833 0.005
TG (mmol/L) 1.65 ± 1.50 1.72 ± 1.42 -2.256 0.024
TC (mmol/L) 4.86 ± 1.65 4.74 ± 1.16 4.294 0.000
HDL (mmol/L) 1.25 ± 0.36 1.27 ± 0.36 -2.227 0.026
LDL (mmol/L) 2.94 ± 0.81 2.87 ± 0.77 4.156 0.000
BUN (mmol/L) 4.81 ± 1.78 5.14 ± 1.70 -9.486 0.000
SCr (μmol/L) 68.49 ± 17.91 70.47 ± 27.32 -4.492 0.000
SUA (μmol/L) 282.75 ± 90.74 310.79 ± 92.10 -15.224 0.000
AST (μ/L) 21.46 ± 12.43 20.59 ± 9.66 3.819 0.000
ALT (μ/L) 27.64 ± 20.74 24.48 ± 18.14 7.987 0.000
Findings are presented as means ± standard deviation. P values were determined from
Cop
yright
© ABE&M t
odos os dir
eit
os r
eser
vados
.
Table 2. Demographic and biochemical characteristics of the subjects according to their NAFLD status
Variable(s) Uyghur Han
With NAFLD Without NAFLD t Value P Value With NAFLD Without NAFLD t Value P Value
Age (years) 45.79 ± 10.33 39.65 ± 10.31 18.684 < 0.001 47.03 ± 11.85 41.35 ± 12.99 17.565 < 0.001
BMI (kg/m2) 29.14 ± 8.07 25.74 ± 57.34 2.354 0.019 27.19 ± 2.90 23.18 ± 2.97 48.898 < 0.001
WC (cm) 101.05 ± 20.16 86.85 ± 10.83 23.619 < 0.001 94.35 ± 8.61 81.89 ± 9.85 32.512 < 0.001
SBP (mmHg) 127.59 ± 17.16 116.67 ± 16.86 19.33 < 0.001 129.62 ± 16.65 118.65 ± 15.97 24.229 < 0.001
DBP (mmHg) 80.21 ± 12.02 73.30 ± 11.61 17.631 < 0.001 82.82 ± 11.73 75.51 ± 17.29 16.709 < 0.001
FPG (μmol/L) 5.55 ± 1.79 4.92 ± 0.98 13.366 < 0.001 5.72 ± 1.71 5.19 ± 4.76 6.384 < 0.001
TG (mmol/L) 2.23 ± 1.85 1.23 ± 0.99 20.372 < 0.001 2.44 ± 1.75 1.36 ± 1.06 26.546 < 0.001
TC (mmol/L) 5.19 ± 1.78 4.63 ± 1.50 10.582 < 0.001 5.05 ± 0.99 4.58 ± 1.21 15.803 < 0.001
HDL (mmol/L) 1.16 ± 0.37 1.33 ± 0.34 -14.212 < 0.001 1.14 ± 0.29 1.34 ± 0.37 -23.168 < 0.001
LDL (mmol/L) 3.14 ± 0.80 2.77 ± 0.78 13.596 < 0.001 3.10 ± 0.78 2.74 ± 0.74 16.902 < 0.001
BUN (mmol/L) 5.04 ± 2.18 4.65 ± 1.38 6.603 < 0.001 5.41 ± 1.93 5.01 ± 1.56 9.104 < 0.001
SCr (μmol/L) 71.17 ± 17.95 66.53 ± 17.63 8.239 < 0.001 73.78 ± 21.35 68.82 ± 29.72 6.879 < 0.001
SUA (μmol/L) 321.10 ± 87.75 254.51 ± 82.14 24.412 < 0.001 354.88 ± 86.96 288.79 ± 86.53 28.824 < 0.001
AST (μ/L) 24.25 ± 15.85 19.42 ± 8.60 11.519 < 0.001 23.14 ± 11.40 19.32 ± 8.38 13.766 < 0.001
ALT (μ/L) 35.39 ± 24.98 21.96 ± 14.57 20.052 < 0.001 32.56 ± 21.43 20.45 ± 14.68 23.434 < 0.001
Findings are presented as means ± standard deviation.
P values were determined from independent two-sample t-tests.
Table 3. Prevalence of metabolic syndrome and SUA level among Uyghur and Han populations
SUA level Uyghurs Han
MS Without MS MS Without MS
Q1(normal) 253 (20.49%) 982 (79.51%) 191 (17.32) 912 (82.68%)
Q2 (normal) 230 (23.61%) 744 (76.39%) 281 (20.86%) 1,066 (79.14%)
Q3 (normal) 287 (34.41%) 547 (65.59%) 372 (24.95%) 1,119 (75.05%)
Q4 (normal) 312 (42.68%) 419 (57.32%) 528 (33.95%) 1,027 (66.05%)
Q5 (hyperuricemia) 221 (57.70%) 162 (42.30%) 497 (52.21%) 455 (47.79%)
χ2 value 265.667 395.984
P value < 0.001 < 0.001
Table 4. Odds ratios and 95% conidence intervals (95% CI) for the presence of NAFLD according to the SUA level in Uyghurs and Hans
SUA level Uyghurs Hans
p ORa 95% Ca p ORb 95% CIb p ORa 95% CIa p ORb 95% CIb
Q1 (normal) 1 Reference 1 Reference 1 Reference 1 Reference
Q2 (normal) 0.000 1.629 1.352-1.962 0.013 1.366 1.069-1.746 0.000 1.722 1.407-2.107 0.003 1.512 1.156-1.978
Q3 (normal) 0.000 2.813 2.327-3.400 0.000 1.908 1.485-2.451 0.000 2.174 1.789-2.642 0.000 1.766 1.361-2.293
Q4 (normal) 0.000 4.108 3.369-5.009 0.000 2.282 1.755-2.966 0.000 3.413 2.824-4.125 0.000 2.177 1.686-2.812
Q5 (hyperuricemia) 0.000 8.878 6.757-11.664 0.000 3.253 2.304-4.594 0.000 7.597 6.182-9.335 0.000 3.053 2.321-4.015
P values, Odds ratios and 95% CI were calculated using logistic regression analysis.
a Unadjusted; b After adjustment for age, gender, hypertension, diabetes, dyslipidemia, and obesity.
For males, Q1 was ≤ 281.68 μmol/L, Q2 281.69-328.00 μmol, Q3 328.01-367.38 μmol, Q4 367.39-416.99 μmol, and Q5 ≥ 417.00 μmol. For females, Q1 was ≤ 194.00 μmol/L, Q2 194.01-231.95 μmol, Q3 231.96-270.83 μmol, Q4 270.84-356.99 μmol, and Q5 ≥ 357.00 μmol.
cluding obesity, hypertension, hypertriglyceridemia, hy-percholesterolemia, low HDL cholesterol, elevated LDL cholesterol and FPG, the adjusted OR for the presence
Cop
yright
© ABE&M t
odos os dir
eit
os r
eser
vados
.
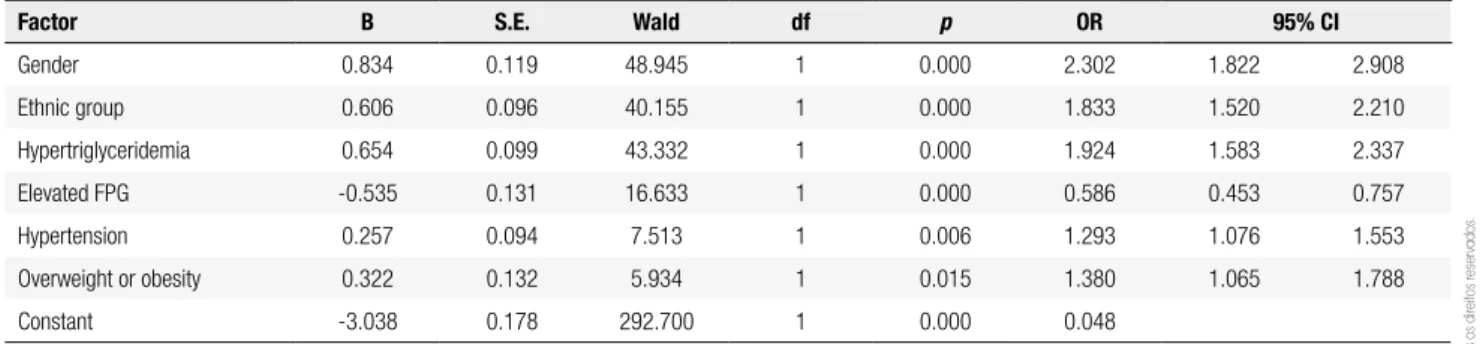
Risk factor analysis for hyperuricemia in NAFLD patients
In the multivariate logistic regression analysis, hyper-uricemia was used as the dependent variable, and gen-der, ethnic group, hypertriglyceridemia, high LDL, low HDL, elevated FPG, hypertension, and obesity as the independent variables. After adjustment for poten-tial confounders, male gender (OR = 2.302; 95% CI: 1.822-2.908), the Han ethnicity (OR = 1.833; 95% CI: 1.520-2.210), serum triglycerides greater than 1.7 mmol/L (OR = 1.924; 95% CI: 1.583-2.337), eleva-ted FPG greater than 6.1 mmol/L (OR = 0.586; 95% CI: 0.453-0.757), overweight or obesity (OR = 1.380; 95% CI: 1.065-1.788), were independently associated with the occurrence of hyperuricemia (Table 5).
DISCUSSION
In this study, the relationships between serum uric acid concentrations and NAFLD in two dis-tinct ethnic groups, Uyghur and Han in northwest China, which have different prevalence of the dis-ease, the major indings were that serum uric acid concentrations and NAFLD (as well as several com-ponents of the metabolic syndrome) were correlated in both populations, despite a higher prevalence of NAFLD among Uyghurs than among Hans.
The Uyghur and Han populations differ greatly in genetic background, lifestyle and dietary habits. Uy-ghur, the largest minority in Xinjiang Uyghur Autono-mous Region of China, are a Turkish ethnic group. In dietary preferences, they generally prefer pasta, meat, cheese, condensed milk, and butter to fresh vegetables. Overweight and central obesity are common among
Table 5. Multivariable analysis of risk factor for hyperuricemia in NAFLD subjects
Factor B S.E. Wald df p OR 95% CI
Gender 0.834 0.119 48.945 1 0.000 2.302 1.822 2.908
Ethnic group 0.606 0.096 40.155 1 0.000 1.833 1.520 2.210
Hypertriglyceridemia 0.654 0.099 43.332 1 0.000 1.924 1.583 2.337
Elevated FPG -0.535 0.131 16.633 1 0.000 0.586 0.453 0.757
Hypertension 0.257 0.094 7.513 1 0.006 1.293 1.076 1.553
Overweight or obesity 0.322 0.132 5.934 1 0.015 1.380 1.065 1.788
Constant -3.038 0.178 292.700 1 0.000 0.048
Multivariate logistic regression model included the following candidate risk factors: gender, ethnic group, hypertriglyceridemia, hypercholesterolemia, high LDL, low HDL, elevated FPG, hypertension, and obesity. The variables entered into the model were those that remained signiicantly associated with nonalcoholic fatty liver disease: gender, ethnic group, hypertriglyceridemia, high LDL, elevated FPG. Hypertriglyceridemia: triglycerides ≥ 1.7 mmol/L; hypercholesterolemia: cholesterol ≥ 5.72 mmol/L; high LDL: LDL ≥ 3.37 mmol/L; low HDL: HDL < 0.9 mmol/L for men and < 1.0 mmol/L for women; elevated fasting plasma glucose: FPG ≥ 6.1 mmol/L; hypertension was deined as SBP ≥ 140 mmHg, DBP ≥ 90 mmHg or previously diagnosed hypertension. Overweight or obesity was
deined as BMI ≥ 25 kg/m2 in both genders.
Uyghurs, and NAFLD is becoming a serious health problem among them. Han are the traditional Chinese, native of China.
Although the indings have documented that in-creased serum uric acid concentrations are indepen-dent risk factors for NAFLD among both Uyghurs and Hans, the lower prevalence of hyperuricemia among Uyghurs seems paradoxical. This inding may indicate that various components of the metabolic syndrome, lifestyle, dietary habits and genetic susceptibility are more important in the pathogenesis of NAFLD in Uy-ghurs than in Hans.
Cop
yright
© ABE&M t
odos os dir
eit
os r
eser
vados
.
The results of the study corroborate and have ex-tended the results of previous studies. Others researchers in China and Korea (2-6) have also found that elevated serum uric acid levels, even within the normal range, predict an increased risk of NAFLD. The study has bet-ter deined the relative signiicance of hyperuricemia and other risk factors in different ethnic groups. The study showed that similar analyses should be conducted in other populations. Especially in non-Asian ones.
Multivariate regression analysis showed that hyper-triglyceridemia and male gender were the dominant risk factors for hyperuricemia in NAFLD subjects. This observation may relect the inluences of hyperten-sion, smoking, and a high-fat diet. It also found that elevated plasma glucose values were protective against hyperuricemia. The latter inding is consistent with the observation that elevated plasma glucose and increased urinary excretion of glucose competitively inhibits uric acid reabsorption in the proximal tubules, and results in increase uric acid excretion (17).
The study does not deine causal relationships be-tween serum uric acid and NAFLD, this is a challenge that will require further study. The study also recog-nizes that the population was check-up crowd in gov-ernment departments and enterprises, and may not be representative of more diverse populations.
It concluded that increased serum uric acid concen-trations are a risk factor in NAFLD, but other factors in the metabolic syndrome may overshadow the effects of hyperuricemia in some populations. The possible pathogenetic role of uric acid in NAFLD and the meta-bolic syndrome deserves to be further studied.
Disclosure: no potential conlict of interest relevant to this article was reported.
REFERENCES
1. Petta S, Muratore C, Craxi A. Nonalcoholic fatty liver disease pathogenesis: the present and the future. Dig Liver Dis. 2009;41:615-25.
2. Lee YJ, Lee HR, Lee JH, Shin YH, Shim JY. Association between serum uric acid and non-alcoholic fatty liver disease in Korean adults. Clin Chem Lab Med. 2010;48:175-80.
3. Xu C, Yu C, Xu L, Miao M, Li Y. High serum uric acid increases the risk for non-alcoholic fatty liver disease: a prospective observational study. PLoS. 2010;14:e11578.
4. Li Y, Xu C, Yu C, Xu L, Miao M. Association of serum uric acid level with non-alcoholic fatty liver disease: a cross-sectional study. J Hepatology. 2009;50:1029-34.
5. Hwang IC, Suh JY, Suh AR, Ahn HY. The relationship between normal serum uric acid and nonalcoholic fatty liver disease. J Korean Med Sci. 2011;26:389-91.
6. Lee JW, Cho YK, Ryan M, Kim H, Lee SW, Chang E, et al. Serum uric acid as a predictor for the development of non-alcoholic fatty liver disease in apparently healthy subjects: a 5-year retrospective cohort study. Gut Liver. 2010;4:378-83.
7. Kuo CF, Yu KH, Luo SF, Chiu CT, Ko YS, Hwang JS, et al. Gout and risk of non-alcoholic fatty liver disease. Scand J Rheumatol. 2010;39:466-71.
8. Petta S, Camma C, Cabibi D, DiMarco V, Craxi A. Hyperuricemia is associated with histological liver damage in patients with non-alcoholic fatty liver disease. Aliment Pharmacol Ther. 2011;34:757-66. 9. Vos MB, Colvin R, Belt P, Molleston JP, Murray KF, Rosenthal P, et
al. Correlation of vitamin E, uric acid, and diet composition with histologic features of pediatric NAFLD. J Pediatr Gastroenterol Nutr. 2012;54:90-6.
10. Albano E, Mottaran E, Occhino G, Reale E, Vidali M. Review article: role of oxidative stress in the progression of non-alcoholic steatosis. Aliment Pharmacol Ther. 2005;22 Suppl 2:71-3. 11. Nieto FJ, Iribarren C, Gross MD, Comstock GW, Cutler RG. Uric acid
and serum antioxidant capacity: a reaction to atherosclerosis? Atherosclerosis. 2000;148:131-9.
12. Waring WS, Webb DJ, Maxwell SR. Systemic uric acid administration increases serum antioxidant capacity in healthy volunteers. J Cardiovasc Pharmacol. 2001;38:365-71.
13. Garcia-Ruiz I, Rodriguez-Juan C, Diaz-Sanjuan T, del Hoyo P, Colina F, Munoz-Yague T, et al. Uric acid and anti-TNF antibody improve mitochondrial dysfunction in ob/ob mice. Hepatology. 2006;44:581-91.
14. Hayden MR, Tyagi SC. Uric acid: a new look at an old riskmarker for cardiovascular disease, metabolic syndrome, and type 2 diabetes mellitus: the urate redox shuttle. Nutr Metab (Lond). 2004;1:10.
15. Suzuki I, Yamauchi T, Onuma M, Nozaki S. Allopurinol, an inhibitor of uric acid synthesis – Can it be used for the treatment of metabolic syndrome and related disorders? Drugs Today (Barc). 2009;45:363-78.
16. Sanchez-Lozada LG, Mu W, Roncal C, Sautin YY, Abdelmalek M, Reunqiui S, et al. Comparison of free fructose and glucose to sucrose in the ability to cause fatty liver. Eur J Nutr. 2010;49:1-9. 17. Hu C-b, Shi J-p. The relationship between fatty liver and